MJCCA9 – 682 ISSN 1857-5552 e-ISSN 1857-5625
Received: March 3, 2015 UDC:
Accepted: September 14, 2015 Original scientific paper
DEVELOPMENT OF CHROMATOGRAPHIC METHODS FOR THEBAINE DETECTION
AND QUANTIFICATION ALONG WITH SOME OF RELATED ALKALOID
DERIVATIVES
Marija Spasevska1,2, Jane Bogdanov2*, Hristina Babunovska1
1
Alkaloid AD Skopje – Pharmaceutical, Chemical, Cosmetic & Botanical Industry, AleksandarMakedonski No. 12, Skopje, Republic of Macedonia
2
Institute of Chemistry, Faculty of Natural Sciences and Mathematics, Ss. Cyril and Methodius University, Arhimedova 5, MK-1001, Skopje, Republic of Macedonia
[email protected], [email protected]
A RP–HPLC–UVD method for qualitative analysis and quantification of thebaine was developed utilizing RP-C18 monolithic column, gradient elution with trifluoroacetic acid and formic acid in water and in acetonitrile and detection wavelength of 285 nm. The effects of the relevant chromatographic con-ditions were investigated and the optimized and validated method was usеd for analysis of three in-house prepared batches of thebaine. Additionally, a complementary GC–MS method was developed for identifi-cation of thebaine and potential impurities. In parallel the batches were analyzed by routine methods for preliminary quality assessment based on physical and spectroscopic properties (melting point, specific optical rotation, UV–Vis and IR spectroscopy). There was correlation between the samples purity as de-termined by the developed HPLC method and the melting point ranges. The HPLC method herein presented is suitable for routine quantitative analysis regardless of the method of thebaine preparation and it is suitable for its corresponding free base or salt form. Additionally, considering the mobile phase com-patibility, it can be adapted/transferred easily for HPLC–MS analysis, especially if the identity of the im-purities needs to be determined.
Keywords: thebaine; HPLC; purity; GC–MS; physical properties; spectroscopic properties;
РАЗВОЈ НА ХРОМАТОГРАФСКИ МЕТОДИ ЗА ДЕТЕКЦИЈА И КВАНТИФИКАЦИЈА НА ТЕБАИН ЗАЕДНО СО НЕКОИ СРОДНИ АЛКАЛОИДНИ ДЕРИВАТИ
Mетодатa RP–HPLC–UVD за квалитативна анализа и квантификација на тебаин е развиена со користење на монолитна колона RP-C18. Методата е со градиентна елуција со трифлуорооцетна и мравја киселина во вода и ацетонитрил и со детекција на 285 nm. Беа евалуирани ефектите на релевантните хроматографски услови и оптимизираната и валидирана метода беше применета за анализа на три подготвени серии тебаин. Дополнително беше развиена комплементарна GC–MS метода за идентификација на тебаин и потенцијалните нечистотии. Паралелно со хромато-графските методи, примероците на тебаин беа анализирани со рутински методи за прелиминарно одредување на квалитет, базирани на физички и спектроскопски својства (температура на топење, оптичка ротација, УВ–видлива и инфрацрвена спектроскопија). Постои корелација помеѓу чистотата на примероците одредена со HPLC и соодветните опсези на температурите на топење. Прикажаната HPLC метода е соодветна за рутинска анализа без разлика на методата на подготовка и може да се користи за тебаин како слободна база и за негови соли. Додатно, ако се земе предвид компатибилноста на мобилната фаза, развиената метода лесно може да се адаптира/трансферира за анализи со HPLC-MS, особено ако е потребно да се одреди идентитетот на нечистотиите.
1. INTRODUCTION
Thebaine belongs to the group of plant-derived natural products containing basic nitrogen called alkaloids. These opium alkaloids are often used in everyday life, medicine and pharmaceutical industry because of their (sometimes spectacular) pharmacological effects; but one should be careful because most of them are toxic especially to other organisms [1–4]. They can be purified from crude extracts by acid-base extraction and most often they are extracted from the poppy capsules of Papaver somniferum L. by two commercial meth-ods. The first method produces opium–dried latex collected from the wound of an immature capsule after it has been cut. The second method for alka-loid purification uses the mature poppy capsules and stems which are collected than threshed to re-move the seeds and form a straw. The straw is dried, if necessary, to about 15% and then water or solvent extraction is employed to extract the alka-loids from the straw [1–4]. According to the Merck Index, the opium and the straw from the usually grown Papaver somniferum L. on dry basis contain thebaine in commercially useful concentration [5]. The amounts of the present alkaloids in opium and straw are given in Тable 1. Even though there are plant varieties that give higher yields of thebaine, the main goal is to extract thebaine from the more common species that are commercially used for obtaining morphine.
T a b l e 1
Composition of alkaloids in % in opium and straw
% (m/m) of alkaloid Opium Straw
Morphine 10–16 1–3
Codeine 0.8–2.5 0.05–0.3
Thebaine 0.5–2 0.15–0.65
Oripavine 0–0.1 0–0.05
Thebaine, as shown before in Table 1, is present in very small amounts in the opium and straw and morphine is the major alkaloid that is extracted from capsules of the poppy plant of Papaver somniferum L. This is one of the reasons for the limited availability of thebaine and its high cost. Alternatively, thebaine can be produced in high yields and in a highly pure form by a multi-step synthesis that utilizes codeine or a codeine salt as the starting material [1–6]. Although these semi-syntheses are effective, the availability of thebaine is limited by its high cost because the total synthe-sis requires many steps. That is the main reason that the supply of thebaine is limited to some frac-tion of the demand for morphine.
O
H3CO
N CH3
H3CO
1
1 2 3
4
5
6 7
8 9 10 11
12 13
14
15 16 17
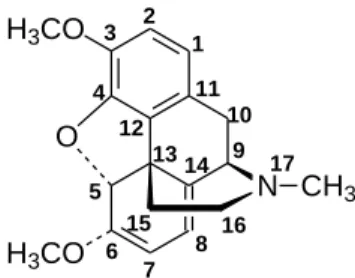
Fig. 1. Chemical structure of thebaine (6,7,8,14-tetradehydro-4,5α-epoxy-3,6-dimethoxy-17-methylmorphinan)
Usually in the opium several alkaloids other than thebaine are present: morphine (2), pseudomorphine (3), codeine (4), oripavine (5), papaverine (6)andnoscapine (7). It is important to note that the N-oxides of the more abundant alka-loids (morphine, codeine, thebaine and oripavine) may also be present. Important opiate derivatives such as hydrocodone and the ring-C bridged com-pounds buprenorphine and etorphine are most practically prepared from thebaine. Being an im-portant starting material for many useful com-pounds, particularly 14-hydroxy-substituted mor-phine derivatives that are important narcotic anal-gesics and/or antagonists, e.g. oxycodone, oxymorphone, nalbuphine, naloxone, naltrexone and nalmefene, the demand of thebaine is increas-ing [1–4]. The main properties of thebaine and re-lated alkaloids are given in Table 2 [5, 6].
O
HO
N H
CH3 HO
O HO
N H
CH3
OH
O OH
N
H CH3
HO O
H3CO
N CH3 H3CO
O
HO
N H
CH3 H3CO
1 2
3
4
5
6 7
O
H3CO
N CH3 HO
N OCH3
OCH3
H3CO H3CO
O O
H3CO N
O
H H
O OCH
3 OCH3 CH3
Fig. 2. Chemical structures of alkaloids present in Papaver somniferum L.: thebaine (1), morphine (2), pseudomorphine (3), codeine (4), oripavine (5), papaverine (6) and noscapine (7)
T a b l e 2
Physical properties of thebaine and related (investigated) alkaloids, taken from literature
Num. Alkaloid trivial name*
Molecular formula
Molecular weight
CAS reg. number
Melting point (ºC) Specific optical rotation
1 Thebaine C
19H21NO3 311 115-37-7 193 -219 (p = 2 in
ethanol)** 2 Morphine C17H19NO3 285 57-27-2 254–256, with dec.
(of monohydrate)
-132 (methanol) for monohydrate
3 Pseudomorphine C34H36N2O6 568 125-24-6 327, dec. (of trihydrate)
/
4 Codeine C18H21NO3 299 76-57-3 154–156 -136 (c = 2 in
etha-nol) ** for monohydrate
5 Oripavine C18H19NO3 297 467-04-9 200–201 -211.8
6 Papaverine C20H21NO4 339 58-74-2 147, from alcohol
and ether
0
7 Noscapine C22H23NO7 413 128-62-1 176, dec. +32 (c = 4.56 in
water) ** for hydrochloride * IUPAC names:
1. 6,7,8,14-tetradehydro-4,5α-epoxy- 3,6-dimethoxy-17-methylmorphinan 2. (5α,6α)-7,8-didehydro- 4,5-epoxy-17-methylmorphinan-3,6-diol
3. (5α,6α)-2-[(5α,6α)-3,6-dihydroxy-17-methyl-7,8-didehydro-4,5-epoxymorphinan-2-yl]-17-methyl-7,8-didehydro-4,5- epoxymorphinan-3,6-diol
4. (5α,6α)-7,8-didehydro-4,5-epoxy-3-methoxy-17-methylmorphinan-6-ol 5. 6,7,8,14-tetradehydro-4,5α-epoxy-6-methoxy-17-methylmorphinan-3-ol 6. 1-(3,4-dimethoxybenzyl)-6,7-dimethoxyisoquinoline
7. (3S)- 6,7-dimethoxy-3-[(5R)-5,6,7,8-tetrahydro-4-methoxy-6-methyl-1,3-dioxolo(4,5-g)isoquinolin-5-yl]-1(3H)-isobenzofuranone ** (p = 2 in alc.) – 2% solution of the substance in alcohol
Additionally, there are many methods for determination of thebaine and other related opiates in biological samples like urine, or other liquids and tissues, as a result of drug or opiate use or abuse, with capillary electrophoresis method [31], gas chromatography-ion trap mass spectrometry (GC–MS) analysis [32], liquid chromatographic-atmospheric pressure chemical ionization mass spectrometric analysis [33] or HPLC analysis [34, 35], GC–MS analysis [36–39]. Alkaloids are also being analyzed in environmental studies to trace the pollution of the environment [40].
Our primary interests were to develop ap-propriate “common” chromatographic methods (HPLC and GC) for analysis and determination of thebaine along with other related alkaloids such as morphine, codeine, oripavine, noscapine, papaveri-ne, and pseudomorphine. Several methods were found in the literature including HPTLC (high-per-formance thin layer chromatography) [41], HPLC analysis [42–46] and GC determination [47–50].
The interest for developing a new method and procedure for thebaine analysis was primary because of absence of monograph in the European Pharmacopoeia and the need of easy, precise and fast methods that could be used for routine analy-sis. Most of the previously-mentioned methods use various techniques that are not so often present in standard pharmaceutical laboratories. On the other hand, HPLC and GC are the most widely used methods for qualitative and quantitative determina-tions. Of these two methods the HPLC methods are the most frequently used for alkaloids (either in free base or salt form). For several key alkaloids, such as morphine hydrochloride, morphine sulfate, codeine phosphate sesquihydrate that are given in the European Pharmacopoeia monographs, HPLC methods are available but they use ion pairing rea-gents and/or phosphate based buffers which are not suitable for HPLC–MS analysis.
On the other hand, hydrophobic counter-ions such as trifluoroacetate and formate in addition to ion-pairing with the positively charged solute also increase the affinity of the solute for the hydropho-bic stationary phase and are also suitable for mass spectrometric detectors, being few of the pH ad-justing reagents preferred [51].
Herein we present a rapid, easy to perform HPLC–UV method for determination of thebaine and characterization of impurities, with satisfactory separation of the other related alkaloids, that is transferable to HPLC–MS systems which could provide additional identification of impurities. Ad-ditionally, complementary GC–MS method was developed for identification of thebaine and
poten-tial impurities. Together with well-defined meth-ods for characterization of thebaine, such as melt-ing point, optical rotation, UV–Vis and IR spec-troscopy, these developed methods will be quite suitable for assessment of the quality of the isolat-ed/prepared thebaine.
2. EXPERIMENTAL
2.1.Instrumentation
The chromatographic analyses were per-formed on a Hitachi VWR Chromaster Liquid Chromatography System equipped with a low pressure quaternary pump 5110 with integrated degaser, an autosampler with cooling option 5210, thermostated column compartment 5310, UV–VIS detector 5420 and EZChrom Elite software. For the dissolution of the stock and sample solutions, an Elma ultrasonic bath was used. The investigations were carried out on an Onyx monolithic C18 100 mm × 4.6 mm × 5 µm, analytical column (Phenomenex) at 20°C. For recording the PDA spectra Shimadzu Nexera UHPLC system was used with binary pumps LC-30AD (× 2), DGU-20A 5R Degassing unit, SIL-30AC Autosampler, column heater CTO-20A, SPDM-20A Photo-Diode Array UV–Vis Detector and CBM-20A Sys-tem controller. Gas chromatographic analyses were performed on Varian 450 GC system, equipped with 8410 autosampler and coupled with model 300 EI/CI MSD (mass detector). VF-5MS column (30 m × 0.25 mm, 0.25 μm film thickness) was employed and helium was used as carrier gas.
For determination of the physicochemical properties of thebaine the following instruments were used: Büchi 545 instrument for melting point determination, Varian Excalibur 3100 FTIR spec-trophotometer equipped with ZnSe ATR accessory for acquisition of FT-IR-ATR spectra, Varian Cary 50 Spectrophotometer for obtaining the UV spec-tra, Metrohm pH-meter connected with Thiamo Software and Schmidt + Haensch polarimeter for the determination of the specific optical rotation of the samples.
2.2.Chemicals and materials
and pseudomorphine standards were purchased from European Pharmacopoeia (the intended use of the standards is for related compound analysis and the exact content was within the limits specified by European Pharmacopoeia). Morphine base, oripavine and papaverine were produced in the manufacturing site of Alkaloid AD Skopje. Thebaine base that was used as control was supplied from LGC Standards, with purity of 99.0% (as provided). The chemical structures of the alkaloids, as free bases, are given in Figure 2. All reagents for HPLC analysis were with HPLC purity and obtained from Merck (Darmstadt, Germany). Purified water with high quality, produced in Alkaloid AD Skopje was used for the analyses. For gas chromatographic analyses methylene chloride from Merck was used as solvent.
2.3. HPLC conditions
The separation and analysis of thebaine were performed with a gradient method using 0.08% trifluoroacetic acid and 0.02% formic acid in de-ionized water (mobile phase A) and 0.08% trifluoroacetic acid and 0.02% formic acid in ace-tonitrile (mobile phase B). The mobile phases and solvents were filtered through 0.45 µm filter. The gradient of the HPLC separating method is given in Table 3.
T a b l e 3
Developed gradient method for separation of thebaine and its impurities
Time (min) A% B% Flow (ml/min)
0.0 100 0 1.5
10.0 80 20 2.0
13.0 80 20 2.0
15.0 100 0 1.5
The usual analysis run time was 15 min. The injection volume was 10 µl. The detection wave-length was set at 285 nm (all UV scans of the ex-amined alkaloids show λmax at 285 nm, except
papaverine and noscapine, (which have λmax at 310
nm). Acetic acid (1% v/v) was chosen as solvent for the samples and standards, having in mind the dissociation constant of thebaine and the infor-mation for the dissolution characteristic of thebaine and other alkaloids available in the literature [29].
2.4. Preparation of solutions for HPLC
All the solutions were prepared in 1% (v/v) acetic acid. First the substance was dissolved in 10% (v/v) acetic acid and then it was diluted to
volume with distilled water to provide the desired concentration of the substance while making final concentration of 1% (v/v) acetic acid. Different concentrations of samples and standards were pre-pared depending on their usage. Considering the molecular weights of the forms of the substances all solutions of the standards were prepared in three concentrations: 0.006 mg/ml, 0.25 mg/ml and 0.3 mg/ml concentration of free base in order to check the linearity of the method and to calculate the response factors. The concentrations of solu-tions are chosen in a way to provide sufficient in-formation for their purpose. Considering the sam-ple preparation of 4 mg/ml (100%), the 0.006 mg/ml is 0.15%, which is around the maximum concentration limit of which the unknown impuri-ties are allowed to be present in the samples when analyzed for pharmaceutical purpose (the limit of unknown impurities is 0.1%). The concentrations of 0.25 mg/ml and 0.3 mg/ml are 6.25% and 7.5% respectively, with reference to the 100% sample and were chosen in a way to provide good PDA (photo diode array) spectra and chromatography. Since the most usual maximal expected impurity concentration in some samples is 10%, these three concentrations at the same time provide enough information to calculate the linearity of the meth-od. For determination of retention times, solutions of 0.3 mg/ml on “as is” substance were prepared dissolving the substance in 2 ml of 10% (v/v) ace-tic acid and then diluting to the mark with distilled water. The samples of three batches of thebaine that were subject of investigation and the control standard of thebaine from LGC (99%) were pre-pared in concentration of 4 mg/ml, providing suffi-cient concentration for the impurity profiles. Thebaine samples for obtaining UV spectra were also prepared in 1% (v/v) acetic acid, but they were diluted to 0.006 mg/ml in order to provide satisfac-tory absorbance within the linear range. The pH of all of these samples was measured.
2.5. HPLC method development
was always used to turn the gradient to the starting point of 100% of mobile phase A. From all of the tested methods the one with the best separation of the impurities was selected (Table 3).
2.6. GC–MS analysis and sample preparation
The GC analysis was performed in addition to the HPLC to provide sufficient identification of any present unknown impurities that need GC–MS analysis for their identification. The column used was VF-5MS column, 5% phenyl-95% dimethylsiloxane from Agilent (30 m, 0.25 mm i.d. and 0.25 µm film thickness). The carrier gas was helium with constant flow of 1.2 ml/min. The in-jection mode with 1:25 split ratio and 1µl inin-jection volume. Injector temperature was 260 ºC, high enough for vaporization of the alkaloids, but not high enough for thermal degradation [52]. The temperature program was set as follows: initial temperature of 160 °C, held for 2 min; ramped to 280 °C at 15 °C/min and held 15 min. The other relevant parameters were: scan time of 1 s, MS source temperature of 250 °C, detector voltage 1000 V, ion source temperature of 250 °C and transfer line temperature of 280 °C. All solutions were prepared in methylene chloride. Considering that the GC–MS analysis were performed just for qualitative purposes the concentrations were c.a. 0.05 mg/ml.
3. RESULTS AND DISCUSSION
3.1. Physicochemical characteristics
Considering that the aim of the study was to define the parameters/characteristics and methods for the determination of purity of thebaine, it was started from the basic analyses of the substance, such as melting point determination, IR spectros-copy, UV spectroscopy and concluding with de-velopment of HPLC and GC methods. As a very simple analysis and initial indicator of purity, we started with determination of the melting point of the three different batches of thebaine
manufac-tured by different routes. The reference value of 193 ºC for melting point of thebaine free base was taken from the literature [5]. It can be seen that based on the melting point measurements the batch B-I is of highest purity (highest mp of 193.4 °C and narrowest temperature range 0.6 °C). On the other hand, the batch of thebaine, B-II, is of lowest purity of the three analyzed samples (lowest mp of 189.9 °C and widest temperature range of 2.5 °C (Table 4). This shows that melting point can be a very good initial indicator of the substance purity. It is also noteworthy that B-II and B-III batches have different color (from grayish to brownish gray color).
According to Merck Index, the specific rota-tion (589 nm, 20 ºC) of thebaine in ethanol is –219º (20 mg/ml). The specific rotation of all three batch-es was also determined, but gave satisfactory rbatch-esult just for the batch B-I of –220.8º (Table 4). For the other two batches the solutions were further diluted to concentration of 1 mg/ml and then measured. The specific rotation is also a good indicator of (optical) purity, taking into consideration that the other impu-rities present are optically active alkaloids with dif-ferent specific rotation than the desired thebaine. The largest deviation from the literature value was observed for the sample B-II (–138.5º), but surpris-ingly it was very close to a value reported in the literature (–134º) by Maturová et al. for thebaine isolated from plant material [53].
The solubility of the thebaine and other alka-loids was investigated through a literature survey [29] and 1% (v/v) acetic acid was determined as the best choice, which was then also experimental-ly proven. Thebaine and the other alkaloids are freely soluble in 1% (v/v) acetic acid. The UV spectrum of thebaine commercial standard in 1% acetic acid was recorded and values of λmax and log
ε were obtained (285 nm and 3.91 respectively). The three batches (B-I, B-II and B-III) were also analyzed by UV spectroscopy under identical con-ditions and the λmax at 285 nm was observed for all
of them. No shifts in λmax were observed by
chang-ing the solvent polarity or pH.
T a b l e 4
Determined physical properties of the three examined batches of thebaine
Batch of thebaine
Color/ appearance
Melting point (°C)
Specific optical rotation (abs. ethanol)
λmax (nm)*
(1% acetic acid)
B-I white powder 192.8–193.4 –220.8 (2 %) 285
B-II grayish powder 187.4–189.9 –138.5 (0.1 %) 285
In order to develop the most appropriate HPLC method, the UV spectra of thebaine and the other alkaloids were obtained utilizing the photo diode array (PDA) detector. The UV spectra of the three thebaine batches were obtained using 1% (v/v) acetic acid in and λmax at 285 nm was
ob-served in all cases (Table 4). Having in mind that UV spectra of all alkaloids and of thebaine in 1% (v/v) acetic acid, the HPLC analysis for their de-termination was carried out at 285 nm. In addition, to confirm the specificity of the method, the UV-PDAD was used to check the purity of the peaks. In the UV-PDA spectra of the other alkaloids (morphine, codeine, pseudomorphine, pholcodine, oripavine) also λmax at 285 nm was observed,
ex-cept for papaverine and noscapine that have λmax at
310 nm in 1% (v/v) acetic acid. These results
con-firmed that the choice of monitoring wavelength (285 nm) for the HPLC method is valid.
The pH of the samples was also important in development of the method and was investigated. The pH of the samples dissolved in 1% (v/v) acetic acid used for the UV spectroscopic studies was measured and ranged from 2.75 for the dilute sam-ples to 3.0 for the more concentrated samsam-ples (0.3 mg/ml). Also, the combination of mobile phases (see Table 3) were prepared as in the gradient of the HPLC analysis. The pH of these solutions was also measured and was between 2 and 3. All of the above-mentioned, went in favor of the selected mobile phases that provided low pH, which en-sured that thebaine and the other alkaloids would be completely protonated and be soluble in the mobile phase (Fig.3).
Fig. 3. Protonation of thebaine in aqueous solutions
Fig. 4. UV (photo diode array, PDA) spectra of thebaine (0.3 mg/ml) obtained in 1% (v/v) acetic acid
Furthermore the obtained IR spectra (ATR method, ZnSe crystal) of the three batches (Fig.7) were identical and matched those given in the liter-ature [6], and matched the spectrum of the com-mercial standard of thebaine. This method is quite suitable for initial qualitative analysis and the FTIR–ATR is also suitable for direct analysis of the solid samples (without prior sample prepara-tion), and to potentially detect different poly-morphs or presence/absence of water. However, by
using this method it is very difficult to detect and/or quantify impurities present in minute amounts.
Wavenumbers
3750 3500 3250 3000 2750 2500 2250 2000 1750 1500 1250 1000 750
T
ra
n
sm
it
ta
n
c
e
70
75
80
85
90
95
100
Fig. 5. FTIR-ATR spectra of the three batches of thebaine bases
(red trace B-I, blue trace B-II and black trace is B-III)
3.2. HPLC method
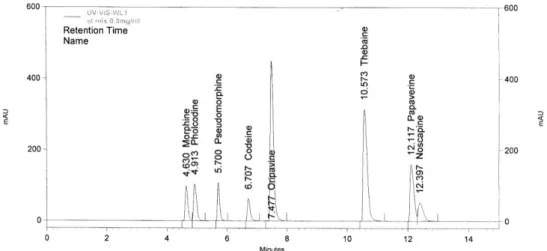
standard of all the alkaloids (Fig. 6) was prepared and analyzed. The lowest resolution between two neighboring peaks was 1.0, between papaverine and noscapine peaks, and 1.6, between morphine and pholcodine, which was sufficient to provide good baseline separation according to the Europe-an Pharmacopoeia.
To prove the specificity of the method the relative retention times of the alkaloids were
de-termined and for the purpose of quantitative analy-sis of thebaine, the response and corrections factors at the monitoring wavelength (285 nm) were de-termined. The relative retention times, correction factors, with respect to the thebaine peak, and the resolution between two neighboring peaks are giv-en in Table 5.
Fig. 6. Chromatogram of mixed standard solution of thebaine and related alkaloids with concentration of 0.3 mg/ml, obtained with the method described in section 2.3.
T a b l e 5
Relative retention times, resolution and correction factors of the analyzed alkaloids determined from mixed standard solution with concentration of 0.3 mg/ml
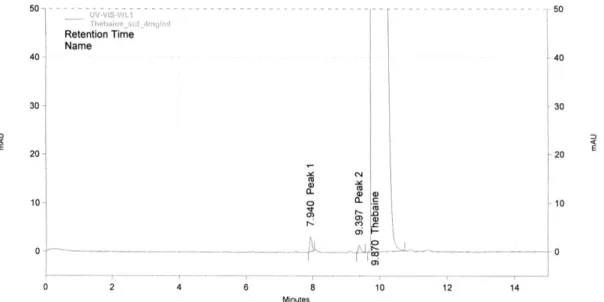
The three batches of thebaine (B-I, B-II and B-III) were analyzed utilizing the developed HPLC method (Fig 7–9) and the results are given in Table 6. From the obtained results it can be concluded that batch B-I is of highest purity (99.90 %), whereas batch B-II is of lowest purity (97.25%). The impurities were identified based on their rela-tive retention times assigned before and their UV spectra. In sample B-II seven impurities were de-tected of which three were identified as codeine, oripavine and papaverine. It is not unreasonable to
propose that this batch was obtained via extraction from natural sources. It is interesting to note that there is correlation between the purity of the three thebaine batches obtained by HPLC and the melt-ing point ranges previously determined. The ad-vantage of this method is that it can be used for routine analysis (HPLC–UV), but also considering the mobile phase compatibility, it can be adapted/transferred easily for HPLC–MS analysis, especially if the identity of the impurities needs to be determined.
Name of component Relative retention time Resolution Correction factors
Morphine ~ 0.46 / 3.3
Pholcodine ~ 0.47 1.6 3.3
Pseudomorphine ~ 0.56 4.8 2.7
Codeine ~ 0.65 6.4 4.1
Oripavine ~ 0.72 3.9 0.8
Thebaine 1 13.2 /
Papaverine ~ 1.15 6.2 1.4
Fig. 7. Chromatogram of thebaine sample B-I (concentration of 4 mg/ml in 1% (v/v) acetic acid)
Fig. 8. Chromatogram of thebaine sample B-II (concentration of 4 mg/ml in 1% (v/v) acetic acid).
T a b l e 6
HPLC properties of the three analyzed batches of thebaine. Area % is calculated by normalization method
Num. Name of component Retention time (min)
B – I Area %
B – II Area %
B – III Area %
1 Thebaine ~ 10 (9.8 – 10.5) 99.90 97.25 99.83
2 Morphine ~ 5 (4.6 – 5.2) / / /
3 Pseudomorphine ~ 6 (5.7 – 6.1) / / /
4 Codeine ~ 7 (6.7 – 7) / 0.11 /
5 Oripavine ~ 7.5 (7.4 – 7.7) / 0.29 /
U1 Unknown 1 ~ 8 (7.9 – 8.1) 0.06 0.38 /
U2 Unknown 2 ~ 9.4 (9.4 – 9.45) 0.04 0.21 0.12
U3 Unknown 3 ~ 10.6 (10.6 – 10.63) / 0.95 0.05
U4 Unknown 4 ~ 10.85 / 0.21 /
6 Papverine ~ 12 (11.85 – 12.1) / 0.60 /
7 Noscapine ~ 12.3 (12.28 – 12.4) / / /
3.3. GC–MS method
In order to confirm the identity of the impu-rities, the first choice for the identification would be to transfer the developed HPLC-DAD method analysis to HPLC–MS method. The GC–MS method was considered as an alternative after the HPLC analysis, if additional identification is need-ed. The GC–MS method was first checked for specificity for the above-mentioned alkaloids and was found to be suitable. Several related alkaloids, namely, pholcodine, codeine, morphine, thebaine, oripavine, papaverine and noscapine were analyzed by GC–MS and the chromatograms and the mass spectra were of excellent quality. The chromato-gram and the mass spectrum of the analyzed thebaine sample are shown in Figure 10. Moreo-ver, by using the developed GC–MS method, all of the potential impurities in thebaine can be separat-ed. The retention times, relative retention times and the key mass spectral data are given in Table 7.
We have found that the key parameters were the initial temperature (160 °C) and the final tem-perature (280 °C). Also the transfer line was set at 280 °C to ensure that there are no left over compo-nents that would interfere with the subsequent analysis. From our preliminary studies, we have concluded that pseudomorphine (3) could not be analyzed by our GC–MS method, even after TMS derivatization. This is due to its high molecular mass and low volatility of 3. Also, this method is only suitable for free amines (bases); their salts have to be properly treated and converted to the neutral (free base) form in order to be analyzed by GC–MS. The advantages of the GC–MS method over the HPLC methods are that the retention times are highly reproducible and the existence of exten-sive searchable EI mass spectral libraries, which makes the identification of thebaine and impurities straightforward.
(Text File) 10.752 min, Sc a n: 387
40 80 120 160 200 240 280 320
0 50 100
51 58
70
89 115
152
182 211 239
254 280
296 311
Fig. 10. Gas chromatogram (top) and experimentally obtained EI mass spectra (bottom) for thebaine, run with the developed
GC–MS method
T a b l e 7
Retention times, relative retention times, and mass spectral data from the analyzed thebaine and related alkaloids using the developed GC–MS method
Num. Name of component Retention time (min)
Rel. ret time
Mass spectral data (m/z, rel. abundance %) 1 Thebaine 10.752 1 M+ (311, 100); M+ +1 (312, 20); M+ -15(296, 77)
2 Morphine 10.317 0.96 M+ (285, 100); M+ +1 (286, 20); (215, 21);(162, 25) 3 Pseudomorphine n.d. / M+ (568, 57); M+ +1 (569, 21); (215, 21);(162, 21)
4 Codeine 9.981 0.93 M+ (299, 100); M+ +1 (300, 20); (229, 28);(162, 51) 5 Oripavine 10.490 0.975 M+ (297, 100); M+ +1 (298, 20); M+ -1(296, 19)
6 Papverine 13.423 1.25 M+ (339, 76); M+ +1 (340, 15); M+ -1(338, 100); (308, 25) 7 Noscapine 18.823 1.75 M+ (412, 0.5); (220, 100); (221, 15)
8 Pholcodine 19.376 1.80 M+ (398, 5.6); (114, 100); (100, 83)
4. CONCLUSIONS
The initial studies were utilized for the de-velopment of the key HPLC-PDAD method which was shown to be specific and efficient to provide identification of thebaine and the other opium alka-loids, along with their quantification. Complemen-tary GC–MS method was developed, primarily for qualitative analysis. Using the developed HPLC method three batches of thebaine were analyzed and their purity determined. Melting point deter-mination and specific rotation are quite appropriate for preliminary purity assessment, along with IR and UV spectroscopy for preliminary identifica-tion. The additional analysis for identification of the present unknown impurities may be accom-plished by transferring the herein presented HPLC–UV method to a HPLC–MS method.
REFERENCES
[1] T. Aniszewski, Alkaloids–Secrets of Life: Aklaloid Chemistry, Biological Significance, Applications
and Ecological Role, Elsevier, 2007.
[2] L. L. C. Books, L. L. C. General Books, Natural Opium Alkaloids: Morphine, Thebaine, Codeine, Poppy Straw, Papaverine, Opiate, Oripavine,
Scoulerine, Reticuline, Protopine, General Books.
[3] M. Hesse, Alkaloids: Nature's Curse or Blessing?, Wiley-VCH, 2002.
[4] M. F. Roberts, M. Wink, Alkaloids: Biochemistry,
Ecology, and Medicinal Applications, Springer,
1998.
[5] M. J. O'Neil (ed.), The Merck Index: An encyclo-pedia of chemicals, drugs, and biologicals. 14th ed., Whitehouse Station, NJ 2006.
[6] A. C. Moffat, M. D. Osselton, B. Widdop,: Clarke’s
Analysis of Drugs and Poisons, 3rd ed.
Pharmaceu-tical Press: London, 2004.
[7] V. Gambaro, P. Minghetti, S. Arnoldi, M. Colom-bo, L. Dellacqua, A. Casiraghi, K. Guerrini, F. Fare, G. Roda, Analysis of fluid extracts obtained from Papaver rhoeas petals contaminated with
Papaver bracteatum petals, Planta Med., 78(12),
1395–1398 (2012).
[8] M. Omidi, F. Koohzadi, M. Solouki, R. Taghizad Farid, H. Alizadeh, Comparison of morphinan al-kaloids during different stages of growth in the medicinal plant opium poppy (Papaver
somniferum L.), J. Med Plants, 11(44), 140–148
(2012).
[9] Y. Shoyama, F. Kawachi, H. Tanaka, R. Nakai, T. Shibata, K. Nishi, Genetic and alkaloid analysis of Papaver species and their F1 hybrid by RAPD, HPLC and ELISA, Forensic Sci. Int., 91(3), 207– 217 (1998).
[10] I. Stranská, M. Skalický, J. Novák, E. Matyášova, V. Hejnak, Analysis of selected poppy (Papaver
somniferum L.) cultivars: Pharmaceutically
im-portant alkaloids, Industrial Crops and Products,
41(0), 120–126 (2012).
[11] Z. Szucs, B. Szabady, M. Szatrndry, G. Cirnpan, S. Nyiredy, High-throughput analytical strategy with combined planar and column liquid chromatog-raphy for improvement of the poppy (Papaver
somniferum L.) with a high alkaloid content,
Chromatographia, 56, 49–54 (2002).
[12] K. Yoshimatsu, F. Kiuchi, K. Shimomura, Y. Makino, A rapid and reliable solid-phase extrac-tion method for high-performance liquid chroma-tographic analysis of opium alkaloids from Papaver plants, Chem. Pharm. Bull., 53(11), 1446– 1450 (2005).
[13] D. Lavie, J. Rotman, A. Levy, D. Palevitch, A rap-id quantitative method for the determination of thebaine in Papaver bracteatum, Phytochemistry,
18(12), 2011–2013 (1979).
process streams using monolithic column high-performance liquid chromatography with chemiluminescence detection, Anal. Chim. Acta,
597(1), 19–23 (2007).
[15] P. S. Francis, J. L. Adcock, J. W. Costin, S. D. Purcell, F. M. Pfeffer, N. W. Barnett, Chemiluminescence detection of opium poppy
(Papaver somniferum) alkaloids, J. Pharm.
Bio-med. Anal., 48(3), 508–518 (2008).
[16] A. A. Ensafi, F. Hasanpour, T. Khayamian, A. Mokhtari, M. Taei, Simultaneous chemiluminescence determination of thebaine and noscapine using support vector machine regres-sion, Spectrochim. Acta, Part A, 75(2), 867–871 (2010).
[17] N. W. Barnett, B. J. Hindson, S. W. Lewis, S. D. Purcell, Determination of codeine, 6-methoxy-codeine and thebaine using capillary electrophore-sis with tris(2,2'-bipyridyl)ruthenium(II) chemiluminescence detection, Anal. Commun.,
35(10), 321–324 (1998).
[18] B. J. Hindson, P. S. Francis, S. D. Purcell, N. W. Barnett, Determination of opiate alkaloids in pro-cess liquors using capillary electrophoresis, J.
Pharm. Biomed. Anal., 43(3), 1164–1168 (2007).
[19] M. Baranska, H. Schulz, A. C. Geoffrey, Chapter 4: Determination of Alkaloids through Infrared and Raman Spectroscopy, In: The Alkaloids:
Chemis-try and Biology. Academic Press, pp 217–255
2009.
[20] A. Agnihotri, S. C. Tewari, P. Khatod, S. Banerjee, M. Balasubramanian, Determination of thebaine in crude thebaine samples by infrared and ultraviolet spectrophotometric methods, Analyst, 109, 1413– 1416 (1984).
[21] G. W. Caldwell, A. D. Gauthier, J. E. Mills, Configurational analysis of thebaine, codeine and 14beta-hydroxycodeinone N-oxides, Magn. Reson.
Chem., 34(7), 505–511 (1996).
[22] O. F. Ellingsen, K. E. Malterud, J. K. Wold, Stud-ies on thebaine, III Oxidative colorimetric analysis of thebaine, Arch. Pharm., 318(4), 380–382 (1985).
[23] S. M. Han, N. Purdie, Simultaneous determination of opiates by circular dichroism, Anal. Chem.,
58(1), 113–116 (1986).
[24] K. Ikonomovski, Colorimetric determination of thebaine in Papaver bracteatum, J. Pharm. Sci.,
70(1), 102–103 (1981).
[25] D. K. Kuila, S. C. Lahiri, Search for suitable mo-bile phase in TLC analysis of different drugs of fo-rensic interest and their gas liquid chromatographic experiment, J. Indian Chem. Soc., 84(1), 69–73 (2007).
[26] J. Pothier, N. Galand, Automated multiple devel-opment thin-layer chromatography for separation of opiate alkaloids and derivatives, J.
Chromatogr., 1080(2), 186–191 (2005).
[27] Y. Shoyama, T. Fukada, H. Murakami, Production of monoclonal antibodies and ELISA for thebaine and codeine, Cytotechnology, 19(1), 55–61 (1995).
[28] N. W. Turner, M. Cauchi, E. V. Piletska, C. Pres-ton, S. A. Piletsky, Rapid qualitative and quantita-tive analysis of opiates in extract of poppy head via FTIR and chemometrics: Towards in-field sen-sors, Biosensors Bioelectron., 24 (11), 3322–3328 (2009).
[29] G. E. Baiulescu, S. D. Popescu, Determination of codeine, dionin and thebaine by differential pulse polarography, Anal. Lett., 19(5–6), 587–596 (1986).
[30] B. Rezaei, S. Damiri, Development of a voltammetric procedure for assay of thebaine at a multi-walled carbon nanotubes electrode: Quanti-fication and electrochemical studies, J. Solid State
Electrochem., 14(6), 1079–1088 (2010).
[31] A. Alnajjar, A. M. Idris, M. Multzenberg, B. McCord, Development of a capillary electrophore-sis method for the screening of human urine for multiple drugs of abuse, J. Chromatogr. B, 856(1– 2), 62–67 (2007).
[32] G. Cassella, A. H. B. Wu, B. R. Shaw, D. W. Hill, The analysis of thebaine in urine for the detection of poppy seed consumption, J. Anal. Toxicol.,
21(5), 376–383 (1997).
[33] R. Kikura-Hanajiri, N. Kaniwa, M. Ishibashi, Y. Makino, S. Kojima, Liquid chromatographic-atmospheric pressure chemical ionization mass spectrometric analysis of opiates and metabolites in rat urine after inhalation of opium, J.
Chromatogr. B, 789(1), 139–150 (2003).
[34] M. Shamsipur Mojtaba, N. Fattahi, Extraction and determination of opium alkaloids in urine samples using dispersive liquid-liquid microextraction fol-lowed by high-performance liquid chromatog-raphy, J. Chromatogr. B, 879(28), 2978–2983 (2011).
[35] Y. R. Zhang, C. Liang, Q. Y. Jin, Analysis of 39 drugs in urine by HPLC after solid-phase extrac-tion, Chin J Forensic Med, 20(1), 14–16 (2005).
[36] B. M. El-Haj, A. M. Al-Amri, H. S. Ali, I. Ahmed, GC–MS detection and characterization of thebaine as a urinary marker of opium use, Forensic
Toxi-cology, 25(2), 62–68 (2007).
[37] B. M. El-Haj, H. S. Ali, N. M. Hamoudi, Oripavine as a new marker of opiate product use,
Forensic Toxicology, 29(2), 152–158 (2011).
abused opiates in postmortem fluids and tissues us-ing Zymark® automated solid-phase extraction and gas chromatography-mass spectrometry, J.
Chromatogr. B, 822(1–2), 137–145 (2005).
[39] C. Meadway, S. George, R. Braithwaite, Opiate concentrations following the ingestion of poppy seed products – Evidence for 'the poppy seed defence', Forensic Sci. Int., 96(1), 29–38 (1998).
[40] C. B. Bural, G. N. Demirer, O. Kantoglu, F. B. Dilek, Treatment of opium alkaloid containing wastewater in sequencing batch reactor (SBR)-Effect of gamma irradiation, RaPC, 79(4), 519– 526 (2010).
[41] K. Scheidl, F. Wurst, T. Prey, E. Bancher, Quanti-tative determination of thebaine in Papaver
bracteatum. I. Chromatographic separation and in
situ evaluation of HPTLC-plates, Fresen Z Anal Chem, 308(5), 428–430 (1981).
[42] G. Sariyar, A. Mat, H. F. Senol, The quantitative determination of thebaine and narcotine by HPLC in some Turkish Papaver species, Acta
Pharmaceutica Turcica, 39(2), 73–75 (1997).
[43] S. Seidi, Y. Yamini, A. Heydari, M. Moradi, A. Esrafili, M. Rezazadeh, Determination of thebaine in water samples, biological fluids, poppy capsule, and narcotic drugs, using electromembrane extrac-tion followed by high-performance liquid chroma-tography analysis, Anal. Chim. Acta, 701(2), 181– 188 (2011).
[44] M. P. Gomez-Serranillos, E. Carretero, A. Villar, A new HPLC method for the analysis of alkaloids in poppy straw, Fitoterapia, 66(2), 156–158 (1995).
[45] P. Gomez-Serranillos, E. Carretero, A. Villar, A study of phenanthrenic poppy straw alkaloids by
reversed-phase HPLC, Acta Technologiae et Legis
Medicamenti, 6(3), 337–342 (1995).
[46] L. Krenn, S. Glantschnig, U. Sorgner, Determina-tion of the live major opium alkaloids by reversed-phase high-performance liquid chromatography on a base-deactivated stationary phase,
Chromatographia, 47(1–2), 21-24 (1998).
[47] M. Chiarotti, N. Fucci, M. I. Arufe Martinez, Analysis of illicit heroin origin impurities, derived from thebaine, by gas chromatography, Revista de
Toxicologia, 6(3), 369–376 (1989).
[48] L. Iliev, L. Toteva, Determination of morphine, codeine and thebaine in some poppy varieties by gas chromatography, Farmatsiya, 31(4), 13–22 (1981).
[49] O. F. Ellingsen, J. K. Wold, B. S. Paulsen, Quanti-tative determination of thebaine in Papaver
bracteatum Lindl. by an improved gas
chromato-graphic procedure, Norvegica Pharm Acta, 45(3), 93–101 (1983).
[50] B. D. Paul, C. Dreka, E. S. Knight, M. L. Smith, Gas chromatographic/mass spectrometric detection of narcotine, papaverine, and thebaine in seeds of
Papaver somniferum, Planta Med., 62(6), 544–547
(1996).
[51] T. Cecchi, Ion-Pair Chromatograpy and Related
Techniques, CRC Press, Boca Raton, FL, 2009.
[52] R. Grob, E. Barry, Modern Practice of Gas
Chro-matography, 4th ed., Wiley-Interscience, 2004.