285 Journal of Business on Hospitality and Tourism
Submitted 30th Oktober 2019 Accepted 26th November 2019
THE EFFECTS OF SERVICE QUALITY, CUSTOMER
PERCEIVED VALUE, AND CUSTOMER
SATISFACTION TOWARDS CUSTOMER LOYALTY
OF DAMRI TOUR BUS
Suci Sandi Wachyuni
Hotel Department of Sahid Polytechnic [email protected]
ABSTRACT
Based on the data from Transportation Department of Indonesia, commonly total of tourist bus company and total unit of tour bus continues to increase every year. The increasing number of competitors will affect customers looking away easily from one service provider to another. Then, DAMRI as one of the providers, has to make efforts for maintaining and increasing customer’s loyalty. The purpose of this study to determine the effect of service quality, customer perceived value, and customer satisfaction towards customer loyalty of DAMRI Tourist Bus.
This research is a quantitative research. Sampling technique is non Probability Sampling, purposive sampling. Data collection is done through interview and questionnaires. Statistical analysis techniques is done through regression analysis and hypothesis testing t test and F test (SPSS 20.0). The results being obtained: service quality (X1) and customer perceived value (X2) significantly influence customer loyalty (Y). In other hand, customer satisfaction (X3) does not significantly influence customer loyalty (Y); But X1, X2, and X3 simultanously influence Y. The manager is advised to continously make efforts in order to improve customer loyalty. Further research is needed to identify the factors that have more influence over customer loyalty of DAMRI Tourist Bus.
Keywords: Tourist Bus, Service Quality, Perceived Value, Customer Loyalty, Transportation
INTRODUCTION
286 Journal of Business on Hospitality and Tourism
tourism bus companies by province increased by 17.25% and the number of tourism bus units increased by 9.32%. In particular in the area of DKI Jakarta also increased. This increase illustrates the increasing competition among tourism bus providers. Based on statistical data from the Directorate General of Land Transportation (2012), in Jakarta the number of tourism bus companies increased from 63 in 2005 to 114 in 2012. The requirement that a company needed in order to be successful in competition is trying to achieve the goal of creating and retain customers (Tjiptono, 1997: 19). The significance of customer loyalty is closely related to the company's survival and to the company growth in the future. Therefore, maintaining existing customers is more important than aggressive strategies such as expanding market size by attracting potential customers (Lupiyoadi, 2006: 195).
To get customer loyalty, a company must comply with customer expectations. Customer loyalty can also be formed from the satisfaction felt by customers. In addition, the costumer perceived value will also affect the customer's loyalty to the product or service that he used. The customer perceived value is the difference between the evaluation of the prospective customer of all the benefits and all the costs of certain offers and other alternatives that are thought of (Kotler, 2005: 68). If the value offered by a company is relatively higher than competitors, it will affect the level of customer loyalty. According to (Gale, 1994 in Paliati, 2007: 74), the higher the perceived value perceived by the customer, the greater the possibility of a relationship or transaction.
DAMRI is an abbreviation of Djawatan Angkoetan Motor Repoeblik Indonesia (EYD: Jawatan Angkutan Motor Republik Indonesia) which was formed based on the Decree of the Ministry of Transportation No.01 / DAMRI / 46 dated 25 November 1946, with the main responsibility of organizing passenger and goods transportation on the road using motor vehicle. In subsequent developments as a Public Corporation (Perum), the name DAMRI remains enshrined as a brandmark of this State-Owned Enterprise (Called BUMN), which until now has consistently carried out its duties as one of the providers of passenger and goods transportation services using buses and trucks until now, DAMRI has a service network spread throughout the territory of the Republic of Indonesia (www.damri.co.id, 2013
Based on a survey in October 2013 conducted by Bus Mania Community, a community of bus enthusiasts throughout Indonesia, the DAMRI Tourism Bus did not included among the top 40 best tourism buses in Indonesia (www.bismania.com, 2013). For this reason, the management of Public Corporation DAMRI needs to make efforts in order to maintain and increase the loyalty of its customers, by providing high quality services, paying attention to the value of its customers, and building satisfaction with its customers. Based on the description above, the author is interested in conducting research on the effect of service quality, customer value, and customer satisfaction, on customer loyalty at Perum DAMRI
METHODOLOGY
287 Journal of Business on Hospitality and Tourism
and customer satisfaction (X3); on customer loyalty (Y) at Perum DAMRI. The sampling technique in this study is Nonprobability Sampling. Sampling was taken using a purposive sampling method. The unit of analysis in this study is the customers as decision maker for using DAMRI Tourism Bus. They are consisting of 100 people. According to Roscoe in Sekaran (2006), sample sizes of more than 30 and less than 500 are appropriate for most studies. Respondents fill out a questionnaire that includes statements about indicators of service quality, customer value, customer satisfaction, and customer loyalty. The measurement scale used is a Likert scale. The analytical method used is multiple linear regression analysis using the SPSS V. 20.0 program. The data analysis sequence starts from the validity test, the reliability test, the classic assumption test, the correlation test, the coefficient of determination test, multiple linear regression analysis, t test and F test.
RESULTS AND DISCUSSION A. Results
1. Profile of DAMRI
DAMRI is one of the oldest state-owned transportation companies established in 1946. DAMRI stands for "Djawatan Angkoetan Motor Repoeblik Indonesia". At present, DAMRI has seven types of transportation services that operate to explore various cities and lands, spread in 74 cities and regions throughout Indonesia. The products they have are in the form of city bus transportation, intercity transportation, tourism transportation, airport transportation, interstate freight transportation, and pioneer transportation. Based on interviews with DAMRI business managers, DAMRI received many requests for tourism transportation, but there were several obstacles including fleet limitations, old vehicle age, and ability to serve in a hospitality way.
2. Profile of Survey Respondents
288 Journal of Business on Hospitality and Tourism
Table 1. Profile of the Survey Respondents
Demography Option Percentage (%)
Gender Male 52
Female 48
Age 17-20 9
21-30 28
31-40 30
>40 33
Education Elementary 7
Junior Secondary 5
High School 36
Associate's Degree 10
Bachelor 42
Occupation Government Employee 16
Private Employee 36
Enterpreneur 18
Indonesian Army/Police 14
Student 14
Others 2
Salary <Rp 1 million 23
Rp 1 - 2,5 million 18 Rp 2,5-3,5 million 22 >Rp 3,5 million 37
Frequency Usage 2-5 times 70
5-10 times 17
>10 times 13
Purpose of Usage Company trip 31
Recreation 45
Family Trip 11
Bussiness Trip 2
School trip 8
Others 3
3. Validity Test
289 Journal of Business on Hospitality and Tourism
4. Reliability Test
Reliability test is conducted to determine whether the measurement questionnaire is reliable or not. Reliability testing of the questionnaire was carried out on 30 respondents. In this study, the reliability was carried out by looking at Cronbach's Alpha coefficient for the reliability of all items on 1 variable using the SPSS application. The reliability results of each variable can be seen in Table 2.
Table 2. Reliability result of each variables
Data can be classified as reliable is Cronbach Alpha value ≥ 0,6 (Santosa, 2005), as can be seen from Table 2, the Cronbach Alpha value from social media and motivation of visit variable has a value of > 0,6, hence then the questionnaire is declared reliable.
5. Classic Assumption Test
a. Normality Test
The normality test aims to determine the distribution of data in the variables that will be used in the study. Data that is good and feasible to use in research is data that has a normal distribution. In testing the data using histograms or normal probability plots, from Image 1, we can see the points that spread around the line and follow the diagonal line so that the residual value is declared homogeneous.
Image 1. Normal P-P Plot of Regression Standardized Residual
b. Heterokedasticity Test
The heteroscedasticity test examines the residual variance of a period of observation to another observation period or a description of the relationship between studentized deleted residuals of that value. A good regression model is a model that has no heteroscedasticity.
Variable Alpha Cronbach Reliability
Service Quality 0.928 High Reliability
Customer Perceived Value 0.856 High Reliability Customer Satisfaction 0.912 High Reliability
290 Journal of Business on Hospitality and Tourism
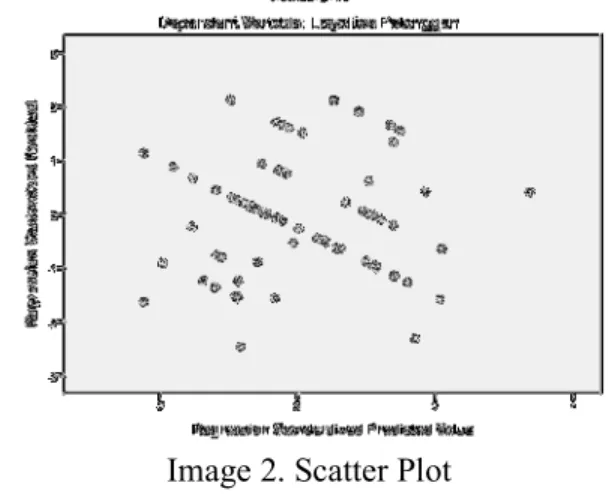
Detecting the presence or absence of heteroscedasticity can be done by looking at the presence or absence of a particular pattern in the graph because the spread of data points does not form a narrowing pattern, is not patterned and spreads around the number 0 [Priyatno, 2012]. Based on Image 2, heteroscedasticity was not detected in this study.
Image 2. Scatter Plot
c. Autocorrelation Test
The autocorrelation test aims to test whether in the linear regression model there is a correlation between disturbance errors in period t with interfering errors in period t-1 (before). A good regression model is that there are no autocorrelation problems [Priyatno, 2012]. The Table showed that DW 1,504. Hasil D-W -2<1,504,+2 means that there is no autocorrelation. The result can be seen in Table 3.
Table 3. Autocorrelation Test of Durbin-Watson
Mode l
R R Square Adjusted R Square
Std. Error of the Estimate
Durbin-Watson
1 ,519a ,269 ,246 3,376 1,504
6. Correlation Test
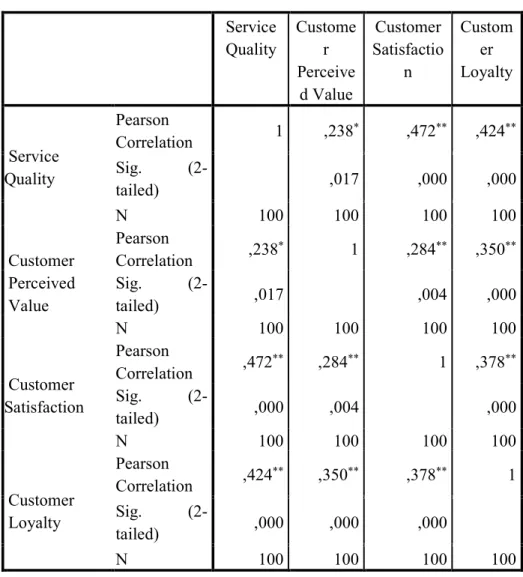
The test performed is the Pearson Correlation. The correlation coefficient between X1 and Y is equal to 0.424 which is stated medium, for X2 and Y is equal to 0.350 which is state low, and the coefficient is 0.378 which is stated low for correlation between X3 and Y (Sugiyono, 2014). But the correlation between X1, X2, X3 simultaneously to Y is 0,519 which is stated medium. This value can be seen from Tabel 4.
7. Determination Test
291 Journal of Business on Hospitality and Tourism
12,3%, and X3 to Y is 14,3%. The rest is explained by other variables outside the tested variable.
Table 4. Correlation test
8. Multiple Regression Analysis
To find out the effect of service quality (X1), perceived value (X2), and customer satisfaction (X3) on customer loyalty (Y) used multiple linear regression. Based on Table 6, the results of the linear regression test obtained equation Y= 7,444 + 0,184X1 + 0,293X2 + 0,205X3. Which is every value of X variable increase will increase Y variable as much as 0,184 times for X1, 0,293 times for X2, and 0,205 times for X3 at the 7,444 constanta value. The results of the linear regression test and t-test can be seen in Table 6.
Service Quality
Custome r Perceive
d Value
Customer Satisfactio
n
Custom er Loyalty
Service Quality
Pearson
Correlation 1 ,238
* ,472** ,424**
Sig.
(2-tailed) ,017 ,000 ,000
N 100 100 100 100
Customer Perceived Value
Pearson
Correlation ,238
* 1 ,284** ,350**
Sig.
(2-tailed) ,017 ,004 ,000
N 100 100 100 100
Customer Satisfaction
Pearson
Correlation ,472
** ,284** 1 ,378**
Sig.
(2-tailed) ,000 ,004 ,000
N 100 100 100 100
Customer Loyalty
Pearson
Correlation ,424
** ,350** ,378** 1
Sig.
(2-tailed) ,000 ,000 ,000
N 100 100 100 100
292 Journal of Business on Hospitality and Tourism
Table 6. The Linear Regression and t-test Result
Model Unstandardized
Coefficients
Standardized Coefficients
t Sig.
B Std. Error Beta
1
(Constant) 7,444 5,090 1,463 ,147
Service Quality ,184 ,065 ,284 2,850 ,005 Pceived Value ,293 ,116 ,231 2,524 ,013 Customer
Satisfaction ,205 ,116 ,178 1,766 ,081
9. t-test
Whereas seen from the t-test, the significance value of X1 to Y is 0,005<0,05 then there is significantly influence of service quality variables on the customer loyalty. While the significance value of X2 to Y is 0,013 and X3 to Y is 0,081 which is stated there is no influence of perceived value and customer satisfaction partially way on customer loyalty (Y) The results of the linear regression test and t-test can be seen in Table 6.
10. F-test
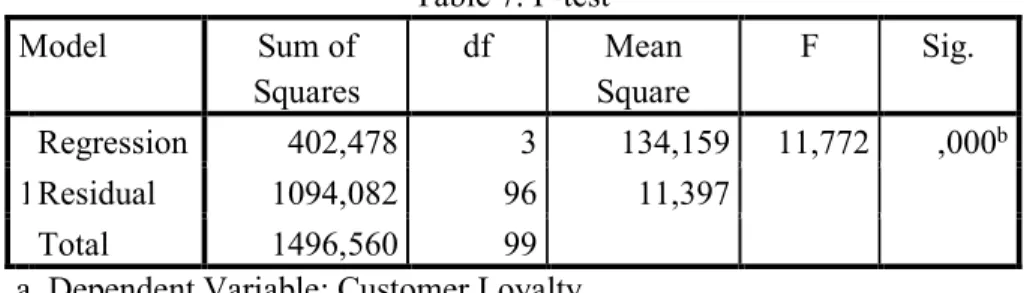
F-test has been done to know the influence of X1, X2, and X3 on Y in simultaneous way. The result based on Table 7 stated that the significance values is 0,000 < 0,05 which means there is significance influence. So that each independent variable can be significance influence if the role in the simultaneous way.
Table 7. F-test
Model Sum of
Squares
df Mean
Square
F Sig.
1
Regression 402,478 3 134,159 11,772 ,000b
Residual 1094,082 96 11,397
Total 1496,560 99
a. Dependent Variable: Customer Loyalty
b. Predictors: (Constant), Customer Satisfaction, Perceived Value, Service Quality
B. Discussions
1. The Influence of Service Quality in Customer Loyalty
The results showed that service quality (X1) individually have a significant influence on customer loyalty (Y) DAMRI Tourism Bus. It is evidenced from the results of t count (2,850)> t table (1,985), and -t count (-2,850) <- t table ( -1,985) with Sig.0.00 <0.05. This is conformable with the theory that service quality is the best guarantee of customer loyalty, the strongest defense facing the competition, and the only way toward sustainable growth and income (Laksana, 2008: 88).
293 Journal of Business on Hospitality and Tourism
recommend to others. There is some research on the relationship between service quality and customer loyalty. According to Laksana (2008: 101-102), research conducted by Bloemer (1999) shows a significant and positive influence between service quality and customer loyalty. Customer loyalty will be created if the company can provide services in accordance with customer expectations which in turn quality of service will create customer loyalty to the company. Customer care increased about service and how they are treated when they buy something, not just price. Maintaining customer relationships is the basis of many new strategies that are developing regarding customer marketing. Good service is a service that is able to turn ‘a first time buyer’ into a ‘customer’.
2. The Influence of Customer Perceived Value on Customer Loyalty
The result showed that customer value (X2) individually has a significant influence on customer loyalty (Y) DAMRI Tourism Bus. It is evidenced from the results of t count (2.524)> t table (1.985), and -t count (-2.524) <- t table ( -1,985) with Sig.0.00 <0.05. This is conformable with the theory that the key to generating customer loyalty is to provide high customer value (Kotler, 2005: 71). According to Gale (1994) in Paliati (2007: 74) the value offered which is relatively higher than competitors will affect the level of consumer loyalty, the higher the perceived value perceived by the customer, the greater the possibility of a relationship or transaction. Research conducted by Paliati (2007) shows that there is a significant positive direct relationship between value and loyalty. One of the fifteen actions that encourage first-time customers to return is to always strengthen the company's value in the eyes of customers (Griffin, 2003). Loyal customers are expensive commodities. Companies that fail to show a strong appreciation for their customers are companies with a short future. The increasingly fierce competition in the future, will be a big threat to the company. Analysts who study business profiles to find out who will survive a period of intense competition have discovered a number of realities; Most companies reach the benefit from their long-term customers. The average money invested by company are six times higher to get new customers than to retain customers. But it is estimated that customer loyalty is worth ten times the value of one purchase. Customer retention results in profits, because long-term customer management costs are lower. So, to transform repeat customers into loyal customers, the company must provide value according to the customer's definition by continuously improving, improving, or changing basic products or services to increase profits for customers.
3. The Influence of Customer Satisfaction on Customer Loyalty
294 Journal of Business on Hospitality and Tourism
satisfaction, surviving customers also increase. However, from the research results obtained, individual customer satisfaction has no significant effect on customer loyalty. However, simultaneously customer satisfaction variables (X3) with service quality variables (X1) and customer value (X2) have a significant effect on customer loyalty (Y). Customer satisfaction partially way doesn’t enough to build or form a loyal customer base. A high level of satisfaction doesn’t claim repeat purchases and increased sales. According to Stum (1991) in Griffin (2003), Forum Corporation reports that around 40% of customers in their study who expressed satisfaction turned out to move into another suppliers without hesitation
According to Reicheld (1993) in Griffin (2003), Harvard Business Review reports that between 65% - 85% of customers who choose a new supplier say they are satisfied or very satisfied with the old supplier. Peter ZanDan, from the Intelliquest company that conducts market research for computer manufacturers around the world, reports that in more than 30,000 interviews, his company has never found an indication that states a high level of customer satisfaction as a trustworthy repurchaser predictor. Research conducted by the Juran Institute reveals that more than 90% of top managers from more than 200 of the largest companies in America agree that efforts to maximize customer satisfaction will also maximize profitability and market share. However, of the more than 200 respondents, only less than 2% received an increase in net income from an increase in customer satisfaction that has been confirmed (Griffin, 2003). Most managers assume that there is a positive correlation between customer satisfaction scores and customer buying behavior. But as described by the findings mentioned, the correlation can’t be relied. A high level of satisfaction doesn’t mean generate high sales and profits. Customers who are reported to be satisfied turn to competitors when they realize the value offered by competitors is greater. According to Peterson and Wilson (1992) in Griffin (2003), the lack of correlation between customer satisfaction and repurchase is partly due to the difficulty of measuring customer satisfaction accurately and reliably.
A number of factors that can affect the level of satisfaction are reported as follows:
a. Compilation of questions. Questions posed in a positive sense ("How satisfied are you?" Versus "How dissatisfied are you?") Get a better response. The majority of questions in research about satisfaction are raised in positive meanings
b. Determination of measurement time. Measurements made immediately after purchase tend to generate a better response than measurements made some time afterwards.
c. Mood of the respondent. The overall mood of the respondent at the time of the study can affect the response.
295 Journal of Business on Hospitality and Tourism
doubtful, one thing is certain that the existing satisfaction measurement system can’t be used as a reliable predictor of customer loyalty (Griffin, 2003).
4. The Influence of Service Quality, Customer Perceived Value, Customer Satisfaction Simultaneously on Customer Loyalty
Based onthe results, service quality (X1), customer value (X2), and customer satisfaction (X3) simultaneously have a significant effect on customer loyalty (Y) DAMRI Tourism Bus. Proven by F arithmetic (11,772)> F table (2,699) with Sig.0.00 <0.05. This is fit in with the hypothesis which states that if the service quality variables (X1), customer value (X2), and customer satisfaction (X3) combined together suspected that customer loyalty (Y) will also get better. Although, customer satisfaction (X3) doesn’t significantly influence individually on customer loyalty (Y), but simultaneously the three independent variables in this study have a significant effect on customer loyalty (Y). It means that if an increase in service quality, balanced with an increase in value and customer satisfaction, customer loyalty will get better.
CONCLUSIONS AND SUGGESTIONS
The conclusion from this study are the influence of service quality (X1) and customer perceived value (X2) each individually has a significant effect on customer loyalty (Y). But it is different from customer satisfaction which has no significant effect on customer loyalty. This is because it is difficult to measure customer satisfaction accurately or without bias. However, simultaneously, the three independent variables significantly influence customer loyalty. This means that if an increase in service quality, balanced with an increase in value and customer satisfaction, the customer loyalty will be increased, too. Suggestions for DAMRI management to always improve service quality, especially in staff hospitality, punctuality, and driving ethics. Suggestions for further research, analyze two important things in measuring customer loyalty by measuring customer retention rates and total customer market share. In addition, it can also be analyzed what factors are needed by customers for the selection of tourism buses so that they can be used as a basis for marketing strategies.
ACKNOWLEDGEMENTS
296 Journal of Business on Hospitality and Tourism
REFERENCES
Fajar, Laksana. (2008). Manajemen Pemasaran. Graha Ilmu : Yogyakarta.
Ghozali, Imam. (2007). Edisi 4. Aplikasi Analisis Multivariate dengan Program SPSS 16. Badan Penerbit Universitas Diponegoro : Semarang.
Griffin, Jill. (2003). Customer Loyalty: Menumbuhkan dan Mempertahankan Kesetiaan Pelanggan, Terjemahan oleh Dwi Kartini Y, 2009. Erlangga : Jakarta.
Griffin, (2005). Customer Loyalty. Erlangga : Jakarta
Irianto, H. Agus. (2004). Statistik: Konsep Dasar dan Aplikasinya. Cet. 1. Jakarta: Kencana.
Kotler, Philip. (2002). Manajemen Pemasaran di Indonesia : Analisis, Perencanaan, Implementasi, dan Pengendalian. Salemba Empat : Jakarta. Kotler, Philip.(2005). Manajemen Pemasaran Jilid 1 dan 2. PT Indeks : Jakarta. Kotler, Philip, dan Gary Armstrong.(2003). Dasar-dasar Pemasaran, Jilid 1, Edisi
Kesembilan, Jakarta : PT Indeks Kelompok Gramedia.
Kotler, Philip dan Kevin La Ne Keller. (2007). Manajemen Pemasaran Edisi Kedua Belas. Indeks : Jakarta.
Kotler, Philip dan Kevin La Ne Keller. (2008). Manajemen Pemasaran. Indeks : Jakarta.
Laws, Eric. (1991). Tourism Marketing, Service and Quality Management Perspectives, Ltd, England : Stanley Thornes (Publishers) Ltd.
Lupiyoadi, Hamdani. (2006). Manajemen Pemasaran Jasa. Edisi Kedua. Penerbit Salemba Empat : Jakarta.
Majid, S.A. (2009). Customer Service Dalam Bisnis Jasa Transportasi. PT Raja Grafindo Persada : Jakarta.
Mason, R.D dan Douglas A Lind. (1999). Teknik Statistik Untuk Bisnis dan Ekonomi. Edisi kesembilan jilid 1. Penerbit Erlangga : Jakarta
Nasution, (2003). Metode Research. PT Bumi Aksara : Jakarta.
Paliati, Alida .(2007). Analisis Pengaruh Nilai Pelanggan, Kepuasan Terhadap
Loyalitas Nasabah Tabungan Perbankan di Sulawesi Selatan.
http//puslit2.petra.ac.id/ejournal/index-php/man article/view article/16637. Diunduh pada 25 September 2012.
Priyanto, P. H., dkk. (2000). Pedoman Penulisan Skripsi, Fakultas Psikologi UNIKA Soegijapranata : Semarang.
Priyatno. Dwi. (2008). Mandiri Belajar SPSS Untuk Analisa Data dan Uji Statistik. Andy Offset : Yogyakarta.
Priyatno, Duwi. (2012). Analisis Data dengan SPSS 20, Yogyakarta : Andi. Rangkuti, Freddy.(2006). Measuring Customer Satisfaction, Jakarta : PT.
Gramedia Pustaka Utama.
Rasyid, M. A. (2000). Analisa Faktor-Faktor Yang Mempengaruhi Loyalitas Konsumen Terhadap KFC. Skripsi Fakultas Ekonomi Universitas Diponegoro: Semarang.
297 Journal of Business on Hospitality and Tourism
Santosa BP, Ashari. (2005). Analisis statistik dengan Microsoft Excel & SPSS. Yogyakarta: Andi Offset.
Santoso, Singgih. (2010). Statistik Parametrik Konsep dan Aplikasi dengan SPSS. PT Elek Media Komputindo : Jakarta.
Sekaran, Uma. (2006). Metodologi Penelitian Untuk Bisnis, Jakarta : Salemba Empat.
Simamora, Bilson. (2004). Riset Pemasaran. PT Gramedia Pustaka Utama : Jakarta. Sugiyono. (2010). Metode Penelitian Kuantitatif Kualitatif dan R&D. Alfabeta:
Bandung.
Swastha, B. (1998). Manajemen Penjualan. BPFE : Yogyakarta.
Tjiptono, Fandy. (1997). Strategi Pemasaran. Andy Offset : Yogyakarta.
Tjiptono, Fandy. (2001). Strategi Pemasaran. Edisi Pertama. Andi Offset: Yogyakarta
Tjiptono, Fandy.(2005). Pemasaran Jasa. Edisi Pertama. Bayu Media Publishing : Malang.
Tjiptono, Fandy dan Chandra Gregorius. 2005. Service Quality and Satisfaction. Edisi 2. Andi Offset : Yogyakarta.
Tjiptono, Fandy. (2007). Strategi Pemasaran. Andy Offset : Yogyakarta.
Tjiptono, Fandy, dan Anastasia Diana. (2003). Total Quality Manajemen. Edisi Revisi. Andy Offset: Yogyakarta.