Alaa Saadi Aood
1, Noor Hasssony Jaddo
21Biology Department, Al-Farabi University College, Baghdad, IRAQ 2College of Science, Al-Mustansiriyah University, Baghdad, IRAQ
A r t i c l e i n f o
Received
5/4/2016
Accepted
5/6/2016
ABSTRACT
This investigation has been conducted to study some properties of local storm dust phenomena in Baghdad city .The monthly average of dust (g/m²) in Baghdad range from 10.2 g/m² in Nov. to 43.7 g/m² in April. The local dust has a highAerobic bacteria total count (Abtc) and O.M (%) compare to the storm dust. This may be due to the contamination of dust particularly the local dust.
The correlation coefficients between Abtc (No./100ml) Organic Matter (O.M)% and EC mmhos/cm, PH, Ca%, Mg%, Na meq/100g, Na meq/100 g, K meq/100 g and dust, g/m² have been done. The results indicate high relationships between Abtc ( No./ 100ml) Organic matter (O.M)%. The local dust (x) has high relationships with Abtc and O.M (% ) as examples. These have the follow Equation s:
1. O.M. % = 3.805 - 0.054 X r = 0.9534, describe the relation between O.M % and the studied local dust(x).
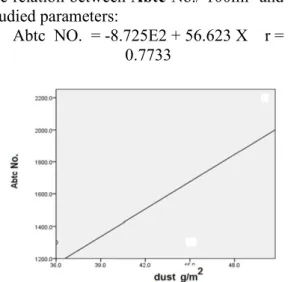
2. Abtc NO. = -8.725E2 + 56.623 X r = 0.7733, describe the relation between Abtc NO. and the studied local dust(x). The local dust samples are more contaminated compare to the storm dust samples in the city.
Keywords: Storm dust, local dust, properties, magnitude, dust occurrence, correlation coefficient.
Abtc O.M
0.9534 0.7733
(O.M ) O.M % = 3.805 - 0.054 x r =
0.9534 Abtc
Abtc NO. = -8.725E2 + 56.623
X r = 0.7733 Local dust
Dust Storm
INTRODUCTION
Drylands around North Africa and the Arabian
peninsula are the main terrestrial sources of
airborne dust in Iraq (4, 9). Dust storms arise
when a gust front or other strong wind blows contaminated loose soil particles (fine sand, silt, clay and organic particles) from a dry surface. Particles are transported
moves soil from one place to another [1]. It is an evidence of severe wind erosion effect which is one of the major cause of desertification phenomena [2, 3]. Particles become loosely held mainly due to drought or arid conditions, and varied wind causes. Gust fronts may be produced by the outflow of rain-cooled air from an intense thunderstorm. Or, the wind gusts may be produced by a dry cold
front, that is, a cold front that is moving into a
dry air mass and is producing no precipitation [4]. Dust storms have severe environmental physical and biological impacts and have been shown to increase the disease. Virus spores in the ground are blown into the atmosphere by the storms [5]. Dust storms has negative impact on the environment. Dust particles such as fine sand, silt, clay and organic particles affect both local and global environment. It reduces visibility, change the radiation and effects human health [6]. In Iraq, according to Abdulla and Naji [7]. The total number of the patients suffer from respiratory and cardiovascular (heart and circulatory system) diseases visit hospitals in Baghdad increase with increasing dust concentration in the atmosphere, the relation was highly significant between the total number of the patients suffer and increasing dust concentration. The effect of dust on health have been reported by WHO, [8].
Particles become loosely held mainly due to drought, arid conditions, and various wind speeds. Dust includes soil particles, organic matter, and varieties of microbes because dust comes from soil and go through the atmosphere and rain water then to the land. This causes sanitary conditions particularly in cities. Therefore, this investigation was undertaken to
study some properties of local and storm dust phenomena in Baghdad city in Iraq in June 2014 to January 2015.
MATERIALS AND METHODS
To carry out this investigation;
1. Three loca ons in June 2014 to January
2015 were taken from Baghdad area.
These are AL-Doura, Al-Cairo and Ur
2. Samples of storm dust were collected
according to the method used by the [11]. The samples are taken monthly with three replicates from each location and the
average mean of dust (g/ / month ) was
calculated.
3. Definations:
Dust stormsis rising from the bare land free of vegetation cover such as the desert areas in the east and south of the country. It is meteorological
phenomenon in dry regions such as Iraq. In
desert regions at certain times of the year, dust storms become more frequent because the strong heating of the air over the desert causes the lower atmosphere to become unsTable. This instability mixes strong winds in the middle troposphere downward to the surface, producing stronger winds at the surface. (4, 2) Local dust is rising from the bare land or dry soil particles (When the materials dry after a period of rain) on the streets in the city because the movement of transportations and the change in wind speed.
1. Data of storm dust (day/month) average of
30 years in Baghdad city were obtained from Iraqi Meteorological Organization, Climatological, Baghdad Iraq [9]. This is used as hour/month after conversion (Dust, hour/month = dust, day/month x 24). In addition, the following measurements were done: Aerobic bacteria total count Abtc),
Organic matter (O.M), Electrical
Conductivity (EC), PH, Calcium Ca2+),
Magnesium (Mg2+), Sodium (Na+) and h)
Potassium (K+) for dust samples from both
storm and local dust.
2. Dust test: 1:2 dust-to-water extraction has
been used to determine the above measurements [10].
3. Computer programs (SPSS Version 16) were
used to analysis the data and get the best fit Equation between dust (g/
some dust properties.
The following liner Equation was found to be the best describes the relationship between:
a. Organic matter % and the local
dust(g/ ) in the samples
O.M % = 3.805 - 0.054 x r = 0.9534
b. Abtc( No./ 100ml) and the local
Abtc NO. = -8.725E2 + 56.623 X r = 0.7733
These Equation s show strong relationships as can be seen from the values of correlation coefficients.
RESULTS AND DISCUSSION
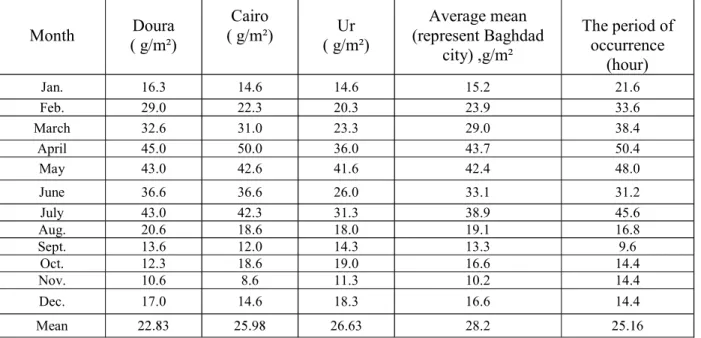
Table 1 shows monthly means and the average means of dust ( g/m²) from three examined locations (Doura, Cairo and Ur). It can be seen
that the average means of dust range from 10.2 g/m² in Nov. to 43.7 g/m² in April and average mean of dust ( g/ that represent Baghdad city. The average dust storm (hour/month) is of 30 years in Baghdad city. The means of dust ( g/m²) of the three locations (Doura, Cairo and Ur) and the dust storm (hour/month). The average means represent Baghdad city (see Table 1) .
Table 1: The means and of dust ( g/m²) of the three locations (Doura, Cairo and Ur) and the dust storm (hour/ month)* in Baghdad city. The average means represent Baghdad city in Iraq.
Month ( g/m²) Doura
Cairo
( g/m²) ( g/m²) Ur
Average mean (represent Baghdad
city) ,g/m²
The period of occurrence
(hour)
Jan. 16.3 14.6 14.6 15.2 21.6
Feb. 29.0 22.3 20.3 23.9 33.6
March 32.6 31.0 23.3 29.0 38.4
April 45.0 50.0 36.0 43.7 50.4
May 43.0 42.6 41.6 42.4 48.0
June 36.6 36.6 26.0 33.1 31.2
July 43.0 42.3 31.3 38.9 45.6
Aug. 20.6 18.6 18.0 19.1 16.8
Sept. 13.6 12.0 14.3 13.3 9.6
Oct. 12.3 18.6 19.0 16.6 14.4
Nov. 10.6 8.6 11.3 10.2 14.4
Dec. 17.0 14.6 18.3 16.6 14.4
Mean 26.63 28.2
* Average of 30 years
The values in the Table reach 43.7 and 42.4 g/m² in April and May respectively. However, it reaches 15.2 g/m² Jan.
Some Properties (Abtc No./100ml, O.M %, EC mmhos/cm, PH, Ca%, Mg%, Na meq/100g,
Na, meq/100g, K meq/100g and Dust, g/m²) of local and storm dust are shown in Table 2. It can be seen that the local dust has high Abtc
and O.M (%) compare to the storm dust. This may be due to the contamination of dust particularly the local dust.
Table 2: Properties (Abtc No./ 100ml, O.M %, EC mmhos/cm, PH, Ca%, Mg%, Na meq/100 g, Na,meq/100 g, K meq/100 g and Dust , g/m²) of local and storm dust
Properties Doura Cairo Ur
Average mean (represent Baghdad
city)
Local Dust
Abtc( No./ 100ml) 15 3
O.M (% ) 1.8 2.5 2.1
EC(mmhos/cm) 6.0 12.0 9.0
PH 7.2 8.2 8.0
Ca(%) 15.0 24.0 20.0
Mg(%) 12.0 20.0 18.0
K(meq/100 g) 0.8 2.0 1.2 Dust ( g) average samples
means in April 50 50 50
Storm dust
Abtc( No./ 100ml) 13 2200 13 1750
O.M( %) 1.5 1.0 1.8 1.43
EC (mmhos/cm) 4.5 11.0 5.0 6.83
PH 7.0 7.8 8.2 7.66
Ca(%) 18.1 21.0 20.8 19.96
Mg(%) 12.0 19.9 15.0 15.63
Na(meq/100 g) 3.5 7.0 5.0 5.16
K(meq/100 g) 0.4 1.7 2.3 1.46
Dust ( g/m²)
in April ( Table 1 ) 45.0 50.0 36.0
43.66
In Table 3, the correlation coefficient among (Abtc No./ 100ml, O.M%, EC mmhos/cm, PH, Ca%, Mg%, Na meq/100 g, Na,meq/100 g, K meq/100 g and dust, g/m²) are show in Table 3.
The local dust has strong relationship between Abtc and O.M (% ) and other dust Properties. This may explain the results in Table 2 that shows high values of Abtc and O.M .
Table 3: Shows Pearson correlation coefficient of examined parameters.
Abtc O.M EC PH Ca Mg Na Dust K
Abtc
Pearson
Correlation 1 0.929- 0.931 0.189 0.553 0.927 0.904 0.773 0.208 Sig. (2-tailed) 0.242 0.237 0.879 0.627 0.245 0.281 0.437 0.867
N 3 3 3 3 3 3 3 3 3
O.M
Pearson
Correlation -0.929 1 -0.730 0.189 -0.204 -0.721 -0.681 -0.953 0.170 Sig. (2-tailed) 0.242 0.479 0.879 0.869 0.488 0.523 0.195 0.891
N 3 3 3 3 3 3 3 3 3
The relation between O.M % and the studied parameters are described by Figure 1 and 2. Figure 1 and the following Equation describe the relation between O.M%and the studied parameters:
O.M % = 3.805 - 0.054 x r = 0.9534
Figure 2 and the following Equation describe the relation between Abtc No./ 100ml and the studied parameters:
Abtc NO. = -8.725E2 + 56.623 X r = 0.7733
Figure 2: The relationship between Abtc and dust the studied parameters.
CONCLUSION
From the above results, the monthly means and the average means of dust ( g/m²) of the three locations (Doura, Cairo and Ur) in Baghdad. It can be seen that the average means of dust range from 10.2 in Nov. to 43.7 g/m² in April( represent Baghdad city).
The local dust has high Abtc and O.M (%) compare to the storm dust. This may be due to the contamination of dust particularly the local dust. The correlation coefficients among Abtc No./ 100ml, O.M % and EC mmhos/cm, PH, Ca%, Mg%, Na meq/100g, Na, meq/100g, K meq/100g and dust, g/m²) have been done. The local dust has high relationships with Abtc and O.M (% ) as follow:
O.M % = 3.805 - 0.054 x r = 0.9534 Describe the relation between O.M % and the studied parameters.
Abtc NO. = -8.725E2 + 56.623 X r = 0.7733
Describe the relation between Abtc NO. and the studied parameters
ACKNOWLEDGEMENT
The assistance and the co-operation of Biology Department/Al-Farabi University College and the College of Science Staff in Al-Mustansiriyah University are gratefully acknowledged
REFERENCES
[1] Dregne, H. E .2002,Land degradation in the drylands. Arid Land Research and Management. 16: 99-132.
[2] Abdulla ,H. J. and Samira M. Dawood. 2005. Wind erosion and dust storm in relation to climate condition, in Baghdad area, Iraq. Al- Mustansiriya J. Sci Vol. 16, No. 1, 2005. P 82 88.
[3] Abdulla,H. J. 2011. Desertification - Ecosystems degradation .Dardjlah. Aman. Jordan.PP.304
[4] Squires, V. R., 2007. "Physics, Mechanics and Processes of Dust and Sandstorms and butta" Adelaide University, Australia
[5] Vidal, John .2010. "Dust storms spread deadly diseases worldwide". London: guardian.co.uk
[6] Park, Min Ha, Kim,Yong Pyo and Kang,ChangHee,2003.
Aerosolcomposition change due to dust storm ,measurements between 1992 and 1999 at Gosan, Korea,Water,Air and Soil Pollution: Focus 3,117-128
[7] Abdulla, H, J. and Z,S.. Naji. 2010 . Determining air quality index of pollutant particles and its health impacts. Al Mustansiryia J. Sci. Vol. 21, No.5
[8] WHO, World Health Organisation, 2002. reports
[9] Iraqi Meteorological Organization, Climatological, Baghdad Iraq, 2015
[10] Abdulla, H. J. Hassan A. A. & Ashraf, S. Hassan, 2011. Soil, water & Plant Analysis (Physical, Chemical & Biological Analysis). (In Arabic) Dar Djlah Aman Jordain. PP. 375.