Content-aware objective video
quality assessment
Benhur Ortiz-Jaramillo
Jorge Niño-Castañeda
Ljiljana Plati
š
a
Wilfried Philips
Content-aware objective video quality assessment
Benhur Ortiz-Jaramillo,*Jorge Niño-Castañeda, Ljiljana Platiša, and Wilfried Philips
Ghent University, TELIN-IPI-iMinds, St-Pietersnieuwstraat 41, Ghent, Belgium
Abstract. Since the end-user of video-based systems is often a human observer, prediction of user-perceived video quality (PVQ) is an important task for increasing the user satisfaction. Despite the large variety of objective video quality measures (VQMs), their lack of generalizability remains a problem. This is mainly due to the strong dependency between PVQ and video content. Although this problem is well known, few existing VQMs directly account for the influence of video content on PVQ. Recently, we proposed a method to predict PVQ by intro-ducing relevant video content features in the computation of video distortion measures. The method is based on analyzing the level of spatiotemporal activity in the video and using those as parameters of the anthropomorphic video distortion models. We focus on the experimental evaluation of the proposed methodology based on a total of five public databases, four different objective VQMs, and 105 content related indexes. Additionally, relying on the proposed method, we introduce an approach for selecting the levels of video distortions for the purpose of subjective quality assessment studies. Our results suggest that when adequately combined with content related indexes, even very simple distortion measures (e.g., peak signal to noise ratio) are able to achieve high per-formance, i.e., high correlation between the VQM and the PVQ. In particular, we have found that by incorporating video content features, it is possible to increase the performance of the VQM by up to 20% relative to its non-content-aware baseline. © The Authors. Published by SPIE under a Creative Commons Attribution 3.0 Unported License. Distribution or reproduction of this work in whole or in part requires full attribution of the original publication, including its DOI.
[DOI:10.1117/1.JEI.25.1.013011]
Keywords: spatial activity; temporal activity; user-perceived video quality; video content analysis; video quality assessment. Paper 15390SSP received May 15, 2015; accepted for publication Dec. 7, 2015; published online Jan. 20, 2016.
1 Introduction
Quality control of video-based systems is a very important task for increasing the user satisfaction. Since the end-user is often a human observer, quality control should include mea-sures that mimic the user-perceived video quality (PVQ).1
Quality assessment of videos has an important role in evalu-ating and improving the performance of such systems.
Methods for video quality assessment can be grouped into two categories: subjective and objective assessment.2 Subjective assessment is typically performed by a group of humans, who evaluate videos according to certain well-defined criteria such as those well-defined in the related International Telecommunication Union (ITU) Standards.3 Often, the result of such an assessment is a mean opinion score (MOS) or a difference-MOS (DMOS) per assessed video sequence. Although MOS and DMOS do not fully characterize the response of human subjects (e.g., no informa-tion about the rating scale and about the variability of the human ratings4,5), these measures are considered the most important parameters in characterizing subjective rating of video-based systems.3,4,6 Additionally, when a sufficiently
large group of human subjects is available, this methodology is the most well-known and most widely used technique for measuring PVQ of video-based systems.3,6 However, such a
technique is in general complex, expensive, and time consum-ing. Therefore, it is unpractical for real time video processing and hard to incorporate into a system design process.2For this reason, many researchers have proposed objective (numerical) methods for predicting PVQ directly from the video data,
termed video quality metrics (VQMs). Currently, there exists a large variety of objective methods, ranging from simple ones employing local spatiotemporal statistics, detail losses, and additive impairments, to more complex ones, such as those based on the results of physiological and/or psychovisual experiments.2,7–11
However, these objective methods are computationally too complex and/or not generic enough for a wide variety of video content scenes. The latter problem is mainly due to the strong dependency of VQMs on the video con-tent.12–19 Despite this dependency being well known, only a few existing quality measures directly account for the effects of content. For instance, Feghali et al.,12 Garcia et al.,17Korhonen and You,16and Ou et al.19proposed mod-els that combine content related indexes, peak signal to noise ratio (PSNR), bit rate, spatial and temporal resolution for estimating the quality of compressed video sequences. However, those methodologies were tested only on a few typical test videos without showing its generalization power (each of these works uses a maximum of seven differ-ent video sequences selected and processed by the authors under specific conditions). For instance, the model proposed by Ou et al.19can be evaluated only in the range of quanti-zation step size, spatial and temporal resolution explored by the author (see Sec. 2.1for a summary of the differences between the proposed methodology and the state of the art). In any case, while these solutions are not generic enough, they have shown that incorporating content in the VQM computation considerably improves the correlation between subjective and objective quality assessment as well as keeping a low-computational complexity.12,14,16,17,19 Another major issue concerning objective video quality assessment is the limited evaluation of the state-of-the-art *Address all correspondence to: Benhur Ortiz-Jaramillo, E-mail:bortiz@telin
VQMs. Typically, the methods are tested on databases including few testing samples (video sequences), exhibiting little variation in the scene content (e.g., Winkler20has con-cluded that, overall, current public databases manage to cover about 10% to 20% of the possible range in the spatial and temporal dimensions), spatial/temporal resolution, and/ or not being publicly available. For instance, Pinson and Wolf7 (20 sequences from the VQEG-FR database21), Wang and Li8 (20 sequences from the VQEG-FR
data-base21), Seshadrinathan and Bovik9 (20 sequences from the VQEG-FR database21), and Li et al.10 (10 sequences
from the LIVE video quality database22) used only one data-base for evaluating their methodologies. Ortiz-Jaramillo et al.11(20 sequences from LIVE22and IVP23video quality databases) and Moorthy and Bovik24 (30 sequences from LIVE22 and VQEG-FR21 video quality databases) used
two databases to demonstrate the performance of their pro-posed methodologies. Even in the most recent review paper concerning objective video quality assessment presented by Chikkerur et al.,25only two public databases (30 sequences from LIVE22and VQEG-FR21video quality databases) have been used for comparing performance of the considered VQMs. This is, in general, very few test samples for drawing conclusions from the obtained data. In the present paper, we aim to resolve this issue by performing the evaluation on a total of 696 distorted sequences (corresponding to a total of 102 source sequences covering about 50% to 60% of the possible range in the spatial and temporal dimensions, cf. Fig. 8), differing in content as well as in their temporal and spatial resolution.
In this paper, we consider the methodology for content-aware objective video quality assessment which has been proposed in Ref.26. That approach involves offline training of the mapping functions’parameters and their relationship to video content characteristics. The offline training of parameters is done by first computing a VQM between a reference (perfect quality) sequence and several corrupted/ processed versions of that sequence. Next, assuming the DMOS values are known for multiple levels of distortion, we tune a mapping function to predict DMOS from the VQM, i.e., the parameters of the mapping function are tuned specifically to each source content. Finally, we find a model to estimate the parameters of the mapping function using the extent of image details and motion of the video sequence.
In particular, in this paper we extend the work presented in Ref. 26 in three main directions. First, we perform an extensive experimental evaluation based on a total of four VQMs, each tested on 696 distorted video sequences. The four tested VQMs comprise three newly presented here [structural similarity index measure (SSIM),27
standard-ized method for objectively measuring video quality (SOVQM),7 and video quality assessment by decoupling detail losses and additive impairments (VQAD)10], and PSNR as in Ref.26. For the considered VQMs, we explore the 105 content related indexes defined in Ref.26to model the relationship between the VQM and the DMOS. The 696 test video samples (102 source video sequences) were taken from five public databases of which three are newly analyzed here with the purpose of testing the generalization power of the methodology (IRCCyN IVC Influence Content18 and CIF as well as 4CIF EPFL-PoliMI28) and IRCCyN IVC
1080i,29 IVP23 as in Ref. 26. Second, we describe the differences between the proposed methodology and other state-of-the-art methodologies which explicitly include con-tent related indexes in their computation. Third, we provide guidelines for using the proposed approach to select an appropriate set of video distortion levels for the purpose of subjective quality assessment studies.
Our experimental results suggest that, when adequately combined with content related indexes, even very simple dis-tortion measures (such as PSNR) are able to achieve high performance, i.e., high correlation between the VQM and the PVQ. Especially, we have found that by incorporating video content features, it is possible to increase the perfor-mance of a VQM by up to 20% relative to its noncontent-aware baseline.
This work is organized as follows. In Sec. 2, current approaches dealing with objective assessment of videos are discussed. Afterward, we explore multiple factors affect-ing the relationship between VQMs and PVQ under varyaffect-ing content. Later, Sec.3 discusses the proposed methodology and its implementation details. The experimental setup and the proposed validation methodology are described in Sec. 4. Thereafter, in Sec. 5, we present and discuss the results obtained in our cases of study. Finally, in Sec. 6, we draw conclusions and propose future work.
2 Rationale
In the following, we provide a summary of the state of the art of objective video quality measures and describe the effects of video content on some of the most well-known and most widely used objective VQMs.
2.1 Background
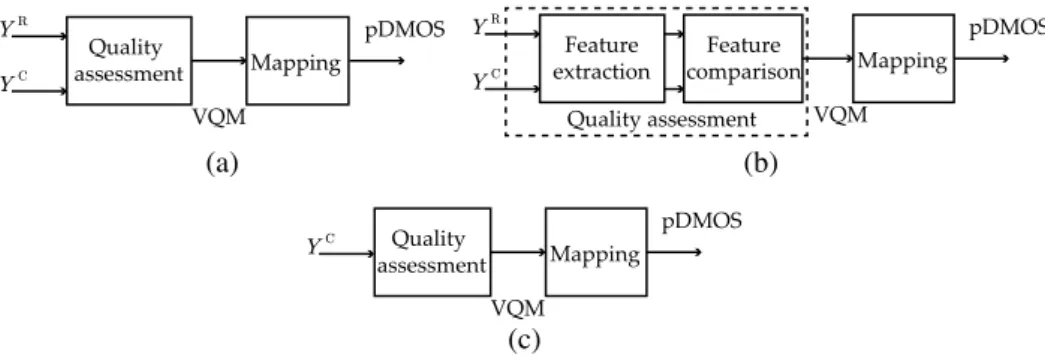
Objective VQMs use computer algorithms for computing numerical scores on corrupted video sequences that should agree with the subjective assessment provided by human evaluators. In general, VQMs are categorized as full-refer-ence, reduced-referfull-refer-ence, or no-referfull-refer-ence, depending on the availability of a reference.25 In Fig. 1, YR and YC are
the reference and corrupted video sequences, respectively. In either case, the final predicted quality value, termed pDMOS, is typically obtained by applying a predefined mapping to the quality measure.6
Algorithms following the frameworks of Figs.1(a) and
1(b) can be further classified into traditional point-based (TPB) methods, natural visual characteristic (NVC) meth-ods, or perceptual oriented (POM) methmeth-ods, depending on the set of techniques used to compute the quality measure.25 TPB full-reference quality measure use pixel-wise opera-tions for computing differences between images and/or video sequences, for instance, PSNR is the most simple but still widely used TPB full-reference quality measure.2 NVC methods use statistical measures (mean, variance, his-tograms) in local neighborhoods and/or visual features (blur-ring, blocking, texture, visual impairments) for computing numerical scores. For example, SOVQM7 is computed by
using local spatiotemporal statistics which are computed on blocks of a fixed size. Afterward, the extracted features from reference and corrupted sequences are thresholded, compared, and pooled to obtain a unique numerical quality measure. Another example from this category is the well-known SSIM27 which uses statistics (mean and standard
deviation) of neighboring pixels to characterize luminance, contrast and structure of the reference, and corrupted sequen-ces. Thereafter, features of the reference and corrupted sequences are compared and pooled obtaining a numerical quality measure. A most advanced technique of NVC meth-ods is the VQAD10 measure which subtracts a restored
version of the corrupted sequence from the reference sequence. This subtraction is made to differentiate between distortions due to detail losses (edges, high textured regions, and/or small objects) and distortions due to additive impair-ments such as blocking artifacts, noise, and/or false edges. Thereafter, detail losses and additive impairments higher than a threshold are individually pooled and linearly com-bined to predict the quality of the corrupted sequence.
POM methods have been designed based on the results of physiological and/or psychovisual experiments. This approach includes, among others, modeling human visual attention and modeling human speed perception.8,9,11For in-stance, the weighted structural similarity index (wSSIM)8 uses the SSIM for measuring local image similarities, termed quality maps. For computing a unique quality score from those quality maps, a spatiotemporal weighted mean based on saliency maps is used. The saliency map is com-puted based on a statistical model of speed perception derived from psychovisual experiments conducted by Stocker and Simoncelli.30 The weighted temporal quality metric (wTQM)11 computes temporal distortions directly
from optical flows and models the human visual attention using saliency maps on the pooling strategy. Such saliency maps were computed based on the results of psychovisual experiments conducted by the authors.11 Motion-based
video integrity evaluation index (MOVIE)9 uses a Gabor filter bank specifically designed based on physiological findings for mimicking the visual system response. The video quality evaluation is carried out from two components (spatial and temporal distortions). The spatial distortions are computed as squared differences between Gabor coefficients and the temporal distortions are obtained from the mean square error between reference and corrupted sequences along motion trajectories.9 Thereafter, both distortions are combined to predict the quality of the corrupted sequence. Noteworthy is that the methods mentioned above do not account directly for content information and instead they use mechanisms to mimic the visual system under certain conditions (implicit content compensation) which is often inaccurate and computational complex.9,11
To the best of the authors’knowledge, only few works in the literature explicitly use content information for
video quality assessment. For instance, Feghali et al.12 used PSNR, frame rate, and average motion magnitude to estimate quality of low-resolution video sequences. In con-trast to our proposed methodology, Ref.12does not take into account the saturation effect of the human vision and the spa-tial information of the sequences. This can be seen as a dis-advantage of their approach knowing that PVQ is affected by both spatial and temporal content related indexes13and that
previous works have shown that PVQ and PSNR is better modeled by using an S-shape function which takes into account the saturation effect of the human vision.15,26,31 Khan et al.14 acknowledged the importance of the content as they investigated the impact of packet loss on video con-tent by identifying minimum quality requirements of the sys-tem under specific video content. However, that work does not specifically propose a VQM. Garcia et al.17used content related indexes extracted from the encoded data (block-based motion vectors, discrete cosine transform coefficients, num-ber of macro blocks per frame) and the bit-rate for modeling the quality of high-definition compressed video sequences. But, applying that model requires a two-step fitting process with subjective scores. First, the model is fitted with training data using an exponential function and linear combination of content related indexes. Second, during the testing pro-cedure, the test data is fitted to the values given by the expo-nential function by using a cubic function. That is, unlike the proposed methodology, the method of Ref. 17needs prior information about the testing data which in general is not available.
Rodriguez et al.32investigated the impact of video content preference in measuring the quality of video streaming appli-cations. The methodology uses a nonlinear combination of the following technical parameters as quality index: number, duration, and temporal location of pauses that occur during a video streaming transmission. Additionally, a so-called con-tent preference function is used to adjust the quality index value. The content preference function is selected from a set of three functions specifically selected for one of the con-tent-type categories defined by the authors (sports, news, or documentary). That is, unlike the proposed methodology, the scheme of Ref.32needs to classify the video content into predefined categories which in general is unpractical in the design of VQMs.17Recently, Ou et al.19proposed a strat-egy for estimating the quality of compressed video sequen-ces by using quantization step of the coder, normalized motion activity, standard deviation of frame differences, Gabor features, and spatial and temporal resolution. The model estimates three different mapping function parameters
(a) (b)
(c)
Fig. 1 General framework for video or image quality assessment depending on the reference availability. (a) Full-reference, (b) reduced-reference, and (c) no-reference framework.
using the linear combination of content related indexes. Although their model is similar to the methodology consid-ered in our work, it has several comparative drawbacks. For instance, the model in Ref.19uses what the authors call nor-malized MOS which depends on the perceived quality of the video sequence under maximum spatial resolution, maxi-mum frame rate, and minimaxi-mum quantization level, which are not available for the typical video-based applications. Also, the model of Ref. 19 is highly dependent on the range of spatial resolutions and frame rates used during the training phase. Even more limiting is the fact that the model can only be evaluated under specific conditions such as when there are multiple processed video sequences at different temporal resolution under the same spatial reso-lution and quantization step size. That is, the model cannot be generalized or evaluated under the conditions of regular video-based applications. The methodology proposed in Ref. 26 is based on the work of Korhonen and You.16
They proposed a model that combines the standard deviation of Sobel filtered images, the standard deviation of frame differences, and PSNR for estimating the quality of three sequences from the CIF EPFL-PoliMI Video Quality Assessment Database.28In that work, an exponential func-tion was used as mapping funcfunc-tion that, unlike Ref. 26, does not take into account the saturation effect of human vision. In addition, Ref.16tests linear models up to 1 content related index (ITU-T spatial and temporal information mea-sures,33PSNR between two consecutive frames as a temporal activity index, and average weighted sum of discrete cosine transform coefficients as a spatial activity metric). By con-trast, Ref. 26 tests linear combinations up to two content related indexes from a set of 105 selected indexes. This allows to include spatial as well as temporal dimensions in the quality assessment which agrees with the fact that PVQ is affected by both types of content related indexes.13 Finally, compared with Ref. 16 which used only three sequences for testing, the study of Ref.26presents a stronger statistical analysis based on the results obtained on four dif-ferent video quality databases and without omitting sequen-ces from the tested data.
Although many different approaches that try to estimate quality of corrupted sequences have been proposed, human-like (anthropomorphic) video quality assessment is still an open problem because none of the state-of-the-art VQMs is generalizable across all types of distortion and/or all video content, that is to say, none of them succeeds to agree with PVQ under all conditions (varying distortions and varying content).13Even more, there is no clear recom-mendation to date on which VQM is best to use under vari-ous conditions.
2.2 Effects of Video Content on Video Quality Measures
Huynh-Thu and Ghanbari15have studied using experimental data on the scope of application of PSNR as VQM. The authors found that PSNR is a good indicator of quality when the content and distortion type are fixed. Addi-tionally, in Ref.26, we have studied the DMOS in function of PSNR for different cases of source content in order to model the relationship between PSNR and PVQ under vary-ing video content. The results suggested that there is a unique mapping function PSNR → DMOS when the reference
content is fixed, i.e., the parameters of the mapping function depend mostly on the video content.26,34Also, Keimel et al.34
stated that even simple measures can perform well when tuned to a specific source content.
In this paper, we further explore the relationship between PVQ and other VQMs (SSIM,27 SOVQM,7 and VQAD10)
under varying content. First, we explore the most appropri-ated mapping function VQM→DMOS by using the same methodology discussed by Ortiz-Jaramillo et al.26That is, we consider the following 12 linear and nonlinear monotonically decreasing/increasing functions: (a) linear, (b) quadratic, (c) cubic, (d) exponential, (e) logistic, (f) hyperbolic, (g) cosine, (h) logarithmic, (i) rational, (j) complementary error, (k) complementary cumulative raised cosine, (l) com-plementary cumulative log-Laplace. Previous functions were selected based on inspection of the experimental data com-puted on the IRCCyN IVC 1080i29 video quality database
(see Sec.4.1for detailed description of the test sequences). Afterward, we selected from the set of functions, the function with the best fit to the data by means of statistical analysis. Specifically, the selection was performed by using pairwise comparisons as discussed by Garcia et al.35The objective of this test is to determine if we may conclude from the data that there is difference among the tested functions. From the pairwise comparisons, we found that the best performing functions are:
• for PSNR: (b) quadratic, (c) cubic, (i) rational, (j) com-plementary error, and (k) comcom-plementary cumulative raised cosine (correlations higher than 92%);
• for SSIM: (b) quadratic, (c) cubic, (j) complementary error, and (k) complementary cumulative raised cosine (correlations higher than 90%);
• for SOVQM: (b) quadratic, (c) cubic, (e) logistic, (j) complementary error, and (k) complementary cumulative raised cosine (correlations higher than 93%);
• for VQAD: (a) linear, (b) quadratic, (c) cubic, (e) rational, (j) complementary error, and (k) comple-mentary cumulative raised cosine (correlations higher than 90%).
Listed functions above are the best performing functions per VQM, i.e., there are not significant differences between them (p-values higher than 0.1) but they perform signifi-cantly better than the other tested functions (p-values lower than 0.05). Although (a) linear, (b) quadratic, (c) cubic, and (i) rational are some of the best performing functions, they do not account for the saturation effect of human vision which is a very important effect when measuring PVQ. That is, human vision has little sensitivity to small changes in quality in the ranges of very low or very high levels of image qual-ity.36 Therefore, it would be more desirable as an S-shape function such as (e) logistic, (j) complementary error, or (k) complementary cumulative raised cosine to take into account the saturation effect of human vision. Note that, some public video quality databases includes only four dis-tortion levels per scene (e.g., IRCCyN IVC Influence Content18), which greatly limits the number of data points available in the training process. That is, due to limitations in the current available data, it is inconvenient to model the relationship VQM→DMOS with more than two parameters.
Therefore, it is important to keep the number of parameters limited for avoiding over fitting and poor generalization power of the trained models.
Thus, following the statistical test and taking into account the saturation effect of the PVQ as well as the limitations due to number of data points, we choose the complemen-tary error function for the four tested VQMs. The comple-mentary error function is defined as fðx;aÞ ¼1−
1∕2½1þerfðx−a1∕a2
ffiffiffi 2
p
Þ, wherea¼ ½a1; a2T is a vector
of parameters with the best fit to the DMOS controlling the x-axis bias and the slope of the mapping function. Here,
erfðxÞ ¼2∕pffiffiffiπ∫x
0 expð−w2Þdw. The parameters of this
function can be easily associated to the saturation effect of human vision and the rate of change between the VQM and the PVQ which are the most affected parameters under varying content.16,26 On the one hand, the rate of change controls how fast the VQM should drop or rise depending on the content, i.e., it controls the ratio between DMOS/VQM. From the PVQ point of view, it is the mini-mum change in the VQM to get a perceived quality differ-ence. For instance, for a high textured sequence (natural scenes), the ratio of change should be smaller than for a low textured sequence (cartoon scenes) because it is more easy to perceive distortions in the former type of scenes. On the other hand, the saturation effect of human vision is controlled by using the so-called halfway point26 of the S-shape curve. That is, the VQM value in which MOS or DMOS equals to 0.5 (in a 0-1 MOS or DMOS range). From the PVQ point of view, it controls the saturation point of quality, i.e., it controls where, in the VQM axis, the human vision has little sensitivity to small changes in quality (very high or low PVQ).
These suggest that the parameters of the mapping func-tion VQM → DMOS depend on the content information of the source sequence. Therefore, the influence of video content on PVQ can be compensated by selecting appropri-ate parameters for the mapping function.14,16,17,26However,
in practical applications, the parameters of the mapping func-tion are unknown a priori. The challenge is to find a method to adjust such parameters automatically to the spatiotemporal video content at hand.
3 Proposed Methodology
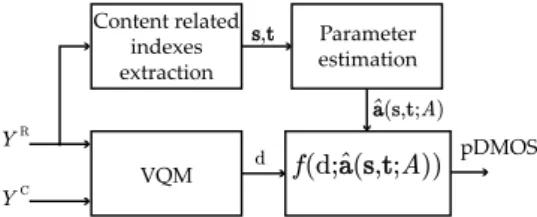
Figure 2 shows the proposed framework for video quality assessment including content information. This framework was motivated by the works of Ortiz-Jaramillo26 and Korhonen and You.16In the quality measure step, a numeri-cal VQM is computed on YR and YC video sequences obtaining a numerical valued. We extract the content related indexes from the reference sequence. Elements of vectorss
andtare content related indexes representing the SA and TA of the video sequence, respectively. The SA and TA are used as input to the parameter estimation block which is a simple linear model trained offline using a set of training samples (See Sec. 3.2 for implementation details). Afterward, the estimated parameters and the VQM value are used as input to the mapping function to estimate the quality of the cor-rupted sequence.
3.1 Offline Training for the Proposed Methodology
The purpose of the offline training process is to estimate the coefficients of the matrixAwhich is a parameter of the map-ping functionf(see Fig.2). The training is performed using I source contents (reference videos) and their J corrupted (distorted) versions, thus a total ofI×ðJþ1Þvideo sequen-ces, for which the perceived quality scores (DMOSi;j) are known. There, the matrix A describes the relationship between the following three components: (1) the values of the selected VQM computed for the training sequences, (2) the content-related indexes of the training sequences, and (3) the perceived quality of the training video sequences (DMOS).
The offline training starts by computing VQM values (dj)
between a reference sequenceYRi and its corrupted versions YCi;j∀ j¼1; : : : ;J, whereJis a total number of available cor-rupted sequences of thei’th source content. Therefore, a non-linear regression method (in our case, the least absolute residual method37) is applied between VQM values and the corresponding available set of DMOS values for the i’th source content. The result of the nonlinear regression is the set of parameters (ai) for the mapping functions
tuned specifically on the i’th source content [see Fig. 3 (a)]. si and ti are computed for the i’th source content
with the purpose of characterizing the content information of the sequence. Afterward, the content related indexes and the mapping function parameters (ai) are used to find a matrix A such that PIi¼1kai−A½1;si;tiTk≈0, where I
is the number of available training source contents [see Fig.3(b)]. Thus, after finding the matrixAduring the offline training, the model is ready for evaluating an arbitrary unknown incoming sequence by applying the following steps: (1) compute d value, s and t, (2) compute
^
a¼A½1;s;tT, and (3) predict the DMOS by mapping the obtainedd value using the mapping function and the esti-mateda^ parameters, i.e.,fðd; ^aÞ.
3.2 Implementation Details
The implementation of the VQMs used in this paper were obtained from the Web pages of the authors (SSIM,38
VQM,39 VQAD40), except for the PSNR which was com-puted as PSNR¼10 log10ðL2∕MSEÞ, where MSE is the mean square error between luminance channels, i.e.,MSE¼
1∕NMKPn;m;kðYRðn; m; kÞ−YCðn; m; kÞÞ2forKframes of sizeN×M. Here,Lis the maximum luminance value ofYR. Note that for PSNR as well as for SSIM the quality increases when the VQM increases while for SOVQM as well as for VQAD the quality decreases when the VQM increases. Therefore, we use fðx;aÞ for PSNR and SSIM and
1−fðx;aÞfor SOVQM and VQAD.
Currently we have explored content related indexes extracted from pixel-wise differences (magnitude of spatial and temporal gradients), spatial dependencies of pixel values Fig. 2 Framework of the proposed methodology.d anda^ denote,
respectively, the numerical value of the quality measure and the esti-mated parameters for the mapping function.a^is estimated by using the matrixA(obtained during the offline training) and SA (s) as well as TA (t).
(gray level co-occurrence matrix GLCM41), magnitude of
optical flows (Lucas–Kanade algorithm42), magnitude of
spatial Sobel filtered images, and the magnitude of SI13 fil-tered images.7(SI13 filter is a spatial filter designed specifi-cally to measure perceptually significant edges by using a 13 pixels filter.7) In particular, the following statistics were extracted as content related indexes. From the GLCM we have computed the following features: energy, entropy, con-trast, and homogeneity as well as correlation (cf. Randen and Husøy41) per frame. From the pixelwise differences, the magnitude of optical flows, the magnitude of Sobel filtered images, and the magnitude of SI13 filtered images we have computed descriptive statistics per frame, i.e., mean, median, standard deviation, skewness, kurtosis, and total variation (sum of absolute values). Thereafter, the mean, the standard deviation, and the maximum of those descriptive statistics per frame are computed as global content related indexes. That is, 15 content related indexes on GLCM [(energy, entropy, contrast, homogeneity, correlation)× (mean, stan-dard deviation, maximum) = 15] and 18 content related indexes on five spatial and temporal features [(mean, median, standard deviation, skewness, kurtosis, total variation) × (mean, standard deviation, maximum) × (spatial pixel-wise differences, temporal pixel-pixel-wise differences, the mag-nitude of optical flows, the magmag-nitude of Sobel filtered images, the magnitude of SI13 filtered images)¼18×5¼
90], resulting in a total of 15þ90¼105 content related indexes.
Based on experimental results, we found that among the tested content related indexes, those based on statistics of images filtered with SI13 filter, temporal gradients and spa-tial dependencies of pixel values are simple and effective in estimating content information as it has already been sug-gested in other related works.7,14,16,17,26,33That is, we have
explored the linear combinations of the 105 different content related indexes explained in the previous paragraph. The lin-ear combination consists of up to two content related indexes with the purpose of keeping a simple model with the highest correlation between the explanatory variables and the avail-able training set of parameters of the mapping function.26
Before showing the best performing linear models, we describe the individual used content related indexes:
• s1 is the mean value of the magnitude of the SI13 image: EQ-TARGET;temp:intralink-;sec3.2;326;563 s1¼ 1 NMK X n;m;k kSI13fYRgðn; m; kÞk;
wherekSI13fYRgðn; m; kÞkis the magnitude ofYR fil-tered by using the SI13 filter in the ðm; nÞth pixel of thek’th frame (cf. Pinson and Wolf7).
• s2is the mean skewness over all frames of the
magni-tude of the SI13 image:
EQ-TARGET;temp:intralink-;sec3.2;326;467 s2¼ 1 K X k 1 NM−1 P n;m ðkSI13fYRgðn; m; kÞk−s1Þ3 1 NM P n;m ðkSI13fYRgðn; m; kÞk−s1Þ2 3∕2
• s3is the mean contrast over all frames of the gray level
co-occurrence matrix: EQ-TARGET;temp:intralink-;sec3.2;326;361 s3¼ 1 K X k X x;y Cðx; y; kÞlog½Cðx; y; kÞ;
withCðx; y; kÞrepresenting a count of the number of times that YRðn; m; kÞ ¼x and YRðnþΔn; mþ
Δm; kÞ ¼y in the k’th frame, where ðΔn;ΔmÞ∈ fð0;1Þ;ð−1;1Þ;ð−1;0Þ;ð−1;−1Þg (cf. Randen and Husøy41).
• t1 is the mean total variation over all frames of the
temporal gradient: EQ-TARGET;temp:intralink-;sec3.2;326;233 t1¼ 1 NMK X n;m;k jYRðn; m; kÞ−YRðn; m; k−1Þj
• t2is the maximum across all frames of the total varia-tion of the temporal gradient:
EQ-TARGET;temp:intralink-;sec3.2;326;152 t2¼max k X n;m jYRðn; m; kÞ−YRðn; m; k−1Þj.
After introducing the individual content related indexes used in this work, the best performing linear models are described in the following paragraphs. For the VQAD
(a) (b)
Fig. 3Flowchart of the offline training for the proposed methodology. (a) Offline training of the mapping function parametersai for thei’th training source content using J corrupted sequences of the same source and their difference-mean opinion score (DMOS) values (set DMOSi). (b) Offline identification of the model to estimateAby using content related indexessiandti using I different training source contents.
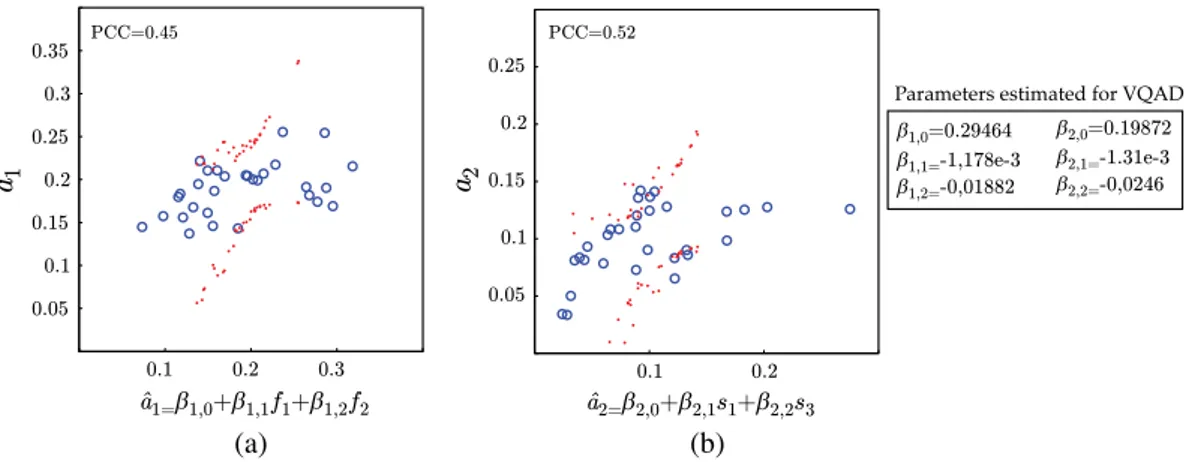
case, none of the tested linear combinations of content related indexes performed well in modeling, the parameters of the mapping functions VQAD →DMOS. For instance, Figs. 4(a)and 4(b) show the plot of the parameters of the mapping functions of VQAD measure (a1 and a2) versus
the estimated parameters using content features (a^1 and
^
a2) where f1¼maxk P
x;yCðx; y; kÞlog½Cðx; y; kÞ and f2
is the mean across the time of the skewness computed on jYRðm; n; kÞ−YRðm; n; k−1Þj. Each circle represents the plot of ai optimized for thei’th source content versus the
parameters estimated using the spatial and temporal content related indexes. The model in the Fig.4is the best perform-ing linear combination. However, this model does not show good relationship between the estimated parameters and the content related indexes. This may be due to the complexity of the VQAD measure which includes two different masking mechanisms (spatial and temporal masking).10 This kind
of implicit content compensation makes it more difficult to identify the relationship between the VQM and DMOS under varying content.
For the remaining VQMs, we have proposed the follow-ing model that can combine spatial and temporal content related indexes for computing the parameters of the mapping functions VQM →DMOS under study.
EQ-TARGET;temp:intralink-;e001;63;280 a≈A½1;s;tT ¼ α1;0 α1;1 α1;2 α1;3 α1;4 α1;5 α2;0 α2;1 α2;2 α2;3 α2;4 α2;5 ½1; s1; s2; s3; t1; t2T; (1)
where αp;q∀ p; q are estimated offline for each VQM as explained in Sec. 3.1. Some of the parameters are set to zero depending on the VQM. For instance, based on exper-imental results, we found that among the content related indexes tested in this paper, the following are good predictors for the parameters of the mapping function PSNR→DMOS:
^
a1¼α1;0þα1;1s1þα1;4t1 and a^2¼α2;0þα2;2s2þα2;3s3
(see Fig. 5). That is, six out of 12 parameters are set to zero reducing the complexity of the model. For SSIM and SOVQM, we have also explored different linear combination of content related indexes and we found that the models in Figs.6and7are the best performing models for the param-eters of the mapping functions SSIM → DMOS and
SOVQM → DMOS, respectively. The dots in Figs. 4–7
are the confidence intervals computed for a^1 and a^2. That
is, it is very likely thata^1 and a^2 lie within the confidence
interval for an incoming test sample. This can be used as an indication of stability of the model. For instance, the model in Fig. 5 is more stable and accurate than the models in Figs. 4, 6, and 7, because the interval that contains the true value for a^ is smaller for PSNR model than for SSIM, SOVQM, and VQAD. That is, the prediction error between a and a^ is smaller in PSNR model than SSIM, SOVQM, and VQAD models. This can be shown as well with the respective PCCs also shown in the plots.
From the confidence intervals, we can conclude that the proposed methodology is going to perform well in PSNR but not in the other tested VQMs. That is, PSNR model is the only one able to predict proper parameters for the mapping function in the tested samples. The other models are expected to perform poorly because they predict parameters with very large errors degrading even the performance of the VQM as the results will show later. The poor stability of VQAD, SSIM, and SOVQM models show a potential disad-vantage of the proposed methodology because it means that there is not a guarantee of finding a relationship VQM → DMOS under varying content for particular measures (at least not with the content related indexes tested in this work). Nevertheless, we will show later in Sec. 5 that the proposed methodology has also major advantages when the VQM is a TPB method such as the PSNR.
4 Experimental Setup
In this section, we first describe the databases used for testing the proposed methodology. Then, we introduce the methodology used for evaluation.
4.1 Test Sequences
The proposed methodology is tested on the following three public video quality databases:
• The IRCCyN IVC 1080i: an HD video quality database29
contains 20 source video sequences of resolution1920×
1080 at 25 frames∕s: (1) above marathon, (2) captain, (3) concert, (4) credits, (5) dance in the woods, (6) duck fly, (7) foot, (8) fountain man, (9) golf,
(a) (b)
Fig. 4Scatterplot of (a)a1in function ofa^1and (b)a2in function ofa^2for VQAD to DMOS mapping functions. The dots are the confidence interval fora^1anda^2. Note that the parameters in the plots were estimated using the databases IRCCyN IVC 1080i and IVP described in Sec.4.1
(10) group disorder, (11) inside marathon, (12) movie, (13) new parkrun, (14) rendezvous, (15) show, (16) stand-ing, (17) Stockholm travel, (18) tree pan, (19) ulriksdals, and (20) voile.
• The IVP Subjective Video Quality Database23contains
10 source video sequences of resolution 1920×1088
at25 frames∕s: (21) bus, (22) laser, (23) overbridge, (24) robot, (25) shelf, (26) square, (27) toys calendar, (28) tractor, (29) train, (30) tube.
• The IRCCyN IVC Influence Content18 contains 60 source video sequences of resolution 960×540 at
25 frames∕s (this database is used only for testing,
(a) (b)
Fig. 5Scatterplot of (a)a1in function ofa^1and (b)a2in function ofa^2for PSNR to DMOS mapping functions. The dots are the confidence interval fora^1anda^2. Note that the parameters in the plots were estimated using the databases IRCCyN IVC 1080i and IVP described in Sec.4.1
(a) (b)
Fig. 6 Scatterplot of (a)a1in function ofa^1and (b)a2in function ofa^2for SSIM to DMOS mapping functions. The dots are the confidence interval fora^1anda^2. Note that the parameters in the plots were estimated using the databases IRCCyN IVC 1080i and IVP described in Sec.4.1
(a) (b)
Fig. 7 Scatterplot of (a)a1in function ofa^1and (b)a2in function ofa^2for SOVQM to DMOS mapping functions. The dots are the confidence interval fora^1anda^2. Note that the parameters in the plots were estimated using the databases IRCCyN IVC 1080i and IVP explained in Sec.4.1
i.e., none of its samples were used during training, inspection and/or selection of the content related
indexes and/or mapping functions): (31) animation 1,
(32) space shuttle, (33) kitesurfing 1, (34) ducks, (35) station, (36) kitesurfing 2, (37) factory 1, (38) skate-boarding 1, (39) crew, (40) intotree, (41) touchdown, (42) kitesurfing 3, (43) aspen, (44) pedestrian area, (45) skateboarding 2, (46) city, (47) night traffic, (48) mother in the woods, (49) skateboarding 3, (50) fire, (51) red kayak, (52) day traffic, (53) dinner 1, (54) west wind easy, (55) rush hour, (56) big buck bunny, (57) kitesurfing 4, (58) RC cars, (59) old town cross, (60) hiking 1, (61) RC, (62) hiking 2, (63) halftime show 1, (64) bee, (65) boxing, (66) teach-ing, (67) halftime show 2, (68) cruise, (69) animation 2, (70) river bed, (71) life, (72) christmas, (73) waterfall, (74) dinner 2, (75) factory 2, (76) dinner 3, (77) tractor, (78) rush field cuts, (79) mobile, (80) excavator, (81) basketball, (82) sitting on the beach, (83) walking on the beach, (84) credits 1, (85) bridge, (86) crowd wave, (87) park joy, (88) crowd run, (89) credits 2, and (90) parade.
• The CIF EPFL-PoliMI Video Quality Assessment Database28contains six source video sequences of
res-olution352×288at30 frames∕s(this database is used only for testing, i.e., none of its samples were used dur-ing traindur-ing, inspection and/or selection of the content related indexes and/or mapping functions): (91) fore-man, (92) hall, (93) mobile, (94) mother, (95) news, and (96) Paris.
• The 4CIF EPFL-PoliMI Video Quality Assessment Database28contains 6 source video sequences of
res-olution 704×576 at 25 frames∕s (this database is used only for testing, i.e., none of its samples were used during training, inspection and/or selection of the content related indexes and/or mapping functions): (97) crowdrun, (98) duckstakeoff, (99) harbour, (100) ice, (101) parkjoy, and (102) soccer.
In these databases, each source sequence was compressed to generate a set of processed sequences using H.264 compression standard18,23,29 Note that the CIF and the
4CIF EPFL-PoliMI Video Quality Assessment Databases28
have videos compressed with H.264 followed by packet loss simulation, i.e., this database allows us to explore the behavior of the proposed methodology under different dis-tortion types. Each processed sequence has its DMOS (we use DMOS because it measures the change in quality between two versions of the same stimulus with minimal impact on estimating model performance43) value obtained through subjective experiments. Figure8shows the scatter-plot of SA and TA for the used databases. SA and TA are the mean value of the magnitude of the SI13 image and the mean total variation over all frames of the temporal gradient (cf.s1
andt1 in Sec.3.2), respectively. The scatterplot shows that
the variety of spatial and temporal activity levels in the video test sequences is high, i.e., a wide range of extent of image details and motion. The plot together with previous database descriptions show that a wide range of video content is used. They range from very low motion (news) to very high motion (sports) and from low textured (cartoons) to high textured (natural scenes) sequences.
4.2 Evaluation Methodology
For comparing the performance between quality measures, we use cross validation with a repeated random subsampling procedure using 100 iterations as discussed by Witten et al.44 At every iteration, the total number of 30 source contents on IRCCyN and IVP databases is randomly split into two mutu-ally exclusive sets, termed training and validation sets. The coefficients of the matrixAare estimated with the training set (18 sequences) and the accuracy is assessed by using the val-idation set (12 sequences). To further validate the results of the proposed methodology, we use three more video quality databases as testing sets. That is, we use in this work a training, validation (IRCCyN and IVP databases during cross-validation), and test set (IRCCyN IVC Influence Content database, CIF and 4CIF EPFL-PoliMI video quality assessment database during the testing) to measure the per-formance of the proposed methodology.
The performance is estimated by comparing the predicted quality with the human scores (DMOS), i.e., various indices are evaluated between DMOS and pDMOS. A common and well accepted way involves the evaluation of three aspects: prediction accuracy, prediction monotonicity, and prediction consistency.6 Prediction accuracy refers to the ability of
Fig. 8 Scatterplot of SA and TA computed on all databases. SA and TA are the mean value of the magnitude of the SI13 image and the mean total variation over all frames of the temporal gradient (cf.s1andt1in Sec.3.2). Labels indicate the source sequence.
predicting the subjective quality score with low error. This aspect is measured by using the Pearson correlation coefficient (PCC). Prediction monotonicity is the degree to which predic-tions of the model agree with the magnitudes of subjective quality scores. This aspect is measured with the Spearman rank-order correlation coefficient (SROCC). Prediction con-sistency is the degree to which the model maintains prediction accuracy over a range of different video test sequences and can be measured by using the root mean-squared error (RMSE). Finally, we use the mean absolute error (MAE) as an alterna-tive method with the purpose of measuring the expected error of a new sample, i.e., the expected difference between the pDMOS and DMOS.
5 Results and Discussion
We start this section by presenting and discussing the results of the experiments described in Sec.4. After that, in Sec.5.2, we introduce a methodology for selecting the distorted vid-eos for a subjective test of video quality such that their perceived quality is uniformly distributed over the whole quality range (e.g., measured DMOS values uniformly sample the range of 1 to 100).
5.1 Evaluation of the Proposed Video Quality Assessment
We add the prefix letter C (standing for content-aware) to every VQM acronym with the purpose of differentiating
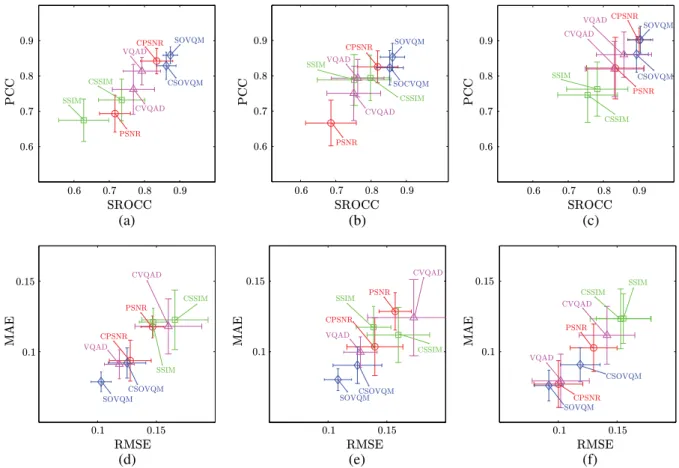
between the performance of the original VQM and the same measure using our proposed methodology, e.g., PSNR is the original VQM and CPSNR is the quality pre-diction by using the VQM and the proposed methodology. Figure9shows the performance of the considered VQMs discussed in Sec.3.2. Databases IRCCyN, IVP as well as the methodology explained in Sec.4.2are used for appraising these indices. Note that the performance for PSNR, SSIM, SOVQM, and VQAD were computed after fitting the selected mapping function without using any content infor-mation, i.e.,αi;j¼0fori¼1, 2 andj¼1; : : : ;5. The par-tition is made such that the training phase has always four source contents from IVP database and eight cases from IRCCyN database with the purpose of producing more gen-eralizable results. Scatterplots (a), (b), and (c) in Fig.9show the PCC and the SROCC as well as their confidence intervals computed for the considered sets of the test sequences, where the value of 1 indicates high correlation and 0 is no corre-lation between the tested quality measure and the DMOS. In the scatterplots, the closer the data points to the top right cor-ner the better the VQM performance. For instance, the best performing methods according to the plots are SOVQM fol-lowed by CPSNR (PSNR using the proposed methodology), CSOVQM and VQAD. Noteworthy is that the performance of PSNR increases from 0.68 to 0.80, i.e., about 17% (30% in linear Fisher’sZ) [To compare PCC in a linear scale, we have opted to use the Fisher’s Z transform defined as: z0¼0.5ðlogð1þPCCÞ−logð1−PCCÞÞ] by the proposed
(a) (b) (c)
(d) (e) (f)
Fig. 9 Performance of the considered video quality measures appraised on IRCCyN and IVP databases. The proposed methodology is named CPSNR, CSSIM, CSOVQM, and CVQAD (we add the prefix letter C to every VQM acronym). Scatterplots of Pearson correlation coefficient (PCC) and Spearman rank-order correlation coefficient (SROCC) for (a) all data, (b) IRCCyN, and (c) IVP. Scatterplots of MAE and RMSE for (d) all data, (e) IRCCyN, and (f) IVP.
methodology, confirming the power of the proposed approach in TPB methods [percentage increase was com-puted as 100× (performance CPSNR − performance PSNR)/performance PSNR]. That is, there is an increase in both monotonicity and magnitude of agreement between subjective scores and the scores predicted by using CPSNR. There is an increase from 0.67 to 0.72 in the correlation between DMOS and CSSIM compared with SSIM, i.e., about 7% (12% in linear Fisher’s Z). Even though the model in Fig.6(b)does not accurately predict thea2
param-eter, the proposed methodology is still able to increase the performance. This increase is due to the fact that changes in the x-axis bias are more significant than those due to the rate of change because changes in thex-axis bias nor-mally result in larger errors. Since the model to estimate the x-axis bias [Fig. 6(a)] fits the parameter better, it is able to compensate for those large errors increasing the per-formance of the metric. However, this increase is not signifi-cant compared with the performance of the other tested VQMs.
Figures9(d)–9(f)show the scatterplot of RMSE and MAE computed for the considered test sequences where the value of 0 means no difference between the tested quality measures and the DMOS. Here, the closer the data points to the bottom left corner the better the VQM performance. For instance, the best performing methods according to the plots are SOVQM followed by VQAD and CPSNR. Comparing the MAE of the best performing measure using the proposed methodology (CPSNR) and the other considered quality measures, we found that the proposed methodology is competitive with SOVQM as well as VQAD. The MAE between DMOS and the pDOMS obtained using CPSNR, SOVQM as well as for VQAD is lower than 0.1. For instance, the predicted DMOS computed with one of those quality measures is expected to be deviated 10 from its real value in a DMOS scale from zero to hundred. That is, we can perform as well as the state-of-the-art methods to predict quality of corrupted sequences by using a very simple measure.
As expected, SOVQM and VQAD metrics decrease their performance because the estimated model is not good enough for modeling the relationship VQM → DMOS under varying content (cf. confidence intervals Figs.4 and
7). The decrease in performance of CSOVQM and CVQAD with respect to their noncontent-aware counterparts is mainly due to the poor generalization power of the selected models for these measures. For instance, by exploring the PCC in the training phase, we have PCC¼0.85 for the SOVQM and PCC¼0.86 for the CSOVQM. That is, there is an increase on performance by using content infor-mation in the training samples. However, in the testing phase we havePCC¼0.85for the SOVQM andPCC¼0.82for the CSOVQM. This shows that there is an increase in per-formance by adding degrees of freedom (from two parame-ters for SOVQM to six for CSOVQM) to the fitting function (training results) but it also suggests a poor generalization power of the model due to the implicit content compensation (testing results). For instance, the results on CSOVQM and CVQAD show that it is difficult to find a model for predict-ing the parameters of the mapppredict-ing function to compensate for content information. This is mainly because those metrics compensate implicitly some of the effects of the video content information. Such compensation increases
the complexity of the relationship VQM →DMOS under varying content, thereby also increasing the complexity of the modeling procedure. (Since those metrics operate on fea-tures instead of pixel values, we attribute the complexity increment to the content related indexes used in this work because they are computed in pixel values and may not be the best suited for capturing the relationship VQM → DMOS under varying content. That is, the content related indexes used in this work do not represent the most relevant information in the feature space where the metrics operate.) For example, in SSIM the similarities between the set of neighbor pixels in the reference and corrupted sequences are computed as normalized dot products of local neighbor statistics. In this case, structural information is used for nor-malization which also compensates locally for content infor-mation. In SOVQM, there is a set of statistics computed over set of neighbor pixels in both sequences (reference and cor-rupted). Those statistics are later individually thresholded and compared before the pooling strategy. (In objective video quality assessment, the thresholding process, termed masking, is used to predict whether or not a signal is detect-able by a human subject under certain SA and/or TA condi-tions.45) That is, SOVQM is doing an indirect compensation of local content information. In VQAD, the obtained errors are thresholded by using information of neighbor pixels before the pooling strategy. This masking strategy results in an implicit compensation for local content information.
In summary, for PSNR it is easy to find its relationship with DMOS under varying content but it is more difficult to find such relationship for the other VQMs. The results suggest that TPB methods are more suitable for the proposed methodology than for the other tested VQMs. Since the IRCCyN and IVP databases were used during the content related indexes selection, we use another three sets of data to validate our methodology with the purpose of avoiding cross-validation errors. In particular, we use the IRCCyN IVC Influence Content database18 as well as the
CIF and 4CIF EPFL-PoliMI Video Quality Assessment Databases.28 Note that these databases were not used in the entire process of model training, content related indexes and/or mapping functions selection, i.e., we use in this work a training, validation, and test sets to measure the perfor-mance of the proposed methodology. Additionally, these databases have different spatial resolution and distortion types. That is, we can test the proposed methodology under other types of scenarios with the purpose of showing its generalization power.
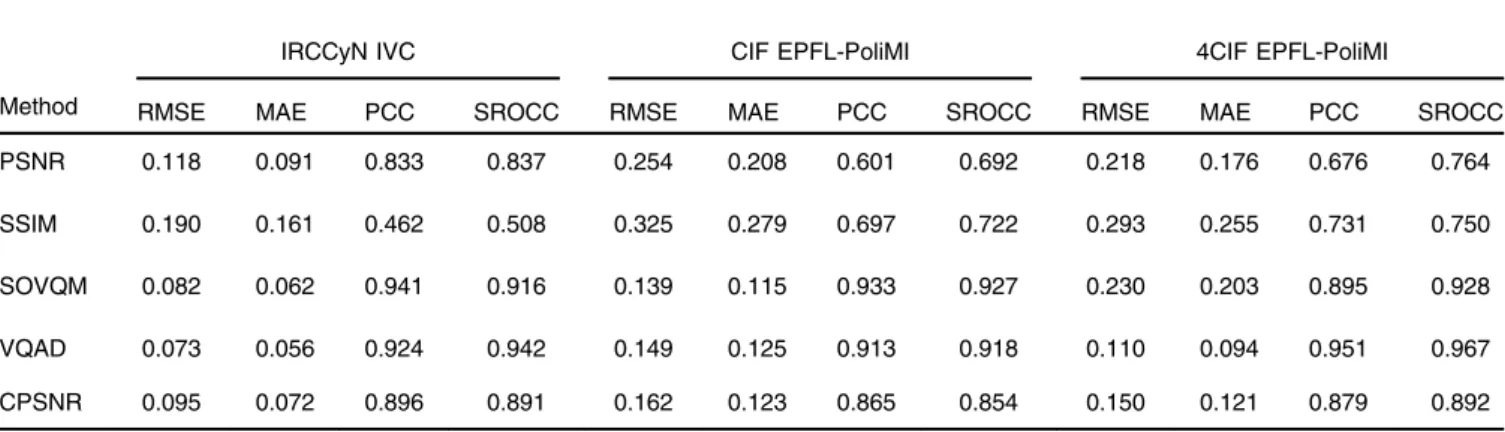
Since we have shown that the proposed methodology has major advantages in TPB methods, we further validate only the proposed methodology in PSNR and we compare with the other tested VQMs. That is, we compare between the following methods PSNR, SSIM, SOVQM, VQAD, and CPSNR on the IRCCyN IVC Influence Content database18 as well as on the CIF and 4CIF EPFL-PoliMI Video Quality Assessment Databases.28The performance appraised on the IRCCyN IVC Influence Content database is high for most of the tested VQMs except the SSIM (cf. Table1). This can be due to the fact that SSIM is computed frame by frame and the global quality measure is given by the average over all frames which can lead to big estimation errors because it is well known that the average is highly affected by the dis-tribution of the data which may not take into account the
PVQ distribution across time.46We attribute the good perfor-mance of the other quality measures (even PSNR with PCC equal to 0.833) to the fact that the motion distribution of the sequences is not very diverse. In fact, most of the sequences are located within a small interval of TA (TA lower than 15, cf. Fig. 8) compared with the other databases. This makes computing the predicted quality measures easier because the more similar the content related indexes between the sequences the more similar the parameters of the mapping function. That is, only one mapping function would be nec-essary to fit the data points. However, by using the proposed methodology (the same model as estimated using IRCCyN and IVP databases, cf. Sec.3.2), we can still achieve higher performance than PSNR with a percentage of increase of 7.5% (21% in linear Fisher’s Z) in PCC as well as in SROCC and a percentage of decrease of 20% in RMSE as well as in MAE. That is, the proposed methodology keeps to monotonicity between PSNR and PVQ but it decreases considerably the prediction errors of PVQ, i.e., pDMOS is more similar to DMOS.
We can draw a similar conclusion by exploring the results on the CIF and 4CIF EPFL-PoliMI databases (cf. Table1). PSNR and SSIM are still the worst performing quality mea-sures because their results are highly variable from database to database, i.e., there is little generalization power on these two VQMs. We also found a percentage of increase between PSNR and CPSNR higher than 16% (42% in linear Fisher’s Z) in PCC as well as in SROCC and a percentage of decrease higher than 30% in RMSE as well as in MAE. These results agree with the results shown in Fig. 9. Furthermore, since these databases (IRCCyN IVC Influence Content, CIF and 4CIF EPFL-PoliMI) possess different spatial as well as tem-poral resolution and distortion type compared with the IRCCyN and IVP databases, we can see that the proposed methodology and the parameters obtained during the training phase work under different scenarios, i.e., the proposed methodology can be used over different range of spatial and temporal resolution as well as distortions types. However, the distortion type factor requires further study because in the CIF and 4CIF EPFL-PoliMI databases only a simulation of packet loss over the sequences compressed using H.264 codec is added. That is, there is a strong rela-tionship between the two types of distortion making the mapping functions equivalent. Therefore, more research is
necessary to determine if there will be differences between the mapping functions under different distortions types.
Even though the proposed methodology does not have the highest performance among the tested methods, in Ref.26it has been shown that CPSNR is only two times slower than PSNR, i.e., the computational time used for the content related indexes is comparable with the computational time used for PSNR. Thus, the proposed methodology has lower computational complexity compared to SOVQM, VQAD, and other more sophisticated methods such as MOVIE,9 wTQM,11 wSSIM,8 among others (cf. Li et al.,10
Ortiz-Jaramillo et al.,11and Ortiz-Jaramillo et al.26). This is a major computational advantage because the methodology is based on very simple operations and it can be easily embedded in a system design process. The computational advantage is mainly due to the fact that simple content related indexes are used to characterize the content of the video sequence instead of computing more complex features in local blocks (SSIM and SOVQM) or trying to mimic the human visual system (MOVIE, wTQM, and wSSIM) which in general is computationally more complex.10,11,26That is, the results suggest that the proposed methodology, while faster and sim-pler, is competitive with current state-of-the-art methods.
5.2 Selecting Test Sequences for Subjective Experiments
When designing a subjective study for video quality assess-ment, preparation of corrupted video sequences (test stimuli) to be rated by human subjects is a challenging task because they affect the usefulness of the collected human data. This usefulness is reflected by whether or not the resulting DMOS scores are uniformly distributed over its entire range, which depends completely on the selected acquisition, processing and technical parameters.47It is known that such parameters (e.g., noise, blur, compression level, compression rate, PSNR value, among others) are often nonlinearly related to PVQ and the model of the relationship may be unknown a priori. Figure10shows plots of DMOS in function of PSNR for different cases of source content, taken from IRCCyN and CIF EPFL-PoliMI databases. These examples illustrate the drawbacks of current selection of distortion levels for sub-jective studies, which are mainly due to the lack of standard procedures for this selection. For instance, Fig.10(a)shows an example of subjective quality scores distributed over the
Table 1 Performance of considered video quality metrics appraised on IRCCyN IVC Influence Content as well as CIF and 4CIF EPFL-PoliMI Video Quality Assessment Database.
Method
IRCCyN IVC CIF EPFL-PoliMI 4CIF EPFL-PoliMI
RMSE MAE PCC SROCC RMSE MAE PCC SROCC RMSE MAE PCC SROCC
PSNR 0.118 0.091 0.833 0.837 0.254 0.208 0.601 0.692 0.218 0.176 0.676 0.764
SSIM 0.190 0.161 0.462 0.508 0.325 0.279 0.697 0.722 0.293 0.255 0.731 0.750
SOVQM 0.082 0.062 0.941 0.916 0.139 0.115 0.933 0.927 0.230 0.203 0.895 0.928
VQAD 0.073 0.056 0.924 0.942 0.149 0.125 0.913 0.918 0.110 0.094 0.951 0.967
(quasi) linear range of the relationship DMOS-PSNR. Note that this is not yet an optimal selection of test sequences, because there are corrupted sequences with almost the same DMOS and it would be more desirable to have DMOS values in the saturation range as well20,47(e.g.,DMOS>0.9).
On the other hand, in Figs.10(b)and10(c)quality levels are almost exclusively located in the low saturation range.
To address the problem of adequate parameter selection for the test stimuli, Kumcu et al.47have proposed a method for modeling the relationship between parameter levels and PVQ using a paired comparison procedure in which subjects judge the perceived similarity in quality.47Their results indi-cate that the obtained subjective scores were roughly well distributed over its entire range. Nevertheless, that method-ology requires a small subjective pre-study (pilot study) for modeling the relationship between parameter levels and PVQ. This can be a disadvantage because, although it is a small experiment, it is still time consuming and highly sub-jective for the initial selection of the distortion levels. Instead, we propose to use CPSNR for the selection of the distortion levels. In the following paragraphs we give a detailed description of our proposed method by using some test samples and PSNR as technical measure.
For a given source sequence, it is possible to select a roughly uniformly sampled DMOS domain by applying the following steps: (1) compute s and t, (2) compute
^
a¼A½1;s;tT, (3) divide the DMOS axis equally using
the desired step size, and (4) use the estimated parameters
^
aas well as the divided DMOS axis to obtain its correspond-ing PSNR values, i.e., the appropriate set of distortion levels. Thereafter, distorted sequences are generated to correspond to these PSNR values.
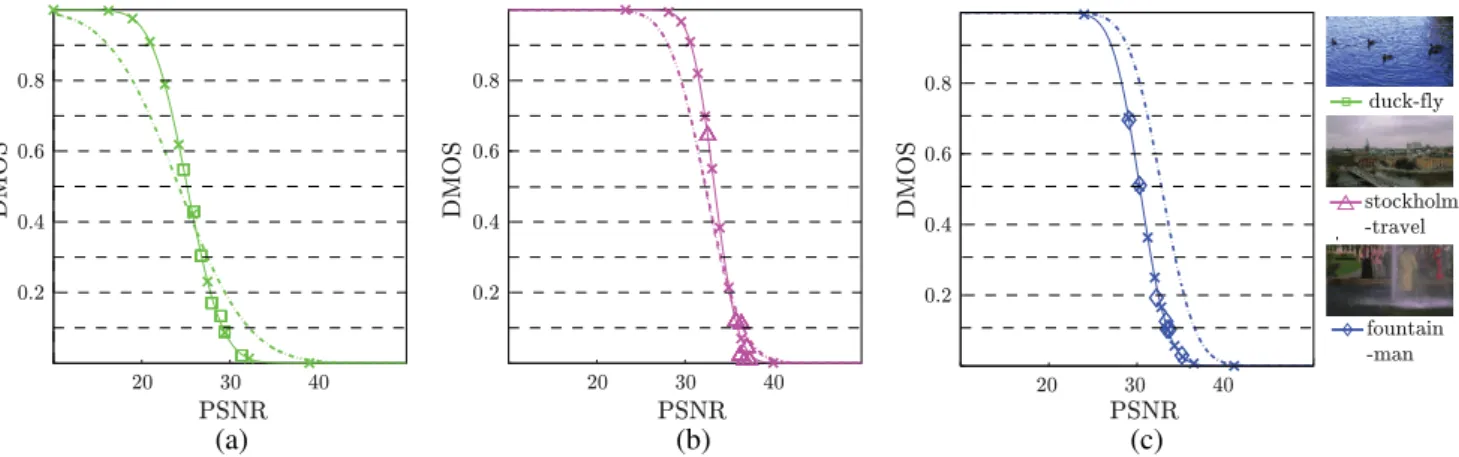
To illustrate the method, we use three source video sequences taken from the IRCCyN database together with their distorted versions. Figure 11 shows examples of DMOS in function of PSNR for the different reference source content (a) duck-fly, (b) Stockholm-travel, (c) foun-tain-man sequences. The markers (squares, triangles, and diamonds) are the scatterplots of DMOS scores from the IRCCyN database and the corresponding PSNR values com-puted between the source (reference) and the distorted sequences. The solid lines represent curves with the best fit to the data points, i.e., the ‘true’model between PSNR→
DMOS (we call it‘true’model because the mapping function was specifically tuned to the source content using the DMOS obtained through subjective evaluation). The dotted lines represent curves estimated by using the proposed methodol-ogy, i.e., we use the parameters shown in Fig. 5 and the content related indexes extracted from the example sequen-ces to compute the parameters of the mapping function PSNR → DMOS. To obtain a roughly equally sampled DMOS space, we divide the DMOS axis equally in steps of 0.1 (see horizontal dashed lines in Fig. 11). Then, we use the curves represented by the dotted lines to obtain the preferred PSNR values that should be obtained between a distorted sequence and the given reference sequence. Afterward, these PSNR values are projected back to the DMOS axis by using the ‘true’ model PSNR → DMOS (crosses in Fig.11).
Figures 11(a) and 11(b) show two examples where the proposed methodology was able to recommend PSNR values that divide the DMOS domain roughly equally as it is desir-able.20,47Figure11(c)shows an example in which the
pro-posed methodology does not divide the DMOS domain equally, i.e., the points are not equally distributed over the whole perceived quality range. In any case, the plots show that the selected values using the proposed methodology (crosses) are more uniformly distributed in the DMOS axis than the ones selected in the original database (squares, triangles, and diamonds).
To illustrate the potential of this methodology, we use the experimental CPSNR data shown in Table1MAE columns, i.e., the MAE value achieved by using each one of the tested VQMs on the IRCCyN IVC Influence Content as well as the CIF and 4CIF EPFL-PoliMI databases. Even though the MAE is estimated by using the model parameters trained with IRCCyN and IVP databases, the CPSNR has MAE value of 0.072 when the distortion type is the same as in the training phase (IRCCyN IVC Influence Content) and 0.12 when the distortion type is different (CIF and 4CIF EPFL-PoliMI). This suggests that the expected error between the obtained DMOS using the recommended PSNR and the DMOS that is going to be obtained through the subjective evaluation is7.2(distortion type is the same as the training) and 12 (distortion type is different from the training). These examples are given in a 0 to 100 DMOS range.
(a) (b) (c)
Fig. 10DMOS in function of PSNR. Each marker symbol represents a different reference source content (a) hall,28(b) concert,29(c) Stockholm-travel.29The solid lines represent curves with the best fit to the data. (a) Examples of well distributed subjective quality scores, (b) and (c) examples of subjective quality scores distributed over small perceived quality region.
Although the proposed methodology does not have the lowest MAE among the considered VQMs, for all the other tested VQMs, there is no information about the obtained DMOS. Therefore, the proposed methodology is more desirable for selecting the levels of video distortion because there is a direct relationship PSNR→DMOS which is easier to interpret compared with the values given by the other tested VQMs which are in arbitrary units of measure. In addition, since many computer vision systems rely on PSNR for parameter tuning, it will be easy to incorporate the proposed methodology to such systems.15
6 Conclusions and Future Work
We proposed a methodology to advance existing VQMs by introducing content related indexes in their computation. The proposed methodology is based on observations made from the changes of VQMs in function of DMOS under varying content. In this work PSNR, SSIM, SOVQM, as well as VQAD and statistics of images filtered with SI13 filter, temporal gradients as well as spatial dependencies of pixel values were used as VQMs and content related indexes, respectively, with the purpose of illustrating the potential of the proposed methodology. In particular, our methodology involves the offline training of the parameters of the comple-mentary error function. We have found that the linear combinations of SA and TA are good predictors of such parameters. However, we have found that when the VQM includes some mechanism of content compensation, it is more difficult to model the changes in predicted quality. For instance, VQM and VQAD still have changes in predicted quality under varying content but it was not possible to improve its performance using the explored content related features.
The results show that our methodology is effective and performs well over multiple types of video content, types of distortion, spatial and temporal resolutions. Experiments over five different public video quality databases demon-strate that the proposed methodology is competitive with current state-of-the-art methods. Also, since the proposed methodology is based on a simple operation, it has shown to be faster and simpler than current state-of-the-art methods.
Additionally, the proposed methodology has been shown to be generic enough for including different nonlinear func-tions, video quality measures, and/or video content related indexes. This can be a disadvantage as well because there is no guarantee of finding a model for every VQM. That is, such models are difficult to find due to the implicit content compensation of the VQM. In any case, the methodology can always be used on TPB methods which have shown to be more suitable for the proposed methodology. Also, CPSNR has shown to be of particular interest because it is possible to estimate PSNR → DMOS curves that can be used to preselect the levels of video distortion in the preparation of subjective studies. Moreover, since up to the present time, many computer vision systems rely on PSNR to perform quality measurement, it will be easier to incorporate the proposed methodology to such systems.
Another contribution of this work is the evaluation of four of the most well-known state-of-the-art VQMs (PSNR, SSIM, SOVQM, and VQAD) on five different public video quality databases. This is a big contribution because even though these VQMs are the most well known and widely used, the VQMs are often tested on databases exhibiting little content differences, few testing samples and/or they are not publicly available. In this work, we have solved those issues by including databases with more testing samples than other work currently presented in the state of the art (696 distorted sequences from 102 source sequences under different tem-poral and spatial resolutions). That is, since the best perform-ing VQMs in the state of the art are evaluated in a wide range of test sequences, the results presented in this work can be used as a reference when evaluating newly developed VQMs.
The main drawback of the proposed methodology is that an offline training with enough samples representing the wide range of quality levels, extent of details, and motion is needed. This issue is currently difficult to address due to the lack of public databases fulfilling such requirements. However, the proposed methodology is intended to help with this issue by proposing a method for the objective selection of test sequences. But, this methodology was only tested using public databases that have already been subjectively
(a) (b) (c)
Fig. 11DMOS in function of PSNR. Each marker symbol represents a different reference source content (a) duck-fly, (b) Stockholm-travel, (c) fountain-man sequences.29The solid lines represent curves with the best fit to the data. The dotted lines represent curves estimated by using the proposed methodology. The crosses are projections of PSNR values selected by using the estimated curve on to the mapping function specifically tuned to the source content. Horizontal dashed lines divide the DMOS axis equally in steps of 0.1.