CAN WE BE TRAINED TO EAT HEALTHY?
THE EFFECTS OF AN ATTENTIONAL BIAS MODIFICATION PROGRAM ON EATING BEHAVIOR
A DISSERTATION IN Psychology
Presented to the Faculty of the University of Missouri-Kansas City in partial fulfillment of
the requirements for the degree
DOCTOR OF PHILOSOPHY
by
ASHLEIGH ANNE PONA B.S., John Carroll University, 2013 M.A., University of Missouri-Kansas City, 2015
Kansas City, Missouri 2018
© 2018
ASHLEIGH ANNE PONA ALL RIGHTS RESERVED
CAN WE BE TRAINED TO EAT HEALTHY?
THE EFFECTS OF AN ATTENTIONAL BIAS MODIFICATION PROGRAM ON EATING BEHAVIOR
Ashleigh Anne Pona, Candidate for the Doctor of Philosophy Degree University of Missouri-Kansas City, 2018
ABSTRACT
The prevalence of overweight (OW) and obesity (OB) has significantly increased over the past four decades. OW and OB are complex in nature and arise from a multitude of factors and their interactive effects. Based on etiological models of OW and OB, interventions to reduce excess body weight have been developed, including population- and individual-level approaches. Current interventions are limited, however, in that they lack focus on how environmental factors (e.g., food cues) interact with biology (e.g., neural reward systems) to influence individual health-related behaviors (e.g., food
consumption) through mechanisms such as attentional bias. Attentional bias modification (ABM) programs have been developed to train individuals to either attend to or avoid certain food cues in the environment, yet research in this area is underdeveloped. The purpose of this dissertation was to evaluate the effect of a single-session ABM training designed to promote healthy eating on eating behavior as a potential intervention that targets an individual’s response to the obesogenic environment. This dissertation
addressed the limitations of previous ABM studies in that it examined differential effects of the program on attention to food cues and eating behavior among individuals with varying body mass indices (i.e., healthy weight vs. OW/OB).
iv
APPROVAL PAGE
The faculty listed below, appointed by the Dean of the College of Arts and Sciences, have examined a dissertation titled “Can We Be Trained to Eat Healthy? The Effects of an Attentional Bias Modification Program on Eating Behavior,” presented by Ashleigh A. Pona, candidate for the Doctor of Philosophy degree, and certify that in their opinion it is worthy of acceptance.
Supervisory Committee
Jennifer D. Lundgren, Ph.D., Committee Chair Department of Psychology Seung-Lark Lim, Ph.D. Department of Psychology Diane L. Filion, Ph.D. Department of Psychology Oh-Ryeong Ha, Ph.D. Department of Psychology Meredith L. Dreyer Gillette, Ph.D. Developmental and Behavioral Sciences
CONTENTS ABSTRACT ... iii LIST OF ILLUSTRATIONS ... ix LIST OF TABLES ...x ACKNOWLEDGMENTS ... xi Chapter 1. INTRODUCTION ...1
Definition of Overweight and Obesity ...1
Morbidity and Mortality of OW and OB ...1
Prevalence and Prevalence Trends of OW and OB ...2
Factors Contributing to the Development of OW and OB ...3
Genetic and Hormonal Factors ...3
Obesogenic Environment ...6
Other Individual Factors ...7
Summary ...9
2. REVIEW OF THE LITERATURE ...11
Status of Non-Biological OW/OB Treatment Outcome Research ...11
Population-Level Interventions for OW and OB ...11
Individual-Level Interventions for OW and OB ...15
Limitations of Current Non-Biological Interventions for OW and OB ...17
Food Cue Exposure and Attentional Bias ...19
vi
Studies on Attentional Bias to Food Cues ...24
Comparing BMI categories with the dot probe task ...24
Comparing BMI categories with the Stroop task ...25
Predicting change in BMI with attentional bias measures .26 Other factors that may influence attention to food cues ....27
Summary of studies on attentional bias to food cues ...28
Attentional Bias and Consumption Behavior ...31
Attentional Bias Modification for Unhealthy Food Cues ...32
Limitations of Studies on ABM for Unhealthy Food Cues ...36
Summary ...36
Dissertation Aims...38
3. METHODOLOGY ...42
Participants ...42
Recruitment and Screening Procedures ...42
Screening Measures ...43
Demographics questionnaire ...43
Eating questionnaire...43
SCOFF eating disorder screener ...43
Pre-Experiment Procedures ...44
Pre-Experiment Measures ...45
Demographics questionnaire ...45
Three-Factor Eating Questionnaire ...45
Stimuli ...46
Visual Dot Probe Task Procedure ...47
Pretest ...47
Training ...48
Posttest ...49
Measurement of Attentional Bias ...49
Post-Experiment Procedures ...49
Laboratory-Based Taste Test ...49
Measurement of consumption ...50
Height and Weight ...51
Debriefing ...51
Statistical Analysis ...51
Power Analysis ...53
4. RESULTS ...57
Demographics and Baseline Measurements ...57
Demographics ...57
Baseline Measurements ...58
TFEQ...58
Hunger level ...60
Food ratings ...61
Pre-training attentional bias scores ...61
viii
Aims and Hypotheses Results ...64
Specific Aim 1 ...64
Sub-Aim 1.1 ...70
Specific Aim 2 ...72
Sub-Aim 2.1 ...74
5. DISCUSSION ...77
Summary of Aims and Overall Findings ...77
Discussion of Baseline Attentional Bias Findings ...78
Discussion of ABM Training on Attentional Bias Findings ...80
Discussion of ABM Training on Eating Behavior Findings ...85
Conceptual Implications ...88
Clinical Implications ...89
Future Directions and Limitations ...90
Summary ...92
Appendix A. SCREENING QUESTIONNAIRE ...93
B. STUDY INFORMATION SHEET/CONSENT FORM ...95
C. DEMOGRAPHICS QUESTIONNAIRE ...98
D. THREE-FACTOR EATING QUESTIONNAIRE ...99
E. FOOD RATING SCALE ...103
REFERENCES ...105
ILLUSTRATIONS
Figure Page
1. Visual illustration of stimulus words presented during the Stroop task ...21 2. Visual illustration of stimulus pictures presented during the dot probe task ....23
x TABLES
Table Page
1. Studies on individual differences in attentional bias to food cues ... 29 2. Studies on attentional bias modification for food cues ...55 3. Participant demographics and baseline measurements ...59 4. Attentional bias scores by training condition, with F-test values for training
condition × time interaction effect ...65 5. Reaction times (ms) to healthy and unhealthy food pictures at pre-training and
post-training, depicted by training group ...68 6. Attentional bias scores by training condition within HW and OW/OB BMI
groups, with F-test values for training condition × time interaction effect ...71 7. Amount of calories consumed from healthy snack food and unhealthy snack
food by training condition, with F-test values for main effect of training
condition ...73 8. Amount of calories consumed from healthy snack food and unhealthy snack
food by training condition within HW and OW/OB BMI groups, with F-test values for main effect of training condition ...76
ACKNOWLEDGMENTS
From the bottom of my heart, I would like to express my deepest gratitude to those who have supported and encouraged me throughout the process of obtaining my Ph.D. in clinical psychology. To my incredible committee chair and research mentor: Dr. Jenny Lundgren. To the rest of my enlightening committee members: Drs. Lark Lim, Diane Filion, Oh Ha, and Meredith Dreyer-Gillette. To my dedicated research assistants: Bri Ely, Kari Clark, and Jenny Tran. To my generous dissertation funding sources: UMKC School of Graduate Studies and UMKC Women’s Council. To a few of my most influential supervisors throughout my training: Drs. Denise Ben-Porath, Julie Rish, Ravi Sabapathy, Stephanie Cox, and Cassie Brode. To my wonderful, unconditionally
supportive, beloved family and friends, especially my Mom and Dad. Thank you all for the special, significant roles you have played in my life and in my process of becoming a clinical psychologist.
CHAPTER 1 INTRODUCTION
Definition of Overweight and Obesity
Overweight (OW) and obesity (OB) are characterized by an excess of adipose tissue. OW is defined as a body mass index (BMI) of 25 to 29.9 kg/m2 and OB as a BMI of greater than or equal to 30 kg/m2 (National Institutes of Health, 1998). Degree of OB can further be broken down into three classes: class I OB is defined as a BMI of 30 to 34.9 kg/m2, class II OB as a BMI of 35 to 39.9 kg/m2, and class III OB as a BMI of greater than or equal to 40 kg/m2 (National Institutes of Health, 1998).
Morbidity and Mortality of OW and OB
OW and OB are associated with numerous health risks and are among the most significant contributors to poor health (Kopelman, 2007). For example, increasing BMI raises the risk of morbidity from health conditions including hypertension (Re, 2009), type 2 diabetes (Eckel et al., 2011), coronary artery disease (Eckel & Krauss, 1998), stroke (Guh et al., 2009), metabolic syndrome (Ginsberg & MacCallum, 2009), liver and gall bladder disease (Stinton & Shaffer, 2012), and cancer (Hursting, Nunez, Varticovski, & Vinson, 2007). Weight-related health comorbidities can also reduce the life expectancy of a person who is OW or OB, and these hazard rates can differ based on BMI category, age, sex, race, and tobacco use (Finkelstein, Brown, Wrage, Allaire, & Hoerger, 2009). For example, Finkelstein and colleagues (2009) reported the years of life lost among 18-year-olds in class II OB to range from 1 (for black females who never smoked) to 5 (for white females who currently smoke), and among 18-year-olds in class III OB to range from 5 (for black females who never smoked) to 12 (for white males who currently
smoke). Weight-related health comorbidities that have been associated with premature deaths include heart disease, cancer, and type 2 diabetes (Finkelstein et al., 2009; Kitahara et al., 2014).
Prevalence and Prevalence Trends of OW and OB
The prevalence of OW and OB is also extremely high across stages of the lifespan, and tends to increase with age. Data from the National Health and Nutrition Examination Survey in 2011-2014 indicated that OB occurs among 8.9% of children aged 2-5 years, 17.5% of children aged 6-11 years, 20.5% of adolescents aged 12-19 years, and 36.3% of adults aged 20 years and older in the United States (US) (Ogden, Carroll, Fryar, & Flegal, 2015). Temporal trends have also been identified with regard to changes in OW and OB rates in the US. Between the years of 1960 and 1980, there was very little change in OB prevalence; however, significant changes started to appear after 1980. Flegal and colleagues (Flegal, Kuczmarski, & Johnson, 1998) reported increases in prevalence rates for all BMI categories between the years of 1980 and 1994, which included increases of 31.7% to 32.6% for OW, 10.2% to 14.4% for class I OB, 3.2% to 5.1% for class II OB, and 1.3% to 2.8% for class III OB. Kucsmarski and colleagues (Kuczmarski, Flegal, Campbell, & Johnson, 1994) also reported a significant increase in OW and OB among adult men and women between 1980 and 1994, which increased from 25.4% to 33.3%. Between 2000 and 2005, these trends continued to increase for men, but not for women (Flegal, Kruszon-Moran, Carroll, Fryar, & Ogden, 2016). Between 2005 and present, however, there have been significant linear increases in overall OB and class III OB for women, but no significant trends have been identified for men (Flegal et al., 2016).
Collectively, these findings show that there have been significant increases in OW and OB over the past four decades. Although further research is warranted to determine the exact reasons for these trends, we do know that there have been no documented biological population changes to account for the increase in OW and OB prevalence. As such, the environment and its interactive effects have been considered as a contributing factor that may be related to the temporal rise in OW and OB. Notwithstanding, given the numerous health risks associated with these conditions, targeting their increasing
prevalence rates has become a public health priority (US Department of Health and Human Services, 2010). In order to work towards the prevention and treatment of OW and OB, it is important to understand what factors contribute to the development of these conditions.
Factors Contributing to the Development of OW and OB
On a fundamental level, the cause of OW and OB is linked to an imbalance of energy intake vs. energy expenditure. In other words, when a person takes in more calories than they lose via metabolic and physical activity, they are likely to gain weight (Wright & Aronne, 2012). It is now evident, however, that OW and OB are more
complex in nature and arise from a multitude of factors and their interactive effects (US Department of Agriculture and US Department of Health and Human Services, 2010). Potential contributing factors in the development and maintenance of OW and OB are reviewed below.
Genetic and Hormonal Factors
Research on the behavioral genetics of OW and OB has examined the heritability of BMI through twin, adoption, and family studies. The behavioral genetic basis of OW
and OB does not only apply to the heritability of body weight, but also to a number of genetically determined behaviors that can affect body weight, including ingestion, absorption, metabolism, and energy expenditure (Hinney, Vogel, & Hebebrand, 2010). Studies have shown that OW and OB run in families and are better determined by genetic vs. environmental factors (Maes, Neale, & Eaves, 1997). More specifically, the within-population variation in BMI at all ages can primarily be explained by genetic differences between individuals, which indicates that BMI has a strong hereditary component (Maes et al., 1997; Silventoinen & Kaprio, 2009). Studies have consistently reported heritability estimates for OW and OB in the 40% to 90% range (Faith, Johnson, & Allison, 1997; Hinney et al., 2010; Silventoinen & Kaprio, 2009). Longitudinal studies have also revealed a strong genetic continuity in BMI when it is tracked across stages of the lifespan, with reported heritability estimates ranging from 57% to 86% for the trend of BMI from early adulthood to late middle age (Silventoinen & Kaprio, 2009). Overall, twin, adoption, and family studies have provided sufficient evidence for moderate to high heritability of OW and OB.
Research on the molecular genetics of OB has identified either single genes (i.e., monogenic) or combinations of genes (i.e., polygenic) that explain intra-individual differences in OB (Chung, 2012; Hinney et al., 2010; Walley, Blakemore, & Froguel, 2006). Findings from monogenic OB studies suggest that mutations or deficiencies of single genes in the leptin-melanocortin pathway, which play a significant role in the regulation of appetite, account for about 5% of the variation in human OB (Albuquerque, Stice, Rodríguez-López, Manco, & Nóbrega, 2015; Frayling et al., 2007). Research on polygenic OB indicates there are over 100 genes that demonstrate a small effect on BMI,
and the specific set of genetic variants related to OB in one individual is unlikely to be the same in another individual (Chung, 2012). The genes most commonly studied in polygenic OB research are those in the leptin-melanocortin pathway, proinflammatory cytokines, and uncoupling proteins. Furthermore, research on about 30 forms of syndromic OB, which are often associated with cognitive deficits, suggest that specific neuroanatomic or functional deficits in the hypothalamus may lead to increased energy intake (Hinney et al., 2010). Overall, findings from molecular genetic studies suggest that there is a multitude of genes that have been shown to be implicated in the development of OW and OB.
Over 30 hormones produced in the gut and adipose tissue, which help to regulate appetite, food intake, and metabolism, have also been found to be implicated in OW and OB (Lean & Malkova, 2015). Indeed, abnormalities in these hormones have been found in individuals with OB when compared to individuals of healthy weight (HW), as well as individuals with OB who have lost weight. For example, OB has been associated with a diminished response to hormones that stimulate feelings of satiety and suppress feelings of hunger after episodes of eating, which include glucagon-like peptide 1, peptide YY, and cholecystokinin (Lean & Malkova, 2015). OB has been associated with diminished suppression of ghrelin after eating episodes, which is a hormone that triggers hunger and increases preference for foods high in sugar and fat (Wright & Aronne, 2012). Resistance to leptin, a hormone that works to suppress appetite and regulate metabolism, has also been found in individuals with OB (Myers, Leibel, Seeley, & Schwartz, 2010). Moreover, research suggests that weight loss induced by caloric restriction results in changes in hormones that play a role in increased appetite and weight gain (Lean & Malkova, 2015).
Although this finding supports a causal relationship between calorie reduction-induced weight loss and hormone alterations, the extent to which implicated hormones cause OW and OB warrants further research. Nonetheless, these collective findings suggest that hormonal factors do, indeed, play an important part in OW and OB.
Obesogenic Environment
As mentioned earlier, the causes of OW and OB are multifactorial and the role of the environment in the rise of these conditions over the last four decades has been
considered. There is evidence that indicates that the contemporary obesogenic environment has a significant effect on diet and physical activity (Popkin, Duffey, & Gordon-Larsen, 2005). The contemporary obesogenic environment refers to an
environment that encompasses surroundings, opportunities, and conditions that promote OW and OB in individuals or populations, and is hypothesized to be a major influence in the rise of these conditions (Swinburn et al., 2011). Aspects of the obesogenic
environment that are thought to drive the increasing OW and OB rates include an increased wealth of cheap, energy-dense, highly palatable foods; improved distribution systems that make food much more convenient and accessible; and more omnipresent, persuasive, and attractive food marketing (Swinburn et al., 2011).
Over the past four decades, unhealthy foods have become more readily available and their prices are much lower compared to healthy foods, such as fruits and vegetables (Cohen, 2008). In terms of accessibility, there are a plethora of fast food restaurants in the community, and vending machines that carry energy dense items are often found in schools and work settings. Highly palatable foods are often available in large portions, not only at commercial restaurants, but also in grocery and convenience stores (Rolls,
2003). Technological methods that can create cheaper, processed food items have also been developed (Cutler, Glaeser, & Shapiro, 2003). These less expensive, highly caloric and fat-laden foods have become heavily represented in the visual environment to which people are constantly exposed; for example, through advertising on television, billboards, and public transport, and in shops and magazines (Havermans, 2013). The fact that these foods are advertised as fast, inexpensive, and require little to no preparation give them appeal to millions of consumers, especially those who struggle with economic or time-related demands (Wright & Aronne, 2012).
The obesogenic environment is also thought to influence OW and OB rates by affecting the population’s activity practices. Indeed, technological advances related to electronic communication, occupational work, and entertainment have influenced our engagement in physical activity and sedentary behavior, such that more time is now spent using smart phones, watching television, working on the computer, surfing the internet, and playing video games rather than being physically active (Wright & Aronne, 2012). Chapter 2 (Review of the Literature) provides a detailed review of the pathways through which environmental factors are associated with the development of OW and OB. Other Individual Factors
OW and OB are multifactorial and there are numerous other individual factors bedsides biological and environmental factors that may contribute to the development and maintenance of these conditions. These include the role of sleep, stress, mood, and decision-making styles.
Research on the role of sleep in the development of OW and OB has shown that sleep restriction (i.e., sleeping just a few hours a night) may cause increases in hunger
and appetite (Spiegel, Tasali, Penev, & Cauter, 2004). Cross-sectional studies in both children and adults have repeatedly found an association between reduced sleep and increased weight (Gangwisch, Malaspina, Boden-Albala, & Heymsfield, 2005; Sugimori et al., 2004). Furthermore, pooled odds ratios of 1.89 for children and 1.55 for adults have been reported for short sleep duration and its relationship with OB (Cappuccio et al., 2008).
Stress has also been proposed as a factor that can affect weight and weight-related behaviors. Research has shown that stress appears to both increase and decrease food intake (Torres & Nowson, 2007). When individuals respond to stress by eating more, evidence suggests the selected foods are usually high in sugar and fat (Torres & Nowson, 2007). However, anxiety may also alter eating behavior by decreasing energy intake in individuals who are responsive to their physiological state (Herman, Polivy, Lank, & Heatherton, 1987).
Mood has been shown to affect eating behavior, as well. Research suggests that individuals typically eat more food when they are in a positive or negative mood than when they are in a neutral mood (Patel & Schlundt, 2001). There is also consistent evidence of a bidirectional relationship between depression and OB, with a number of biopsychosocial factors having a role in this association (Preiss, Brennan, & Clarke, 2013). Level of education, body image, presence of binge eating, physical health status, psychological characteristics, and interpersonal effectiveness are variables that have been repeatedly linked to the relationship between depression and OB (Preiss et al., 2013).
Cognitive factors, such as the reinforcing value of food and delay discounting, have also been linked to OB. The reinforcing value of food refers to how much an
individual will work towards gaining access to a given food (Temple, 2014). Research on this topic indicates that the reinforcing value of food is higher in individuals with OB vs. HW, whereby the former have been shown to work harder for food than their HW counterparts (C. Hill, Saxton, Webber, Blundell, & Wardle, 2009). The reinforcing value of food has also served as a significant predictor of weight gain over time (C. Hill et al., 2009).
Delay discounting, or the degree to which a person is driven by immediate
gratification vs. the prospect of larger but delayed reward, has also been investigated with regards to OB (Epstein, Salvy, Carr, Dearing, & Bickel, 2010). Research suggests that youth with OB are more likely to choose smaller, immediate rewards, and have more difficulty with delayed gratification for food than for alternative items as compared to their peers without OB (Bonato & Boland, 1983). More recent research has also indicated that difficulty with delaying gratification in childhood can predict weight gain from ages 3 to 11 (Seeyave et al., 2010).
Summary
The research presented in this introduction demonstrates that OW and OB are complex in nature and arise from a multitude of factors and their interactive effects. The contributing factors of OW and OB can be conceptually grouped into a handful of overarching categories, including biological, environmental, and other individual-level factors. OW and OB typically occur as the result of a combination of these factors and their interactive effects, as opposed to the isolated effect of a single factor. Based on these etiological models of OB, interventions to reduce excess body weight have been developed. The purpose of this dissertation was to evaluate the effect of a single-session
attentional bias modification paradigm on eating behavior as a potential intervention that targets an individual’s response to the obesogenic environment. Chapter 2 (Review of the Literature) examines in detail the state of the non-biological OW/OB treatment outcome literature, as well as the literature on attentional bias modification as it relates to OW/OB and eating behavior.
CHAPTER 2
REVIEW OF THE LITERATURE
Status of Non-Biological OW/OB Treatment Outcome Research
A number of interventions have been implemented as a means of addressing the increasing and high rates of OW and OB by targeting specific contributing factors. These interventions can be further categorized based on the intervention target, either
population-level interventions or individual-level interventions (Swinburn et al., 2011). For example, policy interventions, health promotion programs, and social marketing are population-level interventions that seek to change the larger environment. Individual-level interventions, such as lifestyle modification programs, seek to produce behavior change within an individual.
Population-Level Interventions for OW and OB
To address the high rates of OW and OB, population-level interventions seek to improve physical and social environmental contexts that may promote healthy eating and physical activity. These larger scale interventions compliment other treatment
approaches, such as individual-level interventions for individuals with current OW and OB. The rationale behind population-based approaches, however, is that individual-level treatment alone cannot resolve the disturbingly high rates of OW and OB (Chan & Woo, 2010). Although individual-level interventions are of importance, they are limited in terms of long-term weight loss success, as well as the feasibility to deliver them to large amounts of people (Chan & Woo, 2010).
There are a number of population-level approaches to address OW and OB, which include policy interventions, health promotion programs, and social marketing. One of
the main methods for changing the environment involves creating public policies at the federal, state, and local levels (Mayne, Auchincloss, & Michael, 2015; US Department of Health and Human Services, 2010). Aspects of the environment that may be targeted by policy and play a role in the high rates of OW and OB include transportation, nutrition standards, access to food, and advertising (Mayne et al., 2015; McKinnon, 2010; Popkin et al., 2005; Sallis & Glanz, 2009). McKinnon (2010) provides examples of effective policies, which include those that modify the environment in such a way that will make the most healthy diet and activity options easy for consumers to choose; generate short-term incentives that support people’s long-short-term health goals; enhance the accessibility of relevant information that will facilitate informed and conscious decision making among consumers; and address disparities in the ability to engage in healthy diet and activity practices, such as limited availability and access to healthy foods in certain areas of the US
Research on the effectiveness of current policy interventions for addressing the high rates of OW and OB suggests that this approach appears to result in healthy
behavior change. Greater improvements in nutritional intake have been found for policies that place bans/restrictions (e.g., tax) on unhealthy food items, mandate offering and provide subsidies for healthier foods, and modify rules regarding foods that can be purchased using low-income food vouchers (Mayne et al., 2015; Powell & Chaloupka, 2009; Thow, Downs, & Jan, 2014). Policies that have made improvements to active transportation infrastructure have demonstrated increases in physical activity engagement (Mayne et al., 2015). Although a limited number of studies have assessed change in BMI as a result of policy interventions, one study (MacDonald, Stokes, Cohen, Kofner, &
Ridgeway, 2010) found that installing a light-rail system resulted in significant reductions in BMI and risk of acquiring OB over time.
In addition to policy interventions, community-based health promotion programs and social marketing are approaches that also address OW and OB at a population level. One may conceptualize community-based health promotion programs as a step down from policy interventions, whereby the former is limited to geographic boundaries (e.g., neighborhoods) or small social units (e.g., schools or work places) (Atienza & King, 2002). Community-based health promotion approaches may include promoting physical activity practices through building playgrounds or recreational facilities in a
neighborhood or requiring an additional physical education class at a school (Atienza & King, 2002). Other community-based approaches to promote healthy eating would be to make changes to a school menu (e.g., introducing new fruit and vegetable options) or by eliminating unhealthy high fat/high sugar foods and sugar sweetened beverages from a work place’s vending machines (Moynihan, 2010).
Research on the effectiveness of current community-based health promotion programs indicates that this approach appears to result in healthy behavior change. For example, two studies (French et al., 2001; Jeffery, French, Raether, & Baxter, 1994) found that reducing the price of healthy foods, including fruits and vegetables in a school cafeteria and low-fat items in a vending machine, resulted in increased buying and consumption of these healthy foods. Other studies have found that access to nearby parks and recreational facilities in a neighborhood, as well as having sport-related amenities (e.g., basketball hoops) in a school, have consistently been associated with higher levels of physical activity in youth and adults (Chan & Woo, 2010; Sallis & Glanz, 2009).
Furthermore, building designs with more convenient access to stairs than elevators and using signs that encourage stair use has also resulted in higher levels of physical activity among youth and adults (Chan & Woo, 2010; Sallis & Glanz, 2009).
A third population-level approach to address OW and OB is social marketing, which involves implementing communication and marketing strategies to promote
healthy behaviors (Carins & Rundle-Thiele, 2013; Evans, 2006). Health-related messages can be communicated to the public via a number of outlets, including mass media,
healthcare providers and in clinics, interpersonally, and through community outreach (Evans, 2006). The theoretical basis of social marketing involves an integration of behavioral, persuasion, and exposure principles to target changes in risky health
behaviors (Evans, 2006). The main goal is to identify behavioral causes of OW and OB that can be changed and, once identified, construct theoretical frameworks that model the multifaceted relationships from messages to behavior change (Evans, 2006).
Research on the effectiveness of social marketing indicates that this approach appears to result in healthy behavior change, as well. Findings from a recent review yielded six components of social marketing interventions that were related to better improvements in healthy eating, which included declaring a behavioral objective, defining a target audience, using research to inform the intervention, offering incentives for desired behavior, employing a multifaceted marketing approach, and considering the competition (Carins & Rundle-Thiele, 2013). Overall, the evidence suggests that social marketing is effective in encouraging a variety of healthy eating behaviors, including increasing fruit and vegetable consumption, as well as decreasing consumption of foods high in fat, carbohydrates, and calorie content (Carins & Rundle-Thiele, 2013).
Individual-Level Interventions for OW and OB
Interventions, such as comprehensive lifestyle modification programs, target OW and OB on an individual level; that is, they focus on individual behavior change by providing care services, education, and training to individuals (Wadden, Webb, Moran, & Bailer, Brooke, 2012). Comprehensive lifestyle modification programs are considered the first option for weight loss and consist of three primary components, including diet, physical activity, and behavior therapy. These programs are usually delivered in either an individual or group format, and involve weekly treatment sessions that focus on
modifying eating and physical activity practices (Wadden et al., 2012).
Given that energy intake plays a significant role in OW and OB, lifestyle programs aim to prescribe a diet that will result in weight loss or weight maintenance. Such diets vary widely in macronutrient composition and can include those that are low in carbohydrates (e.g., Atkins diet) (Foster et al., 2003), fat (e.g., Ornish diet) (Dansinger, Gleason, Griffith, Selker, & Schaefer, 2005), or glycemic load (Ebbeling, Leidig,
Feldman, Lovesky, & Ludwig, 2007); those that encourage consumption of unsaturated fats (e.g., Mediterranean diet) (Mendez et al., 2006); and those that encourage greater consumption of protein (e.g., Paleo diet) (Frassetto, Schloetter, Mietus-Synder, Morris, & Sebastian, 2009). Caloric restriction, as opposed to macronutrient composition, however, is the key determinant of weight loss in dietary interventions (Wadden et al., 2012). As such, in order to achieve long-term weight loss, most individuals with OW or OB must consciously restrict their energy intake through a number of approaches, including decreasing portion sizes, decreasing the caloric density of the diet, and/or counting calories or limiting intake of specific macronutrients (Wadden et al., 2012). There is
evidence to suggest that the different macronutrient-based diets produce relatively equivalent amounts of short-term weight loss (Wadden et al., 2012).
Complimentary to the diet component of lifestyle modifications programs is the physical activity component. Individuals are encouraged to engage in some degree of exercise that will result in energy expenditure, mainly for the sake of improving their cardiovascular health. Oftentimes the recommendation is to engage in physical activity of moderate to vigorous intensity, which can be performed in multiple short bouts (e.g., 10 minutes) or a long bout (e.g., greater than 40 minutes) (Wadden et al., 2012). Low intensity exercise, such as walking, however, has also shown to be an effective method for weight control (Wadden et al., 2012). Overall, there is evidence to suggest that engaging in high levels of physical activity reduces the amount of weight that is regained following weight loss; however, it only slightly increases short-term weight loss when combined with caloric restriction (Wadden et al., 2012).
The set of recommendations and strategies that are taught to individuals
participating in lifestyle modification programs to help them change their current diet and activity habits comprises the behavior therapy component of these interventions (Wadden et al., 2012). Behavioral strategies employed in such interventions include setting
specific, measurable goals for behavior change, such that define the particular behaviors that an individual will engage in, as well as when, where, how, and the duration (Wadden et al., 2012). Another important behavioral strategy is self-monitoring of behavior, such as recording one’s daily food intake, physical activity, and weight. This strategy helps to monitor changes in behavior and outcomes of behavior change, as well as identify barriers that may be hindering behavior change (Wadden et al., 2012).
Overall, comprehensive lifestyle modification programs have demonstrated short-term efficacy in that they produce an average weight loss of about 7 to 10 kilograms in six months, which is equivalent to a 7% to 10% reduction in initial weight, and this weight loss is often maintained for up to 12 months (Wadden et al., 2012). Evidence on the long-term efficacy of these programs, however, is less consistent, with some degree of weight regain often being reported in the year following weight loss (Wadden et al., 2012). Notwithstanding, the short-term reduction in weight is often associated with clinically meaningful improvements in OB-related comorbid health conditions, such as several cardiovascular disease risk factors and type 2 diabetes (Wadden et al., 2012). Limitations of Current Non-Biological Interventions for OW and OB
It has been described here that various approaches have been taken to address the increasing prevalence of OW and OB, such as those that promote health behavior change on both a population and individual level. Population-level interventions, including policy interventions, health promotion programs, and social marketing, primarily seek to produce health behavior change through modifying the obesogenic environment.
Individual-level interventions, including comprehensive lifestyle modification programs, primarily seek to produce weight loss by modifying person-level factors within an individual. Although there is evidence to suggest that the current interventions
demonstrate some degree of effectiveness for the treatment of OW and OB, they are not without their limitations. Indeed, the prevalence of OW and OB in the US is still
alarmingly high, which suggests that the OB problem has not been solved. This author proposes that the primary weakness of the current interventions is the lack of focus on and incorporation of the interactive effects of the environment with biological factors.
As described in Chapter 1 (Introduction), the obesogenic environment and its interactions with biological factors have been determined to be significant contributing factors in the development and maintenance of OW and OB. One aspect of the
environment that promotes OB is the pervasive presence of visual food cues, through advertising on television, billboards, and public transport, and in shops and magazines (Havermans, 2013). Continual exposure to the omnipresence of visual food cues in the environment has the ability to interact with reward systems of the brain and trigger motivated behavior, which may play a significant role in excessive food intake and subsequent OW and OB (Castellanos et al., 2009). Determining the role of food cues in the development and maintenance of OW and OB is of practical and ecological
significance; thus, it is important to understand exactly how food cues interact with reward systems in the brain to direct attention and impact resultant behavior (Castellanos et al., 2009).
The current individual-level interventions for OW and OB lack consideration of how the environment interacts with biology to influence individual health-related behaviors. For example, lifestyle modification programs provide education on the importance of diet and physical activity but do not into account individual differences in attention to visual food cues. An attentional bias to visual food cues, particularly
unhealthy foods, may be strong enough to disregard dietary recommendations or disrupt a diet. As such, it may be advantageous for interventions to incorporate modification of attentional bias to food cues to enhance their effectiveness in treating OW and OB.
What is certain is that continued work that focuses on the development of new, or modification of current, treatment strategies is crucial to successfully combat OW and
OB, or at least to significantly reduce the current prevalence rates. Given that exposure to visual food cues is a potentially modifiable environmental variable, a better
understanding of the effects of visual food cue exposure on attention may prove to be an important step in the development and modification of treatments for OW and OB.
Food Cue Exposure and Attentional Bias
One influential general theory that provides an explanation for the connection between cue exposure and its effects on attention is Robinson and Berridge’s (1993) incentive sensitization model, which was originally developed to explain addiction. This model posits that repeated administration of substances of abuse (i.e., drugs) modifies the reward-related dopaminergic system in the brain, leading the brain to become
hypersensitive to such substances. The sensitized dopaminergic response causes these substances to become highly desired and “wanted”. Cues in the environment that are associated with these rewarding substances, such as visual stimuli or images of the substance, acquire motivational properties or incentive salience over time through a process known as classical conditioning, or the repeated association between the cues (i.e., images of drug) and intake of the rewarding substance (i.e., drug itself) (Robinson & Berridge, 1993). Consequently, the cues that are related to the rewarding substance also become highly salient, causing them to be perceived as attractive and “wanted”. The brain begins to perceive these cues as predictive of reward; thus, the cues begin to automatically capture greater attention and, in turn, stimulate craving, which may potentially influence subsequent behavior (i.e., towards obtaining the rewarding
substance). This process occurs outside of conscious awareness and is often referred to as attentional bias (Robinson & Berridge, 1993).
The ability of a substance to activate the dopaminergic system is the key component in determining its reward value (Wise, 1998). As such, the incentive
sensitization model has been applied to numerous substances of addiction including drugs (Marhe, Luijten, van de Wetering, Smits, & Franken, 2013), alcohol (Weafer & Fillmore, 2009), tobacco (Chanon, Sours, & Boettiger, 2010), and caffeine (Yeomans, Javaherian, Tovey, & Stafford, 2005), and attentional biases to these substances, and their related cues, have been well-documented. In addition, research has shown that palatable foods, especially those high in sugar and/or fat, have the ability to activate the dopaminergic system in a similar manner to substances of addiction (Avena, Rada, & Hoebel, 2008; South & Huang, 2008). Thus, it has been suggested that food-related cues may have the ability to capture attention and activate the dopaminergic system as well, thus making visual food cues more salient and attractive to the observer (Volkow, Wang, & Baler, 2011; Volkow & Wise, 2005). However, it is important to note that not all individuals are equally susceptible to food cues in the environment.
Measurement of Attentional Bias to Food Cues
Attentional bias to food and other stimuli is thought to occur automatically and without necessary conscious awareness. Implicit processing measures, therefore, are needed to assess this construct and the most common are the Stroop task and dot probe task. The Stroop task (Stroop, 1935) was adapted from cognitive psychology to examine human attention and information processing. During this task there is a presentation of words that are displayed in different colors of ink; some words are control words, while the others are words related to the stimuli of interest (e.g., food). The participant is asked to name the color of ink that each word is printed in as quickly and accurately as possible,
while attempting to ignore the meaning of the word (see Figure 1). A relative delay in correctly naming the color of the word is considered an interference effect and suggests that there is cognitive competition present; that is, it would suggest that the participant may have difficulty ignoring the meaning of the word because it takes them longer to focus on and correctly name the color of the word (Stroop, 1935). As such, attentional bias is determined from the length of time that it takes to color name a word related to the stimuli of interest (e.g., food) as compared with a control word (Stroop, 1935).
Although the Stroop task has been widely used as a test of attentional bias, it has a number of disadvantages (Werthmann, 2014). First, the underlying attentional processes at work are unknown in that slower color-naming of a word could be caused both by an attentional bias towards the meaning of the word or by an avoidance of processing the word (Field & Cox, 2008). This leads to the problem of not being able to identify the direction (approach or avoidance) of the attentional processes. The time course of the attentional processes is unclear as well, such that the delay in color-naming has been argued to reflect an automatic semantic processing, which is an early attentional process (Cox & Pothos, 2006), or a slow disengagement, which is a later attentional process (Phaf & Kan, 2007).
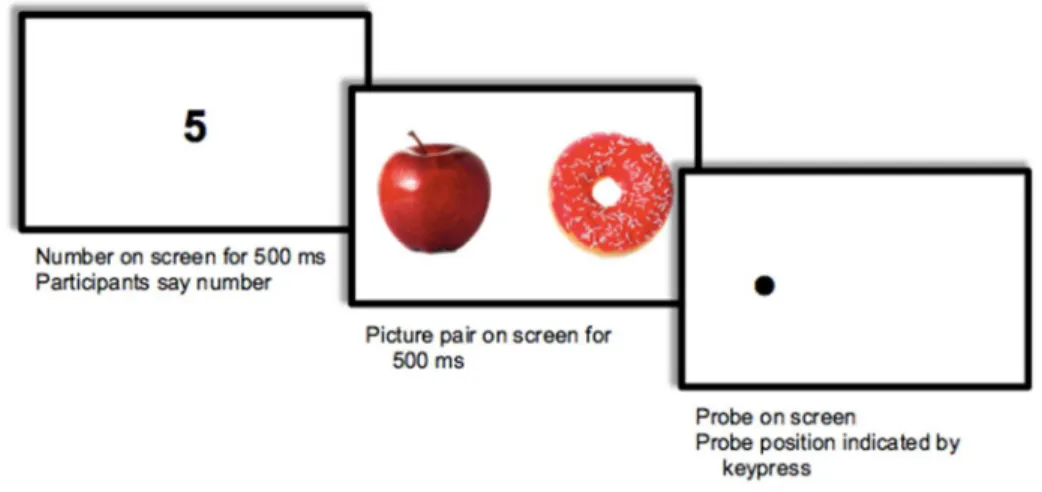
Attentional bias research has continued to evolve in an attempt to measure how visual attention is allocated to a particular stimuli when there are two competing reward-related cues presented simultaneously. One such method is the dot probe task (see Figure 2) (MacLeod, Mathews, & Tata, 1986), which has been argued to be a superior, more direct, and more ecologically valid measure of attention than the Stroop task (Faunce, 2002; MacLeod et al., 1986; MacLeod & Mathews, 1991). In the dot probe task, participants are exposed to a word or image related to a stimulus of interest (e.g., food) that is matched to a control word or image that are presented simultaneously, side by side on a computer screen. The paired words or images disappear after a predetermined length of time (usually 50-2000 ms) and a dot probe replaces one of the previous stimuli.
Participants are then asked to indicate the location of the probe as quickly and accurately as possible, and attentional bias is determined from the length of time that it takes to correctly identify the location of the probe. It has been suggested that participants will
respond faster to probes that replace the location of a stimulus that they have already directed their attention towards, as compared to probes that appear in an area to which the participant has not attended (MacLeod et al., 1986).
Figure 2. Visual illustration of stimulus pictures presented during the dot probe task.
An advantage of the dot probe task is that the calculation of response latencies provides information regarding the direction of attention. To calculate an attentional bias score, the mean response latency when probes replace food pictures is subtracted from the mean response latency when probes replace control pictures; thus, a positive number reflects attentional approach and a negative number reflects attentional avoidance (Mogg, Bradley, Miles, & Dixon, 2004). Additionally, this task can distinguish early and later attentional processes by varying the length of time that the stimulus is presented on the computer screen (Werthmann, 2014). It has been proposed that stimulus durations of 100-500 ms assess initial orientation of attention, whereas stimulus durations of 100-500 ms and above assess maintained attention (Mogg et al., 2004). The use of long stimulus
attention between stimuli or disengagement from stimuli (Field, Mogg, Zetteler, & Bradley, 2004). As such, the dot probe task may be more suitable for assessing initial attention to visual food cues.
Studies on Attentional Bias to Food Cues
Not all individuals are equally susceptible to food cues in the environment. Individual differences in attentional biases for food-related cues relative to one’s BMI category has been an area of interest because research suggests that greater attention to food cues may be associated with OB. Given this association, researchers have also studied the utility of attention to food cues in predicting change in BMI across time. The studies described below assessed attentional bias using the dot probe or Stroop task.
Comparing BMI categories with the dot probe task. Werthmann and colleagues (2011) examined whether OW and HW female college students differed on attentional bias measures towards unhealthy foods using both the dot probe task and eye-tracking methodology. The stimuli were pictures of highly palatable, unhealthy foods vs. non-food objects (i.e., musical instruments). Stimuli were presented for a duration of 2000 ms so that the researchers could use eye-tracking to assess the attentional
mechanisms at play, including initial orientation vs. maintained attention, direction of attention, and duration of attention. Three attentional bias measures were yielded from the eye-tracking (i.e., gaze direction bias, initial fixation duration bias, and gaze dwell time bias) and one was yielded from the dot probe task (i.e., probe manual response latency bias). Compared to HW participants, OW participants (1) directed their first fixation more often to food images than to non-food images and (2) had a significantly
shorter fixation duration when they attended to food pictures first than when they attended to non-food pictures first (Werthmann et al., 2011).
Nijs and colleagues (2010) investigated whether attentional biases to unhealthy food vs. non-food pictures differed between OW/OB and HW college women using a combination of the dot probe task (stimulus presentations of 100 ms and 500 ms), eye-tracking methodology, and electroencephalographic (EEG) recordings. The authors assessed different attentional mechanisms, such as gaze direction and duration. The eye-tracking data did not yield significant differences between BMI groups; rather, there was an initial orientation and maintained attention to unhealthy food pictures observed in all participants. The dot probe task revealed that initial orientation towards unhealthy food cues was observed in OW/OB vs. HW women, but there were no differences between BMI groups in terms of maintained attention (Nijs, Muris, Euser, & Franken, 2010).
Loeber and colleagues (2012) assessed whether attentional biases for food-related vs. non-food cues differed between community-dwelling adults who were either OB or HW using the dot probe task. The stimuli consisted of general food pictures and non-food object pictures, and were presented for a duration of 500 ms. The authors found no
differences between OB and HW participants in attentional biases towards food or non-food related stimuli (Loeber et al., 2012).
Comparing BMI categories with the Stoop task. Nijs and colleagues (2010) assessed attentional bias to food-related words using a combination of the Stroop task and event related potentials as measured by simultaneous EEG recordings of brain activity. The stimuli presented during the Stroop task included words referring to highly palatable, unhealthy foods and neutral office-related control words, and were presented for a
duration of 2000 ms. The researchers were interested in examining initial orientation of attention and maintained attention in a sample of community-dwelling, OB and HW adults. The two BMI groups did not differ in their attentional bias towards food-related content as measured by the Stroop-related reaction time; rather, a general bias towards food-related content was found for both BMI groups. The EEG data yielded differences between BMI groups, whereby OB individuals showed a greater initial orientation of attention towards food-related words than nonfood words, and this finding was not observed in the HW participants. The two BMI groups did not differ in maintained attention towards food-related words (Nijs, Franken, & Muris, 2010).
Phelan and colleagues (2011) examined differences in attentional bias towards high- and low-calorie food words among OB, HW, and weight loss maintaining adults in the community. There were no differences in attentional bias between the three groups towards the low-calorie food words; however, for the high-calorie food words, the weight loss maintainers showed a significantly greater attentional bias than both the HW and OB participants (Phelan et al., 2011).
Predicting change in BMI with attentional bias measures. Calitri (2010) and colleagues investigated whether attentional biases for food-related words could predict change in BMI over a 12-month period using both the Stroop and dot probe tasks. Stimuli included healthy and unhealthy food words, and presentation time was varied in the dot probe task to examine initial (500 ms) vs. sustained (1250 ms) attention. Participants included first-year college students residing on campus. Results from the Stroop task revealed that an attentional bias towards unhealthy foods predicted an increase in BMI over time, whereas an attentional bias towards healthy foods and stress (as measured by
Lovibond and Lovibond’s [1995] Depression, Anxiety, and Stress Scale) predicted a decrease in BMI over time (Calitri, Pothos, Tapper, Brunstrom, & Rogers, 2010).
Pothos (2009) and colleagues examined cognitive correlates of BMI among male and female undergraduate students using three attentional measures, including the dot probe task as a measure of initial attention (500 ms), the dot probe task as a measure of sustained attention (1200 ms), and the Stroop task, all of which presented stimuli of healthy and unhealthy food words. The authors found none of the attentional measures to significantly correlate with or predict BMI, either for the sample as a whole or when analyzing males and females separately (Pothos, Tapper, & Calitri, 2009).
Other factors that may influence attention to food cues. Additional studies have indicated that attentional biases towards unhealthy food cues are common to an array of eating-related populations, such as individuals who restrict their food intake (Hollitt, Kemps, Tiggemann, Smeets, & Mills, 2010) or eat in response to external food cues (Hou et al., 2011). Both restrained eaters and external eaters have been found to respond faster to high calorie food cues relative to non-food cues. Nijs and colleagues (2010) investigated whether attentional biases to unhealthy food vs. non-food pictures differed depending on hungry vs. sated status in OW/OB and HW college women. Initial orientation towards unhealthy food cues was observed in hungry vs. sated women, regardless of BMI category, but there were no differences between hunger conditions in terms of maintained attention. Furthermore, conscious maintained attention to unhealthy food pictures was enhanced in the hunger vs. satiety condition only in HW females (Nijs, Muris, et al., 2010). Phelan and colleagues (2011) examined differences in attentional bias towards high- and low-calorie food words relative to levels of restraint and
disinhibition. These variables were not significantly associated with attentional bias scores on the Stroop task before or after controlling for weight group status.
Summary of studies on attentional bias to food cues. The majority of findings from studies that have compared BMI groups with regards to attentional bias to food cues have been mixed. The evidence suggests that individuals with OW and OB sometimes demonstrate attentional biases to unhealthy food stimuli vs. non-food stimuli when compared to individuals of HW. It appears that the attentional bias findings observed in OW/OB individuals are driven by an initial orientation to unhealthy food stimuli as opposed to sustained attention, which has been assessed with shorter stimulus presentation times. Furthermore, there is some evidence to suggest that attentional measures may predict change in BMI over time, such that greater attention towards unhealthy foods is associated with increases in BMI and greater attention towards healthy foods is associated with decreases in BMI. Although further research is needed to
adequately assess the relationship between BMI status and attentional bias to food-related stimuli, the limited research that is available suggests that attentional bias to food cues may play some role in the development and maintenance of OW and OB. Table 1 outlines the aforementioned studies that have examined individual differences in attentional bias to food cues.
Table 1
Studies on individual differences in attentional bias to food cues Authors, year Attentional bias measure(s),
stimuli, and presentation duration
Sample and group comparisons Results Werthmann, Roefs, Mogg, Bradley, & Jansen, 2011 DP, ET
Unhealthy vs. non-food pictures 2000 ms
Female college students OW vs. HW
OW participants directed first fixation more often to unhealthy food vs. non-food pictures
OW participants had shorter fixation duration when attending to unhealthy food vs. non-food pictures first
Nijs, Muris, Euser, & Franken, 2010
DP, ET, EEG
Unhealthy vs. non-food pictures 100 and 500 ms
Female college students OW/OB vs. HW
ET: all participants demonstrated initial orientation and maintained attention to unhealthy food pictures
DP: initial orientation to unhealthy food pictures in OW/OB (vs. HW)
DP: no differences between BMI groups in maintained attention to unhealthy food words
Loeber et al., 2012
DT
Food vs. non-food pictures 500 ms
Community dwelling adults OB vs. HW
No differences between BMI groups in attention to food vs. non-food pictures Note: DT = dot probe; ET = eye tracking, EEG = electroencephalography
table continues
2
Authors, year Attentional bias measure(s), stimuli, and presentation duration
Sample and group comparisons
Results Nijs, Franken, &
Muris, 2010
Stroop, EEG
Unhealthy vs. non-food words 2000 ms
Community dwelling adults OB vs. HW
Stroop: all participants demonstrated bias towards unhealthy vs. non-food words EEG: OB participants showed greater initial
orientation towards unhealthy vs. non-food words, but HW participants did not show this bias
EEG: no differences between BMI groups in maintained attention to unhealthy food words
Phelan et al., 2011
Stroop
High- vs. low-calorie food words Unknown duration
Community dwelling adults OB vs. HW vs. weight loss
maintainers
No differences between groups in attentional bias towards low-calorie food words Weight loss maintainers demonstrated greater
attentional bias than HW and OB to high-calorie food words
Calitri, Pothos, Tapper, Brunstrom, & Rogers, 2010
Stroop, DT
Healthy vs. unhealthy food words 500 and 1250 ms
First-year college students who reside on campus No group comparisons
Stroop: greater attentional bias towards unhealthy food words predicted increases in BMI
Stroop: greater attentional bias towards healthy food words predicted decreases in BMI
Pothos, Tapper, & Calitri, 2009
Stroop, DT
Healthy vs. unhealthy food words 500 and 1200 ms
College students No group comparisons
No attentional bias measures predicted BMI
Note: DT = dot probe; ET = eye tracking, EEG = electroencephalography
3
Attentional Bias and Consumption Behavior
Attentional biases for high calorie foods have been linked to subsequent consumption of these foods (Nijs, Muris, et al., 2010) as well as weight gain over a 12 month period (Calitri et al., 2010). One theory that seeks to explain this relationship is Berridge’s (2009) model of food reward, which was adapted from the incentive sensitization model originally developed to explain addiction (Robinson & Berridge, 1993). The model of food reward posits that motivational value is attributed to food cues through classical conditioning. Food cues (e.g., the sight of food) in the environment become salient through constant association with a rewarding experience (e.g., eating) and, as a result, grab attention, which then prompts the consumption of that food. This process often occurs without conscious awareness (Berridge, 2009). Only a couple of studies have examined the relationship between baseline attentional bias and subsequent food consumption in a laboratory-based taste test.
Nijs and colleagues (2010) sought to determine if measures of attentional bias (e.g., eye-tracking methodology, dot probe task, EEG recordings) towards food pictures were correlated with food intake during a laboratory taste test in both OW/OB and HW college women. They found that maintained attention to food pictures as measured by EEG recordings was significantly and positively associated with food intake in only the HW group, but not in the OW/OB group. No other measures of attention were associated with food intake during the taste test (Nijs, Muris, et al., 2010).
Wethmann and colleagues (2011) also investigated whether attentional bias towards food pictures was related to food intake during a laboratory-based taste task in both OW/OB and HW female students using the dot probe task in conjunction with
eye-tracking. The authors failed to find any significant correlations between the attentional bias measures and food consumption (Werthmann et al., 2011).
Calitri and colleagues (2010) conducted a study that differs from the previous two in that it measured BMI over time rather than direct food consumption. The authors investigated whether attentional biases for food-related words could predict change in BMI over a 12 month period using both the Stroop and dot probe tasks. Stimuli included healthy and unhealthy food words, and presentation time was varied in the dot probe task to examine initial (500 ms) vs. sustained (1250 ms) attention. Participants included first-year college students residing on campus. Results from the Stroop task revealed that an attentional bias towards unhealthy foods predicted an increase in BMI over time, whereas an attentional bias towards healthy foods and stress (as measured by Lovibond and Lovibond’s [1995] Depression, Anxiety, and Stress Scale) predicted a decrease in BMI over time (Calitri et al., 2010).
Collectively, there has been very limited research that has examined the relationship between attentional bias to food cues and food consumption or change in BMI over time. Nonetheless, the available evidence suggests that attentional bias to unhealthy food stimuli may have a role in the development and maintenance of OW and OB.
Attentional Bias Modification for Unhealthy Food Cues
It is important to change unhealthy eating behavior in order to improve health. Berridge’s (2009) model of food reward suggests one way to counteract unhealthy eating is to change the underlying cognitive process, that is, the attentional bias. Decreases in
attentional biases for unhealthy food should, theoretically, lead to decreases in the consumption of unhealthy food according to this model.
In order to experimentally manipulate attentional bias, researchers have utilized the visual dot probe task. The first attentional bias modification (ABM) program was developed to train alcohol users to either attend to or avoid alcohol-related cues (Field & Eastwood, 2005). During this program, the dot probe task attempts to retrain an
individual’s automatic attentional process by having the probe replace a given stimuli during all or most (i.e., ≥ 90%) of the trials of the dot probe task. In Field and Eastwood’s (2005) study, for example, the probe always replaced the alcohol-related picture in the ‘attend alcohol’ condition, whereas the probe always replaced the neutral control picture in the ‘avoid alcohol’ condition. Thus, the objective of the ABM dot probe task is for the participant to learn an implicit rule in that if two competing stimuli are present
simultaneously, then attend preferentially to the stimuli that you are being trained towards (Mathews & MacLeod, 2002).
This ABM paradigm has since been applied to other research areas, including the food domain. In a study conducted by Kemps and colleagues (2014), female college students, aged 18 to 26 years, with unknown weights/BMI categories (these variables were not reported by the authors), were trained to direct their attention towards (‘attend chocolate’ group) or away from (‘avoid chocolate’ group) chocolate cues in an ABM task that utilized a dot probe paradigm. Participants in the ‘attend chocolate’ group
demonstrated an increased attentional bias towards chocolate cues, whereas those in the ‘avoid chocolate’ group demonstrated a reduced attentional bias towards such cues and
ate less of a chocolate muffin than those in the ‘attend chocolate’ group (Kemps, Tiggemann, Orr, & Grear, 2014).
In a similar study, female college students with an average age of 19.5 years and average BMI of 22.1 kg/m2 were trained to direct their attention towards either chocolate stimuli or non-food stimuli in an ABM task that utilized an antisaccade paradigm that records eye movements rather than key presses (Werthmann, Field, Roefs, Nederkoorn, & Jansen, 2014). Eye movements during the task were also examined to assess for accuracy and its possible moderating effects. There were no differences between ABM training groups in chocolate consumption. However, a significant interaction between ABM training and accuracy was revealed, whereby participants who demonstrated high accuracy ate more chocolate when they had to attend to chocolate and ate less chocolate when they had to attend to non-food stimuli. Participants who demonstrated low
accuracy, however, showed reverse results (Werthmann et al., 2014).
In a later study, Kakoschke and colleagues (2014) attempted to train participants to attend to healthy food cues, rather than simply avoid unhealthy food cues utilizing a dot probe task. Female college students, aged 18 to 25 years, most of whom were in the normal weight range (average BMI was 22.2 kg/m2), were asked to direct their attention towards either healthy food cues (‘attend healthy’ group) or unhealthy food cues (‘attend unhealthy’ group). Participants in the ‘attend healthy’ group demonstrated an increased attentional bias towards healthy food cues and ate more healthy snacks (i.e., strawberries and mixed unsalted nuts) relative to unhealthy snacks (i.e., M&Ms and potato chips) compared to the ‘attend unhealthy’ group during a taste test that occurred immediately following the ABM training. This study is novel in that it was the first to attempt to train
participants to attend to healthy food cues; however, the sample was limited to female college students of HW. Although the ‘attend healthy’ condition did result in greater consumption of healthy vs. unhealthy foods in a taste test, it is imperative that these results be replicated in other samples (Kakoschke, Kemps, & Tiggemann, 2014).
In their most recent study, Kemps and colleagues (2014) examined ABM in a sample of community-dwelling OB adult women (average BMI was 36.63 kg/m2).
Participants were between the ages of 24 and 67 with an average age of 48.88. They were trained to either attend to (‘attend food’ group) or avoid (‘avoid food’ group) food
pictures, which consisted of a combination of high-calorie and low-calorie food items, during a dot probe task. Consistent with previous findings, the ‘attend food’ group demonstrated an increase in attentional bias towards food, while the avoid group demonstrated a decrease in attentional bias towards food, as measured by responses on the dot probe task (Kemps, Tiggemann, & Hollitt, 2014). Food consumption following the modification program was not measured in this study, as it was in the others, which is considered as a limitation. Thus, it is unknown if a decrease in attentional bias towards food results in decreased food consumption in OB individuals.
Boutelle and colleagues (2014) assessed the efficacy of a dot probe ABM paradigm on overeating in OW and OB children, aged 8 to 12 years old, who
demonstrated eating in the absence of hunger at baseline. Attention was either trained away from food words to neutral words 100% of the time (‘attention modification’ condition) or 50% of the time (‘attention control’ condition). Children were then
introduced to a free access eating session immediately following the attentional task, and their caloric consumption was measured. The ‘attention modification’ condition resulted
in decreases in the number of calories consumed, as well as the percent of daily caloric needs consumed, in the eating in the absence of hunger free access session following the task. Furthermore, children in the ‘attentional control’ condition demonstrated a
significant increase over time in number of calories consumed, as well as the percent of daily caloric needs consumed, in the eating in the absence of hunger free access session following the task (Boutelle, Kuckertz, Carlson, & Amir, 2014).
Limitations of Studies on ABM for Unhealthy Food Cues
Although these findings support the efficacy of ABM paradigms for modifying eating behaviors as well as the hypothesized link between biased attentional processing and food consumption, they are subject to limitations which have been briefly described above. The four adult studies have used all-female samples, so it is unknown if the findings will generalize to males. Additionally, while there is adequate evidence to suggest that these programs can train unhealthy eating, by either attending to or avoiding it, their ability to train healthy eating warrants further investigation, as only one study (Kakoschke et al., 2014) to date has examined this aspect and was limited in terms of an all-female, HW sample. It is also important to extend these findings to individuals who are OW or OB, and might have a stronger pre-existing attentional bias towards unhealthy food.
Summary
In summary, the prevalence of OW and OB is extremely high across stages of the lifespan and temporal trends indicate significant increases in these conditions over the past four decades. Given the numerous health risks associated with OW and OB, targeting their increasing prevalence rates has become a public health priority. There is