Procedia Engineering 118 ( 2015 ) 622 – 629
1877-7058 © 2015 The Authors. Published by Elsevier Ltd. This is an open access article under the CC BY-NC-ND license (http://creativecommons.org/licenses/by-nc-nd/4.0/).
Peer-review under responsibility of organizing committee of the International Conference on Sustainable Design, Engineering and Construction 2015 doi: 10.1016/j.proeng.2015.08.495
ScienceDirect
International Conference on Sustainable Design, Engineering and Construction
Multi-linear Regression Models to Predict the Annual Energy
Consumption of an Office Building with Different Shapes
Mohammad Mottahedi
a,Atefeh Mohammadpour
b, , Shideh Shams Amiri
b, David Riley
b,
Somayeh Asadi
b*
a Department of Mechanical Engineering, University of Texas at San Antonio, One UTSA Circle, San Antonio, TX 78249, United Stat es b Department of Architectural Engineering, Pennsylvania State University, 104 Engineering Unit A, University Park, PA, 16802, United States
Abstract
The present study describes the development of a multi-linear regression model to predict the effect of building shape on total energy consumption in two different climate regions ( i.e. cold-dry and warm-marine). Seven building shapes including H-shape, T-shape, rectangle, etc. were considered in this study. The simplified model can be used to conduct a parametric study in order to investigate the effect of building parameters on total heating and cooling load. Building simulation software programs, including eQUEST and DOE-2 were used to build and simulate individual building configuration that were generated using Monte Carlo simulation techniques. Ten thousand simulations for seven building shapes were performed to create a comprehensive dataset covering the full ranges of design parameters. Statistical analysis was performed using R statistical analysis program to develop a set of linear regression equations predicting energy consumption of each design scenario. In addition, the influence of sever al design parameters on building energy consumption was further investigated using the sensitivity analysis procedure. The difference between regression-predicted and DOE-2 simulated annual building energy consumption were largely within 5%. It is envisioned that the developed regression models can be used to estimate the total energy consumption in the early stages of t he design when different building schemes and design concepts are being considered.
© 2015 The Authors. Published by Elsevier Ltd.
Peer-review under responsibility of organizing committee of the International Conference on Sustainable Design, Engineering and Construction 2015.
Keywords: eQUEST simulation; DOE-2 simulation; Monte Carlo simulation; Regression equations; Building energy performance.
* Corresponding author. Tel.: +1-814-865-3013; fax: +1-814- 863-4789.
E-mail address: [email protected]
© 2015 The Authors. Published by Elsevier Ltd. This is an open access article under the CC BY-NC-ND license (http://creativecommons.org/licenses/by-nc-nd/4.0/).
Peer-review under responsibility of organizing committee of the International Conference on Sustainable Design, Engineering and Construction 2015
1.Introduction
The world energy consumption will increase by 56% in the next two decades, fro m 524 to 820 quadrillion Btu [1]. Hence, prediction of build ing energy performance seems necessary to project building energy consumptions. Many tools and techniques are available to predict the energy performance of the build ings and it is beneficial for all the stakeholders. It helps owners to project their annual energy cost, assist designers to decide on the energy conservation measures and design based on the goal of the projects for energy saving, and also enable decision makers to decide on how much energy they can save during the life cycle of a construction project. There are several tools that predict energy consumption of a build ing such as Ecotect, eQUEST, etc. with focus on different aspects of a build ing performance. Fo r example, eQUEST provides simulation based on build ing co mponents such as walls, windows, glass, as well as number of occupants, plug loads, and ventilation rate while Ecotect associates a 3D modeler with a large spectrum of energy performance analysis including thermal, energy, lighting, shading, acoustics and cost [2].
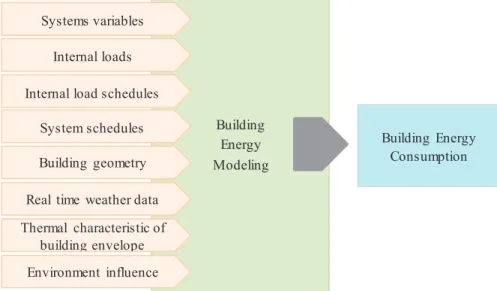
Several studies have been conducted on building energy performance [3-5] wh ile estimation of energy consumption of a building is not a simp le task as it depends on several factors [5]. According to Heidarinejad [6], there are several variables that influence building energy perfo rmance, including: (1) systems variables, (2) internal loads, (3) internal load schedules, (4) systems schedules, (5) bu ild ing geometry, (6) real time weather data, (7) thermal characteristic of building envelope, (8) unban environment influence (shown in Fig 1).
Fig. 1. Variables that influence building energy performance
This study provides a practical and realistic approach to predict energy performance of typical office buildings with a particular focus on two different climates , Billings (cold-dry) and San Jose (warm-marine). Seven office building shapes including, rectangle, H-shape, L-shape, rectangle minus corner, triangle, T -shape, and U-shape were considered. eQUEST and DOE-2 were used to build each building configuration. Monte Carlo simu lation methods were employed to generate uniform probability distribution . Ten thousand simulations were perfo rmed for each building shape in each climate zone to provide a comprehensive set of data that covers a full range of design parameters. Consequently, to predict the energy performance of each building, the result s of the simulation techniques were implemented into a set of regression equations.
2.Methodology
Building energy simu lation techniques are used common ly to predict build ing energy performance. The energy simu lation modelling provides projected energy usage for the buildings. It can be beneficial fo r any phase of a
Building Energy Consumption Building Energy Modeling Systems variables Internal loads Internal load schedules
System schedules Building geometry Real time weather data Thermal characteristic of
building envelope Environment influence
construction project. In this study DOE-2 was used for building energy models for all the seven office shapes. The constant parameters such as building type, information related to building enclosures, and number of occupants are used as inputs for DOE-2 fro m reference [6]. Monte Carlo Simu lation uniform probability d istribution was used for each parameter, and 10,000 simu lations were run for each shape and climate. To be able to provide mu ltip le linear regression analysis, Python’s programming language was employed to conduct a numerical code interfacing DOE-2. The build ing components covering walls, roof, ceiling, foundation, and floors are used in this study. The considered variables and their associated levels are based on reference [6].
Result and Discussion
The energy consumption data generated using DOE-2 software and rando mly generated building parameters were used to develop a mu lti-linear regression model. The coefficients obtained fro m each regression model exp lain the variation in dependent variable Y, with a change in independent variables X1-Xn. All the statistical assumption to
properly develop a linear regression model such as normality, independence , linearity, and ho moscedasticity were checked for each regression model.
3.1 Regression Models and Accuracy
Seven regression models were developed for each climate. Using the t -statistic data obtained from regression analysis, it was determined if the dependent variables are influential in describing the variation of the dependent variable. The accuracy of the regression models was determined using coefficient determination (R2), F-test, and
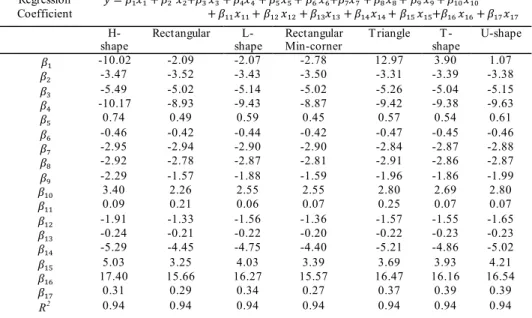
root mean squared error (RMSE). The developed regression equation for pred icting annual energy consumption and the corresponding coefficients of determinations are presented in Table 1 and Tab le 2. The regression coefficients presented here show how the annual energy consumption in the building increases or decreases with each combination of selected building envelopes.
T able 1. Regression coefficients and model precision in Billings Regression Coefficient ݕ ൌ ߚଵݔଵ ߚଶݔଶߚଷݔଷ ߚସݔସ ߚହݔହ ߚݔߚݔ ߚ଼ݔ଼ ߚଽݔଽ ߚଵݔଵ ߚଵଵݔଵଵ ߚଵଶݔଵଶ ߚଵଷݔଵଷ ߚଵସݔଵସ ߚଵହݔଵହߚଵݔଵ ߚଵݔଵ H-shape Rectangular L-shape Rectangular Min-corner T riangle T -shape U-shape ߚଵ -10.02 -2.09 -2.07 -2.78 12.97 3.90 1.07 ߚଶ -3.47 -3.52 -3.43 -3.50 -3.31 -3.39 -3.38 ߚଷ -5.49 -5.02 -5.14 -5.02 -5.26 -5.04 -5.15 ߚସ -10.17 -8.93 -9.43 -8.87 -9.42 -9.38 -9.63 ߚହ 0.74 0.49 0.59 0.45 0.57 0.54 0.61 ߚ -0.46 -0.42 -0.44 -0.42 -0.47 -0.45 -0.46 ߚ -2.95 -2.94 -2.90 -2.90 -2.84 -2.87 -2.88 ߚ଼ -2.92 -2.78 -2.87 -2.81 -2.91 -2.86 -2.87 ߚଽ -2.29 -1.57 -1.88 -1.59 -1.96 -1.86 -1.99 ߚଵ 3.40 2.26 2.55 2.55 2.80 2.69 2.80 ߚଵଵ 0.09 0.21 0.06 0.07 0.25 0.07 0.07 ߚଵଶ -1.91 -1.33 -1.56 -1.36 -1.57 -1.55 -1.65 ߚଵଷ -0.24 -0.21 -0.22 -0.20 -0.22 -0.23 -0.23 ߚଵସ -5.29 -4.45 -4.75 -4.40 -5.21 -4.86 -5.02 ߚଵହ 5.03 3.25 4.03 3.39 3.69 3.93 4.21 ߚଵ 17.40 15.66 16.27 15.57 16.47 16.16 16.54 ߚଵ 0.31 0.29 0.34 0.27 0.37 0.39 0.39 R2 0.94 0.94 0.94 0.94 0.94 0.94 0.94
T able 2. Regression coefficients and model precision in San Jose Regression Coefficient ݕ ൌ ߚଵݔଵ ߚଶݔଶߚଷݔଷ ߚସݔସ ߚହݔହ ߚݔߚݔ ߚ଼ݔ଼ ߚଽݔଽ ߚଵݔଵ ߚଵଵݔଵଵ ߚଵଶݔଵଶ ߚଵଷݔଵଷ ߚଵସݔଵସ ߚଵହݔଵହߚଵݔଵ ߚଵݔଵ
H-shape Rectangular shape L- Rectangular Min-corner T riangle shape T - U-shape
ߚଵ -10.02 -2.09 -2.07 -2.78 12.97 3.90 1.07 ߚଶ -3.47 -3.52 -3.43 -3.50 -3.31 -3.39 -3.38 ߚଷ -5.49 -5.02 -5.14 -5.02 -5.26 -5.04 -5.15 ߚସ -10.17 -8.93 -9.43 -8.87 -9.42 -9.38 -9.63 ߚହ 0.74 0.49 0.59 0.45 0.57 0.54 0.61 ߚ -0.46 -0.42 -0.44 -0.42 -0.47 -0.45 -0.46 ߚ -2.95 -2.94 -2.90 -2.90 -2.84 -2.87 -2.88 ߚ଼ -2.92 -2.78 -2.87 -2.81 -2.91 -2.86 -2.87 ߚଽ -2.29 -1.57 -1.88 -1.59 -1.96 -1.86 -1.99 ߚଵ 3.40 2.26 2.55 2.55 2.80 2.69 2.80 ߚଵଵ 0.09 0.21 0.06 0.07 0.25 0.07 0.07 ߚଵଶ -1.91 -1.33 -1.56 -1.36 -1.57 -1.55 -1.65 ߚଵଷ -0.24 -0.21 -0.22 -0.20 -0.22 -0.23 -0.23 ߚଵସ -5.29 -4.45 -4.75 -4.40 -5.21 -4.86 -5.02 ߚଵହ 5.03 3.25 4.03 3.39 3.69 3.93 4.21 ߚଵ 17.40 15.66 16.27 15.57 16.47 16.16 16.54 ߚଵ 0.31 0.29 0.34 0.27 0.37 0.39 0.39 R2 0.94 0.94 0.94 0.94 0.94 0.94 0.94
ݔଵ= Building Orientation, ݔଶ= Top Floor Batt Insulation, ݔଷ = Ceiling Interior Finish, ݔସ= Ceiling Insulation,ݔହ= Floor Construction, ݔ= Top
Floor Ceiling Exterior Insulation, ݔ= Top Floor Ceiling Interior Finish, ݔ଼= Ground Floor Construction, ݔଽ= Ground Floor Interior Finish, ݔଵ=
Floor Interior Finish,ݔଵଵ= Interior Wall, ݔଵଶ= Exterior Wall, ݔଵଷ= Roof Absorbance, ݔଵସ= Exterior Wall Absorbance, ݔଵହ= Roof Absorbance,
ݔଵ= Occupant Schedule, ݔଵ= Glass Category.
The residual error fro m fitted regression models are the differences between the observed response and the response predicted by the regression model at each co mbination of the independent variables. The residual errors should be normally distributed to comp ly with the basic assumptions of the regression model. Fig 2 p resents a sample residual error obtained fro m the regression models of office buildings with rectangular shapes in both climates, and it confirms that there are no specific patterns or relationships between residuals and the observed independent variables.
Fig 2. Sample residual plots 3.2 Regression Models Validation
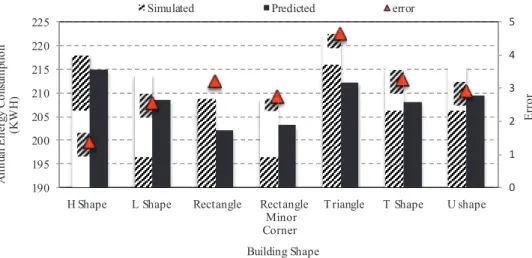
It is important to determine the feasibility and accuracy of the regression model. The regression model should be evaluated using a different set of dependent variables. The random nu mbers generated in Monte Carlo simulations was divided into two sets, 80% of the data set was used for training the regression model and the rest was used to evaluate the accuracy of the regression model. Fig 3 and Fig 4 co mpare the annual energy consumption based on the
-40 -20 0 20 40 60 0 2000 4000 6000 8000 R es idua ls ( K W h) Analyzed Data Billings -20 0 20 40 60 0 2000 4000 6000 8000 R es idua ls ( K W h) Analyzed Data San Jose
DOE-2 program and regression models for seven building shape scenarios considering similar building design and operations. The maximu m error o f 5% on total energy consumption was observed for the build ing with rectangle shape.
Fig 3. Regression model validation for seven building shapes located in Billings
Fig 4. Regression model validation for seven building shapes located in San Jose 4. Parametric building energy simulation and sensitivity analysis
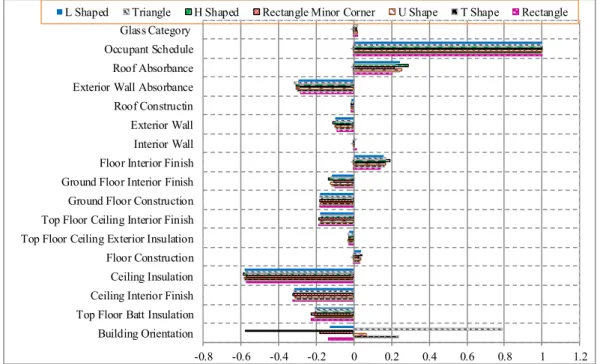
Regression models can not only be used to predict the annual energy consumption, but also as a tool to analyze the influences of design variables on energy consumption. The standardized regression coefficients are presented for seven building geo metries and both climate zones in Figs 5 and 6. Th is representation of standardized regression coefficients shows the most and least effective parameters for each shape and can be used to compare the effective parameters in each climate. As it can be seen, occupant schedule has the greatest influence on energy consumption in all the building shapes in both climate zones. Exterior wall absorbance, ceiling insulation, and ceiling interior fin ish in cold-dry climate and ceiling interior fin ish and ground floor construction in warm-marine have the highest impact on energy consumption.
0 1 2 3 4 5 6 7 8 9 0 40 80 120 160 200 240 280 320 360
H Shape L Shaped Rectangle Rectangle Minor Corner
Triangle T Shaped U Shaped
E rro r A nn ua l E ne rgy C ons um pt io n (K W H ) Building Shape
Simulated Predicted error
H Shape L Shape Rectangle Rectangle T riangle T Shape U shape Minor Corner 0 1 2 3 4 5 190 195 200 205 210 215 220 225 A nn ua l E ne rgy C ons um pt io n (K W H ) Building Shape E rro r
Simulated Predicted error
H Shape L Shape Rectangle Rectangle T riangle T Shape U shape Minor
Fig 5. Effect of building parameters on annual energy consumption for Billings
Fig 6. Effect of building parameter on annual energy consumption for San Jose
-0.8 -0.6 -0.4 -0.2 0 0.2 0.4 0.6 0.8 1 1.2
Building Orientation Top Floor Batt Insulation Ceiling Interior Finish Ceiling Insulation Floor Construction Top Floor Ceiling Exterior Insulation Top Floor Ceiling Interior Finish Ground Floor Construction Ground Floor Interior Finish Floor Interior Finish Interior Wall Exterior Wall Roof Constructin Exterior Wall Absorbance Roof Absorbance Occupant Schedule Glass Category
L Shaped Triangle H Shaped Rectangle Minor Corner U Shape T Shape Rectangle
-1.5 -1 -0.5 0 0.5 1 1.5
Building Orientation Top Floor Batt Insulation Ceiling Interior Finish Ceiling Insulation Floor Construction Top Floor Ceiling Exterior Insulation Top Floor Ceiling Interior Finish Ground Floor Construction Ground Floor Interior Finish Floor Interior Finish Interior Wall Exterior Wall Roof Constructin Exterior Wall Absorbance Roof Absorbance Occupant Schedule Glass Category
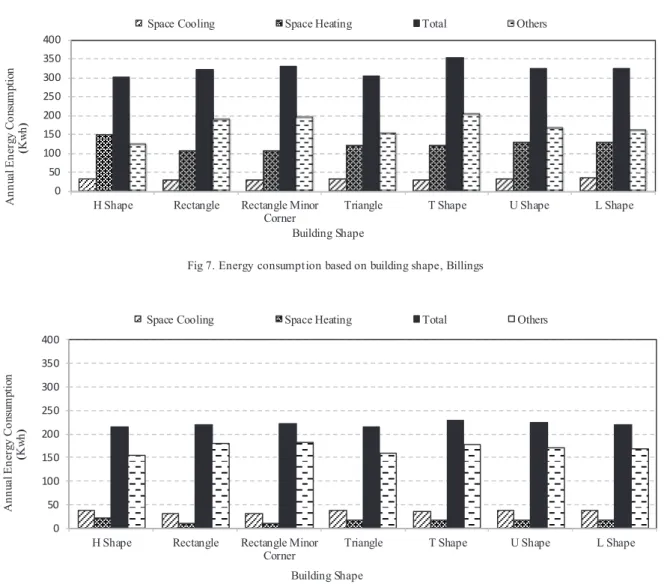
To study the effect of different building geo metries on energy co nsumption in both cold-dry and warm-marine climates, total annual energy consumption, heating, and cooling loads for the same design and operational conditions are presented in Figs 7 and 8. As it can be seen in the following figures, T-shape buildings have the highest while triangle buildings have the lowest total energy consumption in both climate zones.
Fig 7. Energy consumption based on building shape, Billings
Fig 8. Energy consumption based on building shape, San Jose 5. Conclusions
In this study, seven building shapes including rectangle, H-shape, L-shape, rectangle minus corner, triangle, T-shape, and U-shape in two d ifferent climate zones were considered. The developed models were beneficial for predicting energy performance of office build ings. The simplified build ing shape energy models provided a simple and practical tool that can be used during the design phase of the project to predict energy performance. The analysis of energy models shows that there is a strong interaction between building shapes, their locations, and level of energy consumptions. It also shows that in cold-dry climate zone the main source of energy consumption was related to space heating while there is not a significant differen ce between heating and cooling in warm-marine climate zone. It is important to note that T-shape buildings have the most total energy used in both climate zones.
0 50 100 150 200 250 300 350 400
H Shape Rectangle Rectangle Minor
Corner Triangle T Shape U Shape L Shape
A nnu al E ne rg y C ons um pt ion ( Kw h ) Building Shape
Space Cooling Space Heating Total Others
0 50 100 150 200 250 300 350 400
H Shape Rectangle Rectangle Minor
Corner Triangle T Shape U Shape L Shape
A nn ual E ner gy C ons um pt ion ( Kw h ) Building Shape
References
[1] EIA, US, EIA projects world energy consumption will increase 56% by 2040. US Energy Information Administration, 2013, Washington, DC.
[2] D.B. Crawley, J.W. Hand, M. Kummert, and B. T . Griffith, Contrasting the capabilities of building en ergy performance simulation programs. Building and environment 43, no. 4, 2008, 661-673.
[3] V. Bazjanac, Vladimir,Building energy performance simulation as part of interoperable software environments. Building and Env ironment 39.8, 2004, 879-883.
[4] Maile, T obias, Martin Fischer, and Vladimir Bazjanac. "Building energy performance simulation tools-a life-cycle and interoperable perspective." Center for Integrated Facility Engineering (CIFE) Working Paper 107 (2007): 1-49.
[5] J. Kneifel, Life-cycle carbon and cost analysis of energy efficiency measures in new commercial buildings. Energy and Buildings 42.3, 2010, 333-340.
[6] S. Asadi, S.S. Amiri, and M. Mottahedi, On the development of multi-linear regression analysis to assess energy consumption in t he early stages of building design. Energy and Buildings, 2014, 85, 246-255.
[7] M. Heidarinejad, Relative Significance of Heat T ransfer Processes to Quantify Tradeoffs between Complexity and Accuracy o f Energy Simulations with a Building Energy Use Patterns Classification. PhD dissertation, The Pennsylvania State University, 2014.