Universität Ulm| 89069 Ulm | Germany Faculty of
Engineering, Computer Science and Psychology Databases and Information Systems Department
Applying Process Mining Algorithms in
the Context of Data Collection Scenarios
Master’s thesis at Universität UlmSubmitted by: Marius Breitmayer
[email protected] Reviewer:
Prof. Dr. Manfred Reichert Dr. Rüdiger Pryss
Supervisor: Johannes Schobel 2018
c
2018 Marius Breitmayer
This work is licensed under the Creative Commons. Attribution-NonCommercial-ShareAlike 3.0 License. To view a copy of this license, visit http://creativecommons.org/licenses/by-nc-sa/3.0/de/ or send a letter to Creative Commons, 543 Howard Street, 5th Floor, San Francisco, California, 94105, USA.
Abstract
Despite the technological progress, paper-based questionnaires are still widely used to collect data in many application domains like education, healthcare or psychology. To facilitate the enormous amount of work involved in collecting, evaluating and analyzing this data, a system enabling process-driven data collection was developed. Based on generic tools, a process-driven approach for creating, processing and analyzing questionnaires was realized, in which a questionnaire is defined in terms of a process model. Due to this characteristic, process mining algorithms may be applied to event logs created during the execution of questionnaires. Moreover, new data that might not have been used in the context of questionnaires before may be collected and analyzed to provide new insights in regard to both the participant and the questionnaire.
This thesis shows that process mining algorithms may be applied successfully to process-oriented questionnaires. Algorithms from the three process mining forms of process discovery, conformance checking and enhancement are applied and used for various analysis. The analysis of certain properties of discovered process models leads to new ways of generating information from questionnaires. Different techniques for confor-mance checking and their applicability in the context of questionnaires are evaluated. Furthermore, new data that cannot be collected from paper-based questionnaires is used to enhance questionnaires to reveal new and meaningful relationships.
Acknowledgment
I would like to thank everyone who supported me during the creation of this thesis. I am grateful for the support received from the whole Institute of Databases and Informa-tion Systems. It is always a pleasure talking to you.
Prof. Dr. Manfred Reichert, whose lecture onBusiness Process Intelligence sparked my interest in process mining.
I would particularly like to thank Johannes Schobel for his excellent supervision. He always offered me great guidance and challenged me which was invaluable for this thesis.
Thank you to Kevin Andrews and Sebastian Steinau for your support.
A very important thank you also to all those who took the time to proofread this thesis. Your feedback and the time you invested helped to improve this thesis a lot.
Last but not least, I would like to thank my family who gave me the opportunity to study and fully supported me during this time.
Contents
1 Introduction 1
1.1 Problem statement . . . 1
1.2 Objective . . . 2
1.3 Structure of the Thesis . . . 3
2 Related Work 5 3 Fundamentals 9 3.1 Event Logs . . . 9
3.1.1 Prerequisites . . . 10
3.1.2 Log metrics . . . 10
3.1.3 Guidelines for Logging . . . 11
3.1.4 Logging Formats . . . 15
3.2 Nets . . . 17
3.2.1 Petri nets . . . 17
3.2.2 Extended Petri nets . . . 20
3.2.3 WorkFlow nets . . . 21 3.3 Decision Trees . . . 22 3.4 QuestionSys . . . 24 3.4.1 Problem definition . . . 24 3.4.2 Requirements . . . 25 3.4.3 Generated Logs . . . 26
3.5 Process Mining Tools . . . 28
3.5.1 ProM . . . 29
3.5.2 Disco . . . 29
3.5.3 Other Process Mining Tools . . . 30
4 Process Mining 33 4.1 Three Forms of Process Mining . . . 35
4.1.2 Conformance Checking . . . 36
4.1.3 Enhancement . . . 36
4.2 Process Mining across the BPM Lifecycle . . . 37
4.3 Why is Process Mining difficult? . . . 38
4.3.1 Four Quality Criteria of Process Mining . . . 39
5 Process Discovery 41 5.1 Algorithms . . . 42
5.1.1 The Alpha Algorithm . . . 43
5.1.2 Extensions of the Alpha Algorithm . . . 49
5.1.3 The Alpha Algorithm and its extensions in the Context of Data Collection Scenarios . . . 51
5.1.4 The Heuristic Miner . . . 53
5.1.5 The Heuristic Miner in the Context of Data Collection Scenarios . 59 5.1.6 The Fuzzy Miner . . . 60
5.1.7 The Fuzzy Miner in the Context of Data Collection Scenarios . . . 61
5.1.8 Genetic Process Mining . . . 63
5.1.9 Genetic Process Mining in the Context of Data Collection Scenarios 66 5.2 Comparison of different Process Discovery Algorithms . . . 69
6 Conformance Checking 71 6.1 Footprint Comparison . . . 73
6.1.1 Footprint Comparison in the Context of Data Collection Scenarios 75 6.2 The Token Replay Algorithm . . . 76
6.2.1 The Token Replay Algorithm in the Context of Data Collection Scenarios . . . 78
6.3 Alignments . . . 80
6.3.1 Alignments in the Context of Data Collection Scenarios . . . 81
6.4 The Linear Temporal Logic Checker . . . 83
Contents
7 Enhancement 87
7.1 Temporal Aspects . . . 88 7.1.1 Enhancing Questionnaires with Temporal Information . . . 89 7.2 Organizational Mining . . . 93 7.2.1 Organizational Mining in the Context of Data Collection Scenarios 94 7.3 Mining of Decisions . . . 95 7.3.1 Decision Mining in the Context of Data Collection Scenarios . . . . 96
8 Conclusion 99
8.1 Contribution . . . 99 8.2 Outlook . . . 100
1
Introduction
Even in the age of smartphones and tablets, most questionnaires are still performed via specially tailored "pen & paper" questionnaires. This paper-based approach results in a massive workload for all involved actors. Participants need to be at a certain place to fill in the questionnaire and organizers need to find a location, print the questionnaires, observe the process of filling in the questionnaire, and most importantly transfer the collected data into a format suitable for analysis afterward. As a result, data collection with paper-based questionnaires is not only very time consuming, but also error-prone. Errors may occur when participants answer questions or during the transfer of the collected data. Usually, people copy the paper-based collected data to electronic worksheets by hand. To make the whole data collection process more efficient, QuestionSys was developed at the Institute of Databases and Information Systems, Ulm University [1]. QuestionSysdefines questionnaires in terms of process models and executes them by a process engine [2]. As a result, event logs are generated while a questionnaire is answered, which enables the use of process mining algorithms. Process mining aims to discover, monitor and improve processes by extracting knowledge from event logs. By applying process mining algorithms in the context of data collection scenarios, new insights may be generated in regard to both the structure of a questionnaire as well as the participants.
1.1 Problem statement
When data is collected from questionnaires withQuestionSys, the efficiency of the data collection processes is increased [3]. Not only is the efficiency increased, but also new data, e.g. precise temporal information on each question and all answer changes to
a question, is collected and documented in event logs. The collection of such precise data from paper-based questionnaires is very difficult and therefore this kind of data is only used in few analyses so far. Oftentimes only rough estimations based on the number of words, questions, decisions or the type of question are conducted. As a result, valuable data which could be used to generate new and meaningful information about the participants of a questionnaire is lost.
The structure of a questionnaire may not always be ideal. Identifying at which point in the questionnaire participants decide to drop out can help to improve its structure and reduce the number of dropouts.
In contrast to questionnaires, there are well-established algorithms to analyze these characteristics in the context of business processes. Process mining offers a variety of different techniques from both process and data science to analyze business processes. Because QuestionSys is based on process technology, these techniques are made available for the analysis of questionnaires. Thus, a questionnaire can be discovered, monitored and improved similar to a business process. Process mining algorithms are often specially tailored towards specific scenarios and the variety of different algorithms is overwhelming.
1.2 Objective
The objective of this thesis is to provide an overview of various process mining algo-rithms and apply them in the context of questionnaires. To be more precise, process mining algorithms are applied to artificially created event logs. This allows evaluating the applicability of each algorithm in the context of questionnaires. Several process discovery algorithms can discover the control-flow of a questionnaire and indicate new and unknown behavior, e.g. long distance dependencies or loops.
Dropouts can be analyzed using algorithms from conformance checking, and this infor-mation may then be used to improve the questionnaire in future versions. Conformance checking algorithms may also be used to quantify the structural change between different questionnaires and questionnaire versions.
1.3 Structure of the Thesis Additionally, example scenarios on how to make former unused data usable with the help of process mining algorithms are shown. Although the event logs used in this thesis are not generated by a real questionnaire, the results may still be used as a proof that process mining can be successfully applied to questionnaires.
1.3 Structure of the Thesis
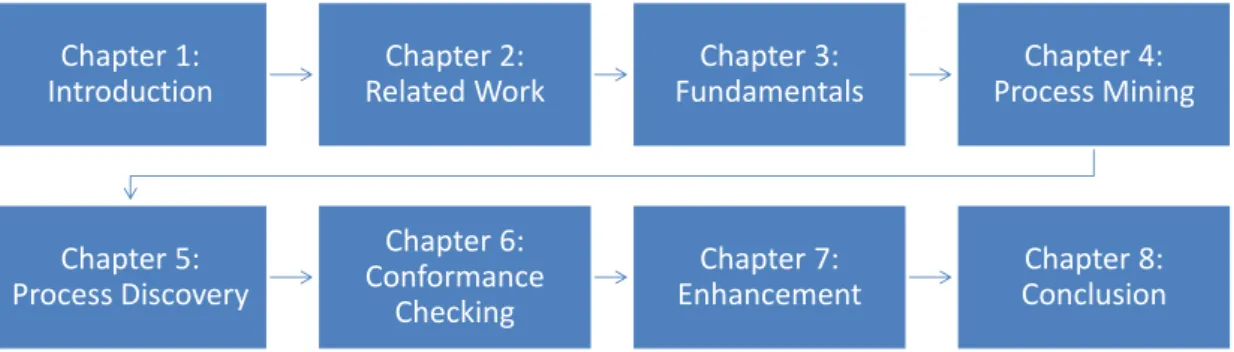
Figure 1.1 shows the structure of the thesis. Chapter 2 provides an overview of scenarios in which process mining has already been applied successfully.
Next, the fundamentals needed to understand the subsequent chapters are introduced in Chapter 3. This includes introductions to event logs, Petri and WorkFlow nets, QuestionSys, decision trees and an overview of available process mining tools.
The following chapter, Chapter 4, aims to provide a better understanding of process mining in general. First, a very brief introduction to the three forms of process mining is given and process mining is put into different contexts. Additionally, simplicity, fitness, generalization and precision, are introduced as four competing quality criteria for process mining.
Then Chapter 5 provides an overview of different process discovery algorithms from a control-flow perspective and evaluates their applicability in the context of questionnaires. This chapter includes various algorithms that follow different strategies to discover a process model.
Chapter 6 introduces different conformance checking algorithms. The algorithms focus on footprint comparison, token replay, alignments and an approach based on linear temporal logic.
While Chapter 5 focuses on the control-flow perspective, the focus of Chapter 7 is on algorithms that are able to support different perspectives such as time, resource or data. Finally, Chapter 8, contains the conclusion of the thesis and an outlook.
Chapter 1: Introduction Chapter 2: Related Work Chapter 3: Fundamentals Chapter 4: Process Mining Chapter 5: Process Discovery Chapter 6: Conformance Checking Chapter 7: Enhancement Chapter 8: Conclusion
2
Related Work
The objective of this chapter is to give an overview of different scenarios in which process mining was successfully applied.
Mans et al. [4] demonstrate the applicability of process mining in the context of a Dutch hospital. Process mining algorithms are applied to obtain meaningful knowledge about the typical paths followed by particular patient groups within the hospital. Insights on the process was obtained by looking at the control-flow, organizational and performance perspective of the process and initial results are presented.
An approach to assess the efficiency of emergency call centers in France with the help of process mining algorithms is described by Lamine et al. [5]. The effectiveness of the response to an incoming emergency call impacts the quality of each call center. Additionally, the main information used by the French government to distribute their funding is the quality of service. To meet the government’s requirements, it is crucial to understand the process. Process mining algorithms are applied to obtain meaningful knowledge about this process. Discowas used to discover the control-flow perspective of the process and also identified that the performance mainly depends on certain resources. This knowledge was then used to improve the process.
Van der Aalst et al. [6] apply process mining algorithms in the context of 12 provincial offices of the Dutch National PublicWorks Department. Event logs from an operational WorkFlow Management System supporting the process of invoice handling within the organization are used to illustrate the practical application of process mining. The results of process mining algorithms enabled the management of the department to both formulate and target specific organizational measures and can be used to support these measures. From the process mining point of view, the two most important outcomes are
that both the discovery of the main flow and the combination of different perspectives can be used to better understand a process. In addition, it became evident that real-life event logs often contain loops, incompleteness, and noise.
Bala et al. [7] extend the field of process mining towards mining of software development processes. Project managers of software development projects may obtain valuable new insights by extracting process knowledge from the historical data of software artifacts. Mining the time perspective allows them to monitor whether the software is developed according to the predefined plan and also identify which tasks resulted in a delay. Mining the organizational perspective of a software development process can generate valuable insights into the different skill profiles within the project team. Moreover, these profiles can be used to check if any contractual agreements have been violated.
The focus of Andrews et al. [8] is more on the data quality aspect of process mining. The authors apply process mining algorithms on the process of transporting trauma patients to a hospital in Queensland.
A review of 74 different articles on process mining in the healthcare domain is provided in [9]. Rojas et al. analyze each of the case studies based on eleven aspects. These aspects are: process type, data type, frequently posed questions, process mining per-spectives, tools, algorithms, methodologies, implementation strategy, analysis strategy, geographical analysis and the medical field. This literature review indicates that process discovery algorithms are mostly used to discover the control flow perspective and that frequently applied algorithms can all adequately deal with noise and incompleteness of event logs. Moreover, the literature review identifies that conformance checking and performance analysis, as well as event logs containing additional data, are some of the emerging trends of process mining.
In [10], Mans et al. show that process mining techniques may be applied successfully to clinical data. The authors use process mining algorithms to get a better understanding of how different groups of patients take different clinical pathways across different hospitals. Comparing the paths across different hospitals allows to discover different treatment practices and also highlight unexpected behavior.
The applicability of process mining to less structured processes is demonstrated by Rozinat et al. in [11]. Process mining algorithms are applied to the test process of wafer steppers in ASML, the leading manufacturer or chip-making equipment. The test process for wafer steppers consists of three phases. After finishing the three phases, the wafer stepper is taken apart, shipped to a customer and reassembled. Afterward and some of the tests are repeated. The nature of wafer steppers being a highly specialized product also changes the structure of the event log used for process mining. Instead of many instances with only a few events, the test process consists of only a few instances with many events. This makes new algorithms necessary that are able to deal with less structured processes.
Process mining can also be used in the context of more flexible processes. Guenther et al. [12] describe two approaches to discover changes within a process. The discovered change processes provide an overview of all changes that happened so far within a process. Process mining can be used to better support truly flexible processes by helping to understand why and when certain changes become necessary.
Under the sectionProcess Mining Case Studies1, theIEEE CIS Task Force on Process Mining offers an overview of different case studies on process mining. The case studies cover a variety of industries such as service, manufacturing, healthcare, construction, utility, or chemical. As of today (02.09.2018), the webpage contains 35 case studies. Additionally, an extensive list of process mining applications can be found which contains 117 entries of application scenarios of process mining2.
The great variety of different scenarios in which process mining algorithms have already been applied successfully proves that process mining is of great relevance when analyz-ing and improvanalyz-ing processes. Although a wide range of different application scenarios is already identified, to the best of my knowledge, there are currently no approaches that use process mining in the context of questionnaires.
1https://www.win.tue.nl/ieeetfpm/doku.php?id=shared:process_mining_case_
studies, last accessed 02.09.2018
2
https://www.win.tue.nl/ieeetfpm/lib/exe/fetch.php?media=casestudies: hspi_process_mining_database_correct_v0.2.pdf, last accessed 02.09.2018
3
Fundamentals
This chapter outlines the relevant background information which is important to under-stand the rest of this thesis. The first section explains event logs which are the input for process mining algorithms. This section includes prerequisites, metrics that can be derived directly from the event log, established guidelines for logging in the context of process mining and a short overview of logging formats. The second section introduces the concept of nets, especially Petri nets and WorkFlow nets, which are important to understand the output generated by process mining algorithms. Section three briefly introduces the concept of decision trees, which are used in later chapters of this thesis to enhance a process model. The following section provides a short overview of Ques-tionSyswhich is a system that represents questionnaires as process models, allowing to apply process mining algorithms. In the last section, an overview of different process mining tools is provided.
3.1 Event Logs
The focus of this section is on event logs representing the input side of process mining. The goal of process mining is to discover, monitor and improve real processes while using knowledge which is already available in today’s information systems. To do so, event logs are used as an input for a variety of process mining algorithms which are then able to generate and analyze a process model based on the information contained in the event log. This section provides the necessary knowledge to both understand the concept of event logs as well as the fundamentals of logging for later chapters. The first subsection explains the prerequisites, while the second subsection provides
process characteristics that may already be derived from the event log itself. Then twelve guidelines are introduced which aim to create event logs that may be used as a good starting point for process mining [13]. In the last subsection, XES is introduced as the de facto standard logging format for process mining.
3.1.1 Prerequisites
Event logs usually serve as the starting point for process mining. A process may be described by a multiset process instances, also called cases or traces. Every process instance represents a concrete execution of the process. Each process instance may then be described by the events or activities which have been executed within this specific instance. To give an example in the context of questionnaires, a process instance may be the questionnaire filled in by a specific user and an activity then corresponds to a specific question answered by that user. In order to reliably use an event log for process mining, it must be possible to order the activities within each process instance. Without ordering the activities in a case it is impossible to discover any causal relationships such as i.e. activityAis always followed by activityB. As a result, the bare minimum information that has to be stored in the event log are a case identifier and ordered activities which have been executed within this case [14]. If the activities are not or only partially ordered, timestamps captured by the event log may be used to order the activities. Additionally, timestamps are very helpful when analyzing performance-related properties of the process. Different properties may also be derived from the event log itself. A brief overview of these properties is given in Section 3.1.2. If the event log contains more than the minimal information, this additional information can be used to enhance the process model by e.g. calculating the average time needed per activity, or discovering which data influences a specific decision during process execution.
3.1.2 Log metrics
In the context of process mining, it is important to understand that the complexity and size of an event log are determined by different factors. Therefore, multiple event log
3.1 Event Logs metrics are needed to adequately characterize an event log used for process mining. These metrics can also be used to compare different event logs of the same process with each other.
A variety of different metrics such as the 1. Number of cases
2. Average/Minimal/Maximal/Standard deviation of each trace 3. Number of distinct activities (also applicable per case) 4. Number of distinct cases
5. Number of events
6. Number of direct successions 7. Number of start/end activities
have been defined in [14] on the pages 364-368, and thus are not further explained in this thesis.
These event log metrics can be used to summarize a considerable amount of data into only a few key figures. Not only do these metrics allow to challenge big logs with many cases and activities, but also allow to get a better understanding of the event log. Please note that the number of distinct activities is often times a lot smaller than other metrics such as the number of cases or the number of events. While some mining algorithms (i.e. the Alpha Algorithm or the Heuristic Miner) are based on a directly-follows graph, iterating through the event log is typically the most time-consuming task during the execution of such an algorithm. As a result, it is important to have a good understanding of the event log prior to starting with the actual mining of the process model.
3.1.3 Guidelines for Logging
This section introduces twelve guidelines which aim to create a good starting point for process mining. They have been established in [13].
Before heading towards the guidelines, some clarification is necessary. No assumptions on the underlying technology used to record an event log is made, and the definitions are rather loose. For this reason, it is possible to apply the guidelines to all event logs related to process mining. Within this subsection events are described by references and attributes and simply refer to "things that happen". A reference has a name and an identifier which both refer to some object [13]. An object could, for example, be a person, a case or a ticket. Attributes consist of a name and a value, e.g. time = "08-05-2018 12:46:21" or name = "Marius".
When using "raw events" to create an event log four steps are necessary. 1. Select all process relevant events
2. Create process instances by correlating events 3. Order events within a process instance
4. Select or compute attributes (resource, data, ...) based on raw data
The following guidelines are not very specific because they aim to improve logging itself. The guidelines should point out problems related to the input of process mining and offer guidance on how to avoid these problems so that the event log can be used to better instrument software [13].
GL1 Reference and attribute names should have clear semantics.
This guideline refers to the situation that references and attributes may be inter-preted differently by different people involved during creation and analysis of event data. To avoid this, each stakeholder should interpret event data in the same way.
GL2 There should be a structured and managed collection of reference and attribute names.
A collection of references and attributes names allows each stakeholder to look up the meaning of them. In an ideal scenario, the names are grouped hierarchically, and an addition to the collection can only be made after there is a general consen-sus on both its value and meaning. Organization or domain specific extensions can also be realized with extension mechanics provided by formats like XES [15].
3.1 Event Logs
GL3 References should be stable.
This guideline refers to the problem that unstable references make the analysis unnecessarily complicated. If the identifier in the event log depends on the con-text or is reused, analyzing the event log gets much more complicated as these dependencies need to be identified and corrected first. For example, the event log identifiers should be the same regardless of the language setting, the region or time of the system.
GL4 Attribute values should be as precise as possible.
The more precise a value is, the more reliable it can be used, not only for process mining. If the desired precision cannot be guaranteed, for example, if only a date instead of a timestamp is available, this should be indicated in the event log using a qualifier.
GL5 Uncertainty with respect to the occurrence of the event or its references or at-tributes should be captured through appropriate qualifiers.
Even if this sounds similar toGL4, there is a difference between uncertainty and imprecision. Some values may be less reliable due to communication errors, but their precision is still fine.
GL6 Events should be at least partially ordered.
Process mining algorithms with a local strategy, like the Alpha Algorithm, use the ordering of the activities within each instance to derive dependencies before generating the process model. As a result, it is important to order the events in the event log, either explicitly via a list, or implicitly through timestamps. It is possible to order events based on observed causalities, for example, if the recorded timestamps are unreliable or imprecise. This is both unnecessary and cumbersome and can be prevented by ordering the event log during collection.
GL7 If possible, also store transactional information about the event.
Transactional information of an event may be start, complete, abort, schedule, assign, suspend, resume, withdraw, etc.. This allows for the computation of activity durations. To make such a computation easier, it is recommended to store activity
references to relate events belonging to the same activity instance. Leaving out this reference may result in uncertainties about which events belong together, and which start event corresponds to which complete event.
GL8 Perform regularly automated consistency and correctness checks to ensure the syntactical correctness of the event log.
Checking for missing references, attributes or names which are not agreed upon (seeGL2) helps to keep the quality of the event log high over time. Assuring the quality of an event log is a continuous process to maintain a high data quality within the event log.
GL9 Ensure comparability of event logs over time and different groups of cases or process variants.
Over time the logging itself should not change. To keep results from process mining comparative, it is essential that the same logging principles are used. Leaving out some events for a group of cases even though they did occur in reality may also lead to differences that do not actually exist. Even worse, this may lead to wrong conclusions based on the event data.
GL10 Do not aggregate events in the event log used as input for the analysis process.
The event data contained in the event log should be as"raw" as possible, because aggregation can also be done during analysis, but cannot be undone if the aggre-gation was done earlier. Additionally, aggregating during analysis increases the reproducibility of the generated results and allows to use the same data within different contexts.
GL11 Do not remove events and ensure provenance.
Being able to reproduce results is key for process mining. Therefore, deleting objects from the event log may lead to misleading analysis results. Instead of removing the object, marking it as not relevant allows to not take these objects into account while guaranteeing reproducibility. This is called a "soft delete". Instead of deleting a questionnaire instance, it might be aborted, or a concert is canceled, an
3.1 Event Logs employee is fired, a student is exmatriculated, a car is scrapped, or an invoice is paid.
GL12 Ensure privacy without losing meaningful correlations.
Especially in the context of questionnaires sensitive or private data is collected, and this sensitive information should be removed as soon as possible. No analysis should be conducted while sensitive or private data is still contained in the event log. The challenge is, to find a suitable trade-off between privacy and process model quality. If sensitive information is removed, no correlations should be removed because this would result in bad process models. A suitable trade-off between privacy and analysis may be provided by hashing the sensitive information.
3.1.4 Logging Formats
Being able to fulfill the requirements identified in Section 3.1.3, a data format was needed to store event logs. In 2003 Mining eXtensible Markup Language (MXML) emerged and was adopted for process mining in 2005 [16]. From that point in time, it has been the standard format for storing and exchanging event logs until it was replaced by eXtensible Event Stream (XES) in 2010 [15].
The main purpose of XES is for process mining, however, it is also suitable for data mining, statistical analysis, and text mining. Four guiding principles have been used to design the XES format:
1. SimplicityInformation should be presented in the simplest possible way. XES logs should be easy to generate and parse while keeping the log readable for humans. 2. FlexibilityIt should be possible to capture event logs from any background.
3. ExtensibilityIt must be easy to extend the standard in a transparent way in the future while maintaining both forward and backward compatibility.
4. ExpressivityTo keep the loss of information as minimal as possible, all information elements must be strongly typed.
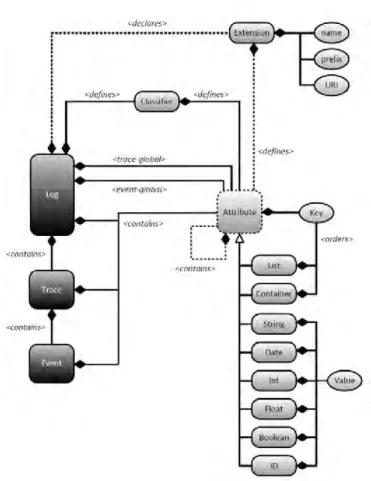
Figure 3.1 describes the complete meta-model for the XES standard. In comparison to MXML, the XES format is less restrictive and it is easier to extend the format. A XES document contains one log which again contains any number of traces which are described by a sequential list of events that correspond to a case. As described earlier, this is the exact representation of a process. A process log consists of multiple traces, earlier introduced as instances, which again consist of multiple events, also known as activities. Furthermore, does the XES format support the representation of various attributes which can be used to document additional data which is not part of the previously explained minimal information of an event log. For a more detailed description of the XES format, please be revered to [15].
Figure 3.1: The UML 2.0 class diagram for the complete meta-model for the XES stan-dard [15]
3.2 Nets Although XES has been established as the standard format for process mining by the IEEE Task Force on Process Mining in September 2010, in reality, event logs will not always be in that format. Therefore, process mining tools such asProM offer an import plug-in that can convert different formats such as CSV-files or MS-Access files into an XES conform file. During this thesis, some event logs will be CSV-files, and therefore this plug-in will be used to generate an XES conform event log before applying process mining algorithms.
3.2 Nets
One of the goals of process mining is to extract a process model from an event log. To be able to get a deeper understanding of process mining, it is essential to first understand the underlying concepts of both Petri nets and WorkFlow nets. There are a multitude of other modeling languages, but most process mining algorithms use Petri nets to represent the process model [17]. To be more precise, a subclass of Petri nets called WorkFlow nets [18] is used because the additional characteristics suit the characteristics of business processes. It is easy to translate a Petri or WorkFlow net into other modeling languages likeBPMN 2.0orEPC. An overview of different process modeling languages can be found in Section 3.2 of [14]. Moreover, Petri and WorkFlow nets are a well-established concept and many different characteristics can be proven on them. Proving such characteristics on other process modeling notations may be much more difficult. The first section introduces the concept of Petri nets, including the different node types and the firing rules. The following section introduces the concept of Extended Petri nets, and the last section introduces WorkFlow nets.
3.2.1 Petri nets
Petri nets originate from the dissertation of Carl Adam Petri back in 1962 [19]. Since then a plethora of different use cases have been identified for both academic and industrial purposes. For a more detailed overview about the development of Petri nets please be referred to [20].
A Petri net is a directed bipartite graph that consists of two different node types called places and transitions. Places are represented by circles and transitions by rectangles. The connection between places and transitions is represented by flow relations, and connections between two similar node types are not allowed. In this thesis, the flow relations are denoted as arcs or edges, and the expressions are used as synonyms. There exist some extended definitions of Petri nets with weight functions and an initial marking, but the provided definition is most commonly used in the context of process mining [14]. A definition of Extended Petri nets can be found in Section 3.2.2.
Definition 1. Petri Net [19, 14, 21]
A Petri net is a triplet N =(P, T, F) where:
1. P ={p1, p2, ..., pm}is a finite set of places,
2. T ={t1, t2, ..., tn}is a finite set of transitions such thatP ∩T =∅and
3. F⊆(P×T)∪(T ×P)is a set of directed arcs called flow relation or edge
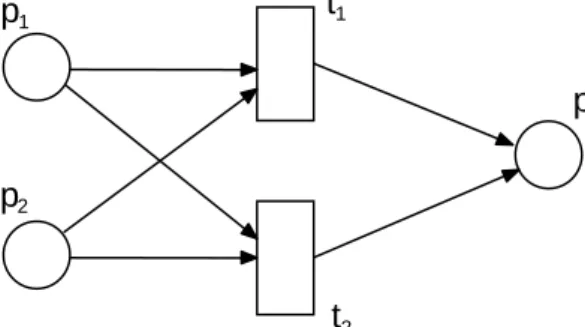
In Figure 3.2 an example Petri net is shown. The displayed Petri net consists of three different places, denoted asp1, p2, p3, two transitions denoted ast1 andt2, as well as six
edges. The edges can be identified by the places and transitions they connect. As a result, the edges are(p1, t1),(p1, t2),(p2, t1),(p2, t2),(t1, p3)and(t2, p3).
t 1
t 2
p 1
p 2
p 3
Figure 3.2: An example Petri net with two transitions, three places and six edges
The biggest advantage of Petri nets is its ability to represent dynamic behavior by the so-called firing rule. In the context of process mining, the different states are able to
3.2 Nets represent various stages of the process execution. Moreover, a Petri net can represent different behavior such as concurrency or choice which are also commonly used in processes.
Firing Rule for Petri nets
Petri nets can describe behavior by states and their changes. One or more than one token represents the current marking of the net. To simulate dynamic behavior a state or a marking within a Petri net is changed according to the firing rules. Before formalizing the firing rules the notation of input and output places needs to be defined.
Definition 2. Input and output places [14]
Let N = (P,T,F) be a Petri net. Elements ofP ∪T are called nodes.
1. A place x is an input place of a transitiony if and only if there is a flow relation fromxtoy(i.e.,(x, y)∈F).
2. A place xis an output place of a transitiony if and only if there is a flow relation fromy tox(i.e.,(y, x)∈F).
3. For any nodex∈P∪T,•x={y |(y, x)∈F}andx•={y|(x, y)∈F}
Recalling Figure 3.2,p1 andp2are input places fort1 andt2 andp3 is their output place.
After introducing the concept of input and output places, the firing rules can now be defined.
Definition 3. Firing Rules for Petri Nets [22]
Let (N, M) be a marked Petri net with N = (P,T,F).
1. A Transition t∈T is enabled if and only if each input place contains at least one token.
2. An enabled transition may or may not fire (depending on whether or not the event actually takes place).
3. Firing an enabled transitiontremoves one token from each input placepoft, and adds one token to each output placepoft.
In other words, a transition may only fire if there is at least one token in each of its input places. When firing, a token is consumed from each of the input places of the transition and a token is produced in each of its output places [20].
3.2.2 Extended Petri nets
Petri nets are a very simple representation and therefore not able to express all constructs that are present in real-life workflows. As a result, some extensions have been made to provide either more convenience (e.g. by adding arc weights) or increase expressiveness (e.g. reset and inhibitor arcs).
Definition 4. Extended Petri net [23]
An extended Petri net is a tuple (P,T,F,W,A,L,R,H), where: 1. Let (P,T,F) be a basic Petri net,
2. W:F→N be a weight function 3. A is a set of (activity) labels,
4. L∈T→A∪{τ}is a labeling function
5. R∈T→2P is a function defining reset arcs, and 6. H∈T→2P is a function defining inhibitor arcs.
A weight function W:F→N can allocate weights to edges which allows modeling more behavior, in a sense that a transition can now consume more than one token from an input place. In addition, a transition can only fire if all input places contain enough token. If the weight of the edge is set to 2, then the input place needs to contain 2 tokens for the transition to fire.
Reset arcs R ∈ T → 2P deal with cancellation behavior. It connects a place with a transition, with the semantic of removing all tokens from the place once the transition fires [24].
Similar to traditional edges, inhibitor arcs H∈T→2P also go from a place to a transition. Regarding their behavior, inhibitor arcs can be seen as the inverse of a normal arc. The
3.2 Nets transition is not enabled if the number of tokens in the place is at least as high as the weight of the inhibitor arc. In the default case, the transition may only fire if the place that is connected via an inhibitor arc is empty. Graphically, inhibitor arcs are represented as edges with a circle at the transition [25].
3.2.3 WorkFlow nets
Event logs used for process mining represent different instances of the same process which has been executed multiple times. In the context of a questionnaire, this could represent different participants filling in a similar questionnaire independently. A ques-tionnaire usually has a clear starting and a clear ending point, e.g. the first and last question. Similar to this, business processes usually also have one start and end activity. A WorkFlow net is a subclass of Petri nets, with two special places: the source placei
and the sink placeo. The source place represents the begin of a process and the sink place represents the end of it [22]. This characteristic of WorkFlow nets matches the behavior observed by questionnaires and business processes.
Definition 5. WorkFlow net [23]
An Extended Petri net PN = (P,T,F,W,A,L,R,H) is a WorkFlow net if and only if 1. There is a single source placei, i.e.,{p∈P| •p=∅}={i}
2. There is a single sink placeo, i.e.,{p∈P| •p=∅}={o}
3. Every node is on a path fromitoo, i.e. for anyn∈P∪T : (i, n)∈F∗and(n, o)∈
F∗ whereF∗is the reflexive transitive closure of relation F.
4. There is no reset arc connected to the sink place, i.e. ∀t∈To /∈R(t).
The same definition can also be applied to normal Petri nets (PN = (P,T,F)) with the simple adaptation that there are no reset arcs in the first place with makes point four obsolete. This definition can be found in [14].
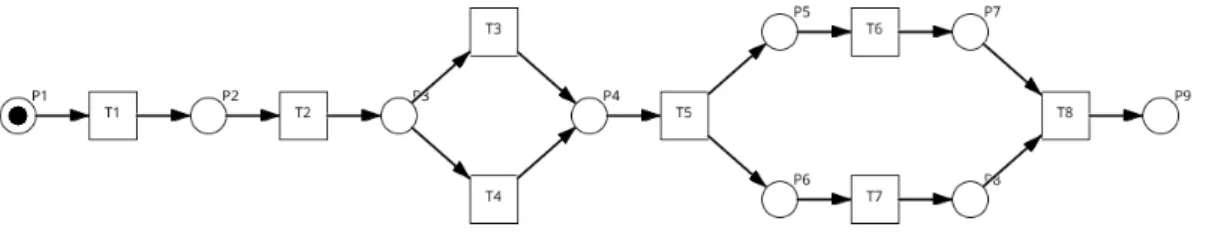
An example WorkFlow net is shown in Figure 3.3. This WorkFlow net consists of nine different places (P1-P9), eight different transitions (T1-T8) and 18 flow relations. Place
P1 represents the source placei, while place P9 represents the sink placeo. Moreover, P1 contains a token. This token, represented by a black dot, enables transition T1. Firing transition T1 results in the token from P1 being consumed, and a new token being produced in place P2. The token in P2 does then enable transition T2. After firing T2, both transitions T3 and T3 are enabled, but only one token may be consumed. As a result, a choice between firing transition T3 or T4 has to be made. This represents the choice between two activities in a process of which only one can be executed. Moreover, similar to Petri nets, WorkFlow nets also allow modeling concurrency. This is displayed in Figure 3.3 after firing transition T5. A token is produced in both places P5 and P6, which enables both transitions T6 and T7.
Figure 3.3: A Workflow net with nine places (P1 - P9) and eight transitions (T1 - T9) and a token in P1.
3.3 Decision Trees
In the context of data mining, decision trees are a well-developed approach for clas-sification [26, 27]. In Figure 3.4, an example decision tree is provided that classifies fruits. Please note that this is not a general representation of nodes and branches and that different representations exist. A decision tree consists of a root node, inner nodes, branches, and leaf nodes.
Inner nodes denote a test on an attribute and are represented with red borders in Figure 3.4. An example of an inner node is the"Taste?"-node. The root node is a special type of inner node and serves as the starting point of the decision tree. As a result, it is located at the top of the tree. In Figure 3.4 the root node is the"Color?"-node.
3.3 Decision Trees Branches represent the possible outcomes of a test on an inner node. In Figure 3.4 the branches are represented as grey labels on the lines connecting nodes. An example is the labelyellow connecting root node with the inner node"Shape?". The last element of decision trees are leaf nodes, which indicate a class of the object. In Figure 3.4 leaf nodes are indicated by green borders. A lot of algorithms that are capable of constructing a decision tree have been developed, such as the ID3 algorithm [28] or its extension the C4.5 algorithm [29].
In the context of process mining, a decision tree can be seen as a visual representation of a set of disjoint decision rules leading to a certain decision within the process instance. These rules can again be used as a classifier for the given data set. Based on an observed set of attribute values, each decision rule can predict a target class [30]. A target class then represents the decision made at the respective decision point during process execution.
Color?
Size? Shape? Size?
Size? Taste?
Watermelon Apple Grape
Grapefruit Lemon Banana
Cherry Grape
Apple
green yellow red
big medium small round bent medium small
small
big sweet sour
… …
Inner node: test of an attribute Leaf node: class of the object
3.4 QuestionSys
The previous sections focused on the input, see Section 3.1, and output, see Section 3.2, of process mining. The goal of this section is to create an understanding of the various data collection scenarios. A data collection scenario represents a process-oriented questionnaire that has been executed within theQuestionSysframework.
The main goal ofQuestionSysis to enable people without programming skills to develop data collection instruments. Furthermore, they should be empowered to deploy and execute these instruments on mobile devices. Additionally, the cost of data collection should be decreased by reducing development time and cost, while also increasing the data quality [32].QuestionSysis a generic and flexible questionnaire system which enables process-driven mobile data collection. Mapping the questionnaire to a process model allows its execution by a lightweight process engine, even on mobile devices [2]. Due to the mapping of the questionnaire to a process model, process mining algorithms may be applied to event logs generated during the execution.
The first subsection briefly explains the problem solved by QuestionSys, the second subsection describes the requirements towards the system. The last subsection explains the different kinds of event logs generated byQuestionSys.
3.4.1 Problem definition
Collecting data from paper-based questionnaires is a very cumbersome and error-prone task due to people having to copy information by hand. Errors may occur when filling in the questionnaire, transferring the data for analysis or during evaluation. With the help ofQuestionSys, these errors can be reduced and therefore data can be collected both more conveniently and with a higher quality compared to paper-based approaches. Furthermore, a large amount of data may be collected in a rather short time period [3]. In addition, data such as the exact time needed to answer a questionnaire or a specific question can be collected with a higher precision compared to paper-based approaches. Moreover, new data can be collected on the behavior of participants during the questionnaire.
3.4 QuestionSys Examples of such data may be the number of answer changes within a specific question or the exact moment in which the participant dropped out of the questionnaire. This data may then be used to get more sophisticated insights into the results, but also improve the structure of the questionnaire itself.
3.4.2 Requirements
Based on different case studies, expert interviews and literature analyses regarding the implementation of mobile data collection applications [33, 34] five different requirements for the mobile support of electronic questionnaires have been defined in [35].
1. Mobility
The data collecting process usually requires extensive interactions. In many situations, computers are disturbing when filling out a questionnaire. To enable more convenient and flexible data collection, the device needs to be portable. 2. Multi-User support
Because different users may interact with the same device or questionnaire, multi-user support is crucial. Additionally, it must be possible to differentiate between different user roles such as interviewer or subject, and users should be able to possess multiple roles.
3. Support of Different Questionnaire Modes
In general, a questionnaire may be used in two different modes: interview and self-rating. Based on the mode, a questionnaire may diverge in the order the questions are posed, the possible answers or additional features. As a result, mobile questionnaire applications should be able to support both modes.
4. Multi-Language Support
Since actors may understand different languages, the person accessing the ques-tionnaire should be able to choose his preferred language. This increases the number of possible participants.
5. Maintainability
Questionnaires may change over time. As a result, it should be possible to quickly change both structure and context of the questionnaire without the need of programming skills.
These requirements are also important in regard to process mining. The first requirement allows answering a questionnaire with a mobile device, e.g. a smartphone or a tablet. Sensors within smartphones and tables can be used to collect additional information about the environment in which the questionnaire is answered [36].
The requirement of Multi-Language Support is also important in the context of process mining. As described in guideline three in Section 3.1.3, references should be stable. In other words, references should be independent from the language setting of the questionnaire. To be able to analyze questionnaire instances collected in different languages, it is important to either translate the answers beforehand or use language independent identifiers for the representation of each question and answer in the event log.
3.4.3 Generated Logs
As briefly described in previous sections, more data may be generated from a question-naire withQuestionSyscompared to its paper-based equivalent.
When answering a questionnaire data is collected and documented within event logs. In the context ofQuestionSys, different types of event logs are generated:
1. Processlog
This event log documents at what time a specific node is started, processed, executed and destroyed.
2. Resultslog
This is a digital representation of the completed paper-based questionnaire. The fact that the recorded data is in a digital format from the get-go not only reduces media disruption but also prevents errors when copying data into a digital system.
3.4 QuestionSys 3. Historylog
In comparison to the second event log, this one also contains all answers given, even if they have not been submitted or changed. It is not possible to record this kind of data from paper-based questionnaires. As a result, there is no well-established way of analyzing such data.
These different logs are used as input when creating the synthetic event logs used for process mining within this master’s thesis.
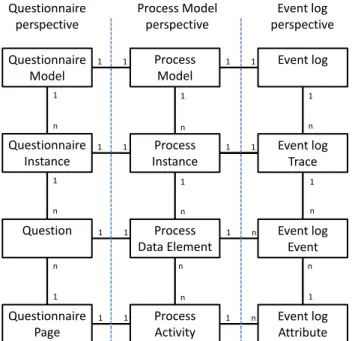
Note that the process engine ofQuestionSys does not allow for any deviations from the specified process model [2, 37]. As a result, all event logs used in this thesis can be considered both complete and noise free. Nevertheless, different algorithms are presented that are also able to deal with both noise and incompleteness of event logs. Figure 3.5 shows the mapping of questionnaire elements to the elements of a process model and event log. This mapping is used in the context of this thesis, to better analyze each question. Using this mapping allows discovering each question instead of each questionnaire page. It is also possible to map the questionnaire pages to the event log event, but this would then restrict the analysis to the page level instead of each question. Moreover, some process discovery algorithms like the Fuzzy Miner are able to cluster activities in the process model which can be used to represent the pages.
Additional data, such as timestamps or answers given, are represented as data attributes of the corresponding event.
Questionnaire Instance Process Instance Event log Trace Questionnaire Model Process Model Event log Question Process Data Element Event log Event Questionnaire Page Process Activity Event log Attribute 1 1 n 1 1 1 1 n n 1 n n n n n n n 1 1 1 1 1 1 1 1 1 1 1 1 1 1 n 1 n Questionnaire perspective Process Model perspective Event log perspective
Figure 3.5: Mapping a questionnaire to an event log
3.5 Process Mining Tools
To be able to apply process mining algorithms successfully, tools supporting these algorithms are necessary. In the academic context, the lion’s share of research in the area of process mining is conducted by using and also extending the Process Mining framework (ProM). Many different commercial tools such asDiscoorCelonisprove that process mining may also solve problems occurring outside of the academic context. This section will only give a very brief overview of two process mining tools,ProM andDisco, followed by a short listing of other process mining tools to illustrate the variety of different tools.
The goal of this section is to give a brief overview of the available tools and not to give any recommendation or compare the tools. Every tool certainly has its strengths and weaknesses. For a more detailed overview of available process mining tools, please be referred to Chapter 11 of [14].
3.5 Process Mining Tools
3.5.1 ProM
The Process Mining framework (ProM) is an Open Source framework developed by the TU Eindhoven which provides a platform for users and developers of process mining algo-rithms. It can be freely downloaded from www.promtools.org or www.processmining.org. Back in 2002 several simple process mining tools were available [38]. As it did not make sense to build a new tool for each new algorithm,ProM was developed as a "plug-able" environment for process mining [39]. In 2004, the first version ofProM (ProM 1.1) was released, which already contained 29 plug-ins. Over time, more and more plug-ins have been developed and added toProM. The release ofProM 5.2 in 2009 already contained 286 plug-ins. In 2016, there are over 1500 plug-ins available, including deprecated ones, which is why it is impossible to provide a complete overview ofProM’sfunctionalities [14]. With the release ofProM 6, the execution of plug-ins can be distributed over multiple computers to increase performance [40]. Unfortunately, not all plug-ins fromProM 5.2 have been re-implemented yet, so at some point, it might be necessary to use an older version ofProM.
TheProMversion used in this thesis isProM 6.7 Revision 35885.
3.5.2 Disco
Discowas developed in 2009 to help organizations to regain control over their processes. Based on process mining consulting projects and interviews with practitioners it became clear that process mining needs to be fast and easy to be applied in practice [41]. Based on these requirements,Discowas developed. It allows for a very easy import of different standard log formats such as MXML or XES but also supports many other formats such as CSV or MS-Excel files. The event logs are then used for automated process discovery with a next-generation fuzzy miner algorithm. In comparison toProM,Discois very easy and interactive to use and allows to generate expressive process models without much effort. Additionally, many standard event logs are included inDisco, which allows for a fast and easy first take on process mining.
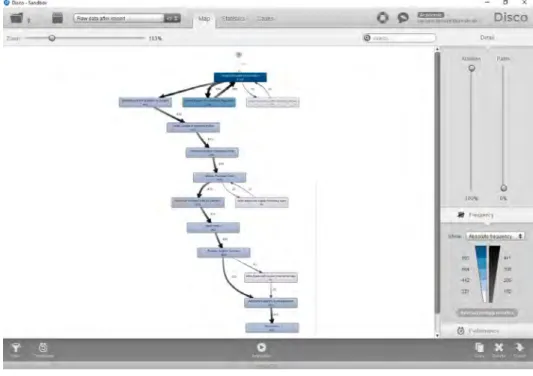
A screenshot ofDisco is shown in Figure 3.6. The two sliders on the right-hand side allow to adjust the granularity of the activities and paths, while the bottom part of that menu allows changing from the frequency to the performance perspective. Moreover, Discoalso allows for process statistics, log filtering, as well as performance highlighting and animation. As providing a whole overview of the functionalities of Disco would extend the scope of this thesis, please be referred to [41] or https://fluxicon.com/disco/ for further information.
Figure 3.6: A screenshot of the Process Mining Tool Disco
3.5.3 Other Process Mining Tools
There are more tools supporting process mining than justProM andDisco. This section should provide a brief overview of other tools.
Process Mining tools may be categorized into academic and commercial tools.
Although the lion’s share of academic research is conducted inProM, other academic tools have also been developed. Other academic tools arePMLAB, developed by the
3.5 Process Mining Tools group of Josep Carmona at the Universitat Politècnica de Catalunya in Barcelona [42] or the benchmarking frameworkCoBeFrawhich has been developed by the department of Management Informatics at KU Leuven in Belgium [43].
In the context of commercial process mining tools, the variety of tools is greater. The goal is not to give detailed information or compare any tools in this section, which is why the tools are only named in an alphabetical order. Furthermore, these tools are constantly improving with each new release, which makes a case-specific selection of the correct tool necessary. Commercial process mining tools, ordered alphabetically, are Celonis Process Mining, Disco, Enterprise Discovery Suite,Interstage Business Pro-cess Manager Analytics, Minit, myInvenio, Perceptive Process Mining, QPR Process Analyzer,Rialto Process,SNP Business Process Analysis, andwebMethods Process Performance Manager [14].
The variety of different commercial process mining tools reflects the industry’s great interest in the process mining technology. The fact that process mining algorithms have been implemented in various academic and commercial systems such as the above-mentioned ones proves that there is high interest from both an industrial and academic perspective. More and more software vendors are adding process mining components and functionality to their tools [44].
4
Process Mining
There are some misconceptions related to process mining. Process mining is often reduced to a special data mining technique to discover process models from event logs. Although process mining is able to accomplish this, this only represents a part of its capabilities. Section 4.1 explains why the scope of process mining is not limited to discovery. Process discovery is only one of the three forms of process mining. In fact, process mining may be seen as the connection between data science and process science. Process science combines the knowledge of information technology with management science to execute and improve processes [14], whereas data science uses scientific methods, processes, algorithms, and systems to extract knowledge and insights from data [45].
The main idea of process mining is to generate knowledge from event logs by com-bining methods from both mentioned disciplines to discover, monitor and improve real processes, which is also displayed in Figure 4.1.
In the context of process mining, data mining techniques such as decision trees are used to identify patterns within event logs (see Section 7.3) and databases are used to both store and provide relevant event data. Furthermore, statistics may be used to characterize event logs and algorithms are used to generate process models from event logs. Methods from predictive analytics may be used to predict the remaining time until a process is completed as described in [46]. Organizational mining (see Section 7.2) can be seen as a method of behavioral science.
Methods from process science such as optimization or business process improvement are directly supported by process mining in a sense that conformance checking directly
refers to the detection of deviations between the behavior seen in the event log and the modeled behavior.
Figure 4.1: Positioning of process mining as a bridge between two disciplines [14]
Figure 4.2: Positioning of the three different process mining forms [44]
In addition to the positioning provided in Figure 4.1, process mining may also be posi-tioned in a little less abstract way. Figure 4.2 shows this positioning. Process mining consists of three different forms: discovery, conformance, and enhancement, repre-sented by the red arrows in Figure 4.2. Moreover, Figure 4.2 allows for a more precise positioning of process mining as it builds the connection between a (process) model, which models and analyzes different aspects of reality and event logs recorded from reality via software systems.
These two ways of positioning process mining help to establish a brighter understanding of process mining as a whole before going into more detail in the following chapters. This chapter aims at creating a better understanding of process mining in general and is structured as follows. Process discovery, conformance checking, and enhancement are briefly introduced as the three forms of process mining in the first section. Section 4.2 introduces the BPM lifecycle and explains in which part of it process mining can be beneficial. The following section then answers the question why process mining may be seen as a nontrivial task and introduces four different competing quality criteria of process mining.
4.1 Three Forms of Process Mining
4.1 Three Forms of Process Mining
The term process mining summarizes three different forms of process mining. The first form is process discovery where an event log is used to generate a process model. The second form isconformance checking in which a process model is compared with an event log of the same process. The third form is enhancement where additional information in the event log or deviations identified during conformance checking are used to improve a process model [44].
This section only provides a very brief overview of the three forms, as they are explained and applied in later sections of this thesis. Figure 4.3 describes the three forms of process mining in regard to their input and output.
Event log Process Discovery Conformance Checking Enhancement Process model Enhanced process model Process model with identified deviations
4.1.1 Process Discovery
Process discovery is the first and most prominent form of process mining. A process discovery algorithm generates a process model solely based on the information from an event log. Because no other information - such as an already existing process model - is used, it is ensured that only the actual process is discovered. It is surprising for many organizations that process discovery algorithms, which are explained and applied in Chapter 5, are able to discover real processes solely based on an event log [44].
4.1.2 Conformance Checking
The second form of process mining is conformance checking. When checking con-formance, a process model is compared with an event log of that process to identify bottlenecks or (un-)wanted deviations. These deviations help to better understand and improve the process. The process model may exist beforehand or is generated by a process discovery algorithm [44]. Conformance checking may therefore not only be used to evaluate a process model but also to evaluate a process discovery algorithm by checking the conformance of the resulting model with the event log used to discover it.
4.1.3 Enhancement
The third form of process mining is enhancement. Enhancement deals with the extension of a process model with additional information or improving the existing model using information about the actual process recorded in some event log. This information, for example, information on the originator or the data generated during the process, is usually not used during the other two forms. Whereas conformance checking measures the alignment between model and reality, this third form of process mining aims at changing or extending an existing process model based on either additional information contained in the event log or deviations identified during conformance checking [44]. This allows to better understand various perspectives such as the data, organizational or temporal perspective of a process.
4.2 Process Mining across the BPM Lifecycle
4.2 Process Mining across the BPM Lifecycle
The BPM lifecycle shown in Figure 4.4 describes six different phases of a business process. During theProcess identificationphase, a process is identified and a process architecture is created.
The following phase isProcess discovery. This phase uses the process architecture as an input to create an as-is process model that represents the current process as it is executed in reality. It is evident that process mining, especially process discovery, can directly contribute to the discovery of process models. Furthermore, as it only uses event data, process discovery obtains process models that are closer to reality than process models conducted from interviews. If a process model already exists it can be used as the as-is model.
Then the as-is process model is analyzed to get insights into the weak points such as bottlenecks or undesired behavior in theProcess analysis phase. During this phase, process mining algorithms from conformance checking can directly contribute by re-vealing deviations within the discovered process model. Additionally, by using data from the event log such as timestamps, more insights into the process performance like bottlenecks can be gained with relatively low effort. These insights are then used in the Process redesign phase to create a to-be process model. The to-be process model is often created by a user who is not supported in any way. In the context of process mining, approaches have been done to at least support the user with possible improvements rather than letting him come up with the new process model by himself [47].
In the Process implementation phase, the process is implemented to create an exe-cutable process model which can then be used. While the improved process model is executed, it will be monitored and controlled in theProcess monitoring and controlling phase. During this phase, conformance checking algorithms like the Token Replay Algorithm can be used to monitor the process and discover bottlenecks.
In the case of poor process performance or serious demands identified in the previous phase, a new iteration of the BPM lifecycle may be triggered. The next iteration then
starts with the redesign phase. Process mining can be used to support all phases of the BPM lifecycle [48, 49].
Figure 4.4: The BPM lifecycle [49]
4.3 Why is Process Mining difficult?
When applying process mining algorithms in the context of process discovery, the real process usually is unknown. The data available through event logs is based on the real processes and represents different example executions of the real process. Based on the information contained in the event log, different process discovery algorithms are able to generate a process model. If the event log used to generate a process model only contains a fraction of all possible behavior, the discovered process model can only represent the fraction of behavior observed by the event log.
When applying process discovery algorithms, the main question is whether the process model is a correct representation of the real process. In order to assess whether the discovered process model indeed is a correct reflection of the real process, the four competing quality criteria of fitness, precision, generalization, and simplicity will be introduced next.
4.3 Why is Process Mining difficult?
4.3.1 Four Quality Criteria of Process Mining
Determining the quality of a process discovery result is characterized by many different and competing dimensions, which makes the task of assessing the quality itself very difficult. Some traces may have different probabilities or frequencies or the process model allows for an infinite number of different traces (if it contains loops), which makes the assumption that every possible trace is present in the event log unrealistic. To assess the quality of a process model, the four competing quality dimensions offitness, precision,generalization, andsimplicity have been introduced in [44]. Figure 4.5 gives a high-level overview of the four quality criteria.
The four criteria are: 1. Fitness
Fitness refers to the dimension that the discovered model should allow for the behavior seen in the event log. A process model with good fitness allows for the behavior represented in the event log. Perfect fitness may be achieved if all traces from the event log can be replayed by the process model [44]. Different methods to quantify fitness are presented in Chapter 6.
2. Simplicity
The dimension of simplicity refers to the principle ofOccam’s Razor describing that the simplest model that can explain the behavior seen in the event log is the best one. Simplicity may be quantified by the number of nodes and edges in the discovered process model. More sophisticated metrics also taking factors like entropy or structuredness of the process model into account, may also be used to quantify simplicity [14]. For an empirical evaluation of different model complexity metrics, please refer to [50].
3. Generalization (avoid overfitting)
A process model is overfitting in a sense that it is too specific. Since event logs only contain an example behavior of a process, the process model should also allow for the execution of future instances by generalizing the process model [44].
4. Precision (avoid underfitting)
Precision may be seen as the opposite of generalization. While generalization refers to overfitting, precision refers to underfitting. A process model has a low precision or is underfitting if it allows for behavior completely different from the behavior seen in the event log [51].
A B C Fitness Simplicity Precision Generalization Explain observed
behavior Occam’s Razor
Avoid overfitting
Avoid underfitting
Figure 4.5: Four competing quality criteria for process mining
As shown in Figure 4.5, the different quality criteria described can be interpreted as different forces dragging on a process model. Because the quality criteria are competing, a good trade-off between the different dimensions has to be found. If the process model has a high fitness, it can replay all traces from the event log, which usually also increases the complexity of the process which then again results in low simplicity. A similar trade-off can be observed between generalization and precision. If the process model allows for behavior that is not related to the event log it has good generalization but bad precision and vice versa. Completely ignoring these dimensions during process discovery will lead to degenerate cases.
![Figure 3.4: Decision tree to classify fruits [31]](https://thumb-us.123doks.com/thumbv2/123dok_us/10118311.2912391/33.892.108.696.578.862/figure-decision-tree-to-classify-fruits.webp)
![Figure 4.1: Positioning of process mining as a bridge between two disciplines [14]](https://thumb-us.123doks.com/thumbv2/123dok_us/10118311.2912391/44.892.183.814.204.520/figure-positioning-process-mining-bridge-disciplines.webp)
![Figure 4.3: Input and Output of Process Mining [44]](https://thumb-us.123doks.com/thumbv2/123dok_us/10118311.2912391/45.892.126.697.540.929/figure-input-output-process-mining.webp)
![Figure 4.4: The BPM lifecycle [49]](https://thumb-us.123doks.com/thumbv2/123dok_us/10118311.2912391/48.892.340.639.197.467/figure-the-bpm-lifecycle.webp)
