Chapter 4
Pesticides TMDL
Introduction ... 1
Name and Location of Waterbodies ... 2
Pollutant Identification ... 4
DDT ... 5
Chlordane ... 5
Dieldrin ... 5
Water Quality Standards and Beneficial Uses ... 6
Water column criteria ... 6
Fish tissue concentrations of concern ... 7
Sediment concentrations of concern ... 7
Sources or Source Categories ... 8
DDT ... 12
DDT - Water Column Data ... 13
DDT - Fish Tissue Concentrations ... 18
Chlordane ... 19
Chlordane - Water column concentrations ... 19
Chlordane - Fish tissue concentrations ... 20
Dieldrin ... 20
Dieldrin - Water column concentrations ... 21
Dieldrin - Fish tissue concentrations ... 22
Summary of Recent Data Review ... 23
Loading Capacity ... 24 DDT ... 24 Chlordane ... 28 Dieldrin ... 29 Excess Loads ... 30 DDT ... 31 Pudding River ... 31 Zollner Creek ... 34
Little Pudding River ... 38
chlordane ... 41
Dieldrin ... 42
Pudding River ... 42
Zollner Creek ... 44
Little Pudding River ... 46
Allocations ... 46
WasteLoad Allocations ... 46
Load Allocations ... 47
Required Percent Reductions ... 47
Margin of Safety ... 52
Reserve Capacity ... 53
References ... 54
List of Figures Figure 4 - 1: USGS and ODEQ Pesticides Monitoring Stations ... 9
Figure 4 - 2: Pudding River at Aurora (RM 8.1) - "Best Case" t-DDT concentrations ... 13
Figure 4 - 3: Pudding River at Aurora (RM 8.1) - "Worst Case" t-DDT concentrations ... 14
Figure 4 - 4: Pudding River at Aurora (RM 8.1) – Ranges of possible t-DDT concentrations ... 14
Figure 4 - 6: Zollner Creek Near Mt. Angel- "Best Case" t-DDT concentrations ... 16
Figure 4 - 7: Little Pudding River at Rambler - "Best Case" t-DDT concentrations ... 16
Figure 4 - 8: Zollner Creek Near Mt. Angel- "Worst Case" t-DDT concentrations ... 17
Figure 4 - 9: Little Pudding River at Rambler - "Worst Case" t-DDT concentrations ... 17
Figure 4 - 10: Butte Creek at Butte Creek Road LD (RM 15.8) - "Best Case" t-DDT concentrations ... 18
Figure 4 - 11: Sculpin and Asiatic clam - Typical species used to measure aquatic organism tissue concentrations ... 18
Figure 4 - 12: Pudding River at Aurora (RM 8.1) - "Worst Case" Dieldrin concentrations ... 21
Figure 4 - 13: Zollner Creek near Mt. Angel - "Worst Case" Dieldrin concentrations ... 22
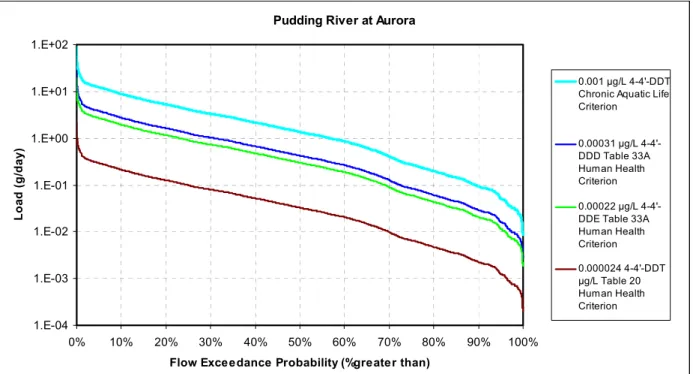
Figure 4 - 14: Pudding River 4-4’-DDT loading capacity load duration curve. ... 25
Figure 4 - 15: Zollner Creek 4-4’-DDT loading capacity load duration curve. ... 26
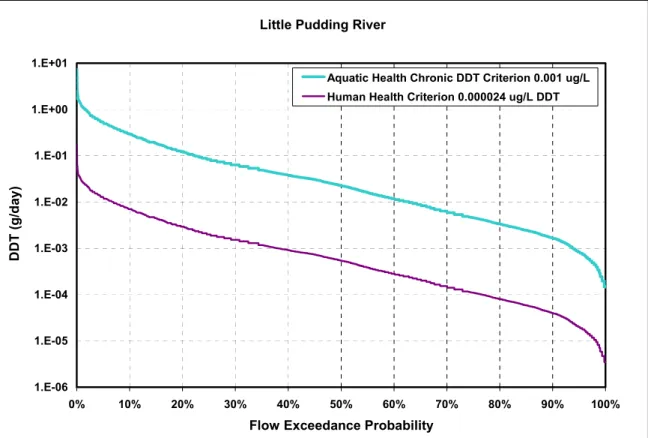
Figure 4 - 16: Little Pudding River 4-4’-DDT loading capacity load duration curve. ... 27
Figure 4 - 17: Zollner Creek chlordane loading capacity load duration curve. ... 28
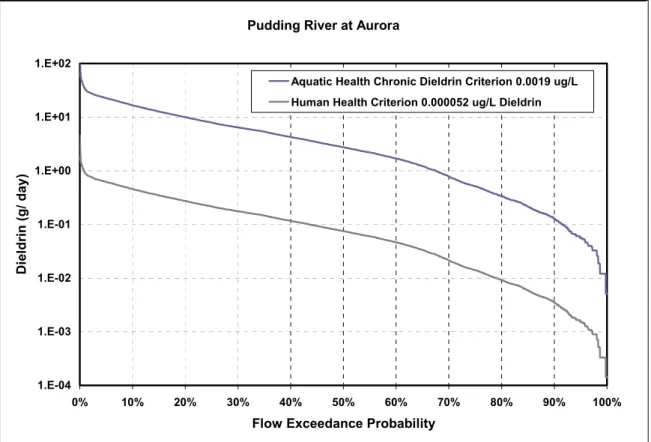
Figure 4 - 18: Pudding River dieldrin loading capacity load duration curve. ... 29
Figure 4 - 19: Zollner Creek dieldrin loading capacity load duration curve. ... 30
Figure 4 - 20: Pudding River 4,4’-DDT Excess Loads ... 31
Figure 4 - 21: Pudding River 4,4’-DDE Excess Loads ... 32
Figure 4 - 22: Pudding River 4,4’-DDD Excess Loads ... 33
Figure 4 - 23:: Pudding River Total DDT Fish Tissue Concentrations ... 34
Figure 4 - 24: Zollner Creek 4,4’-DDT Excess Loads ... 35
Figure 4 - 25: Zollner Creek 4,4’-DDE Excess Loads ... 36
Figure 4 - 26: Zollner Creek 4,4’-DDD Excess Loads ... 37
Figure 4 - 27: Zollner Creek Total DDT Fish Tissue Concentrations ... 38
Figure 4 - 28: Little Pudding River 4,4’-DDT Excess Loads ... 39
Figure 4 - 29: Little Pudding River 4,4’-DDE Excess Loads ... 40
Figure 4 - 30: Little Pudding River 4,4’-DDD Excess Loads ... 40
Figure 4 - 31: Zollner Creek Chlordane Fish Tissue Concentrations ... 41
Figure 4 - 32: Pudding River Chlordane Fish Tissue Concentrations ... 42
Figure 4 - 33. Pudding River Dieldrin Excess Loads ... 43
Figure 4 - 34: Pudding River Dieldrin Fish Tissue Concentrations ... 43
Figure 4 - 35: Zollner Dieldrin Excess Loads (all data) ... 44
Figure 4 - 36: Zollner Dieldrin Excess Loads (all data more recent than 1993). ... 45
Figure 4 - 37:Zollner Creek Dieldrin Fish Tissue Concentrations ... 45
Figure 4 - 38: Duration plot of model estimated t-DDT concentrations – Load Allocations. ... 50
Figure 4 - 39: Load Duration plot of model estimated t-DDT loads – Current and Load Allocation conditions ... 51
List of Tables Table 4 - 1: Components of the DDT and Dieldrin TMDLs. ... 1
Table 4 - 2: Molalla-Pudding Subbasin waterbodies 303(d) listed for pesticides and additional documented impairments. ... 3
Table 4 - 3: Data used as basis for 303(d) listings and additional documented impairments. ... 4
Table 4 - 4: Water Quality Criteria ... 6
Table 4 - 5. FDA Action levels for fish (edible portion) ... 7
Table 4 - 6: DHS Assumed action levels for fish ... 7
Table 4 - 7: Guidelines for organic chemicals in streambed sediments (Tanner, 2002) ... 8
Table 4 - 8: Active and historic USGS discharge gages and water quality monitoring sites ... 10
Table 4 - 9: ODEQ water quality monitoring sites ... 10
Table 4 - 10: Comparisons of observed concentrations to water quality criteria or other levels of concern. ... 11
Table 4 - 11: Fish t-DDT concentrations ... 19
Table 4 - 12: Fish Chlordane concentrations ... 20
Table 4 - 13: Fish Dieldrin concentrations ... 23
Table 4 - 14: Loading Capacities (g/day) ... 24
Table 4 - 15: Point sources receiving current conditions wasteload allocations for DDT and dieldrin. ... 47
Table 4 - 17: Percent Reductions required to meet water column criteria and fish tissue targets. ... 48
Table 4 - 18: Load Allocations as required reductions in long-term average concentrations. ... 49
Table 4 - 19: Load allocations as target TSS 96-hr concentrations ... 50
INTRODUCTION
The pesticides total maximum daily loads (TMDLs) for the Molalla-Pudding Subbasin have been developed within hydrologic units 1709000902 (Butte Creek/Pudding River), 1709000903 (Rock
Creek/Pudding River), 1709000904 (Senecal/Mill Creek) and 6th field hydrologic units associated with the Little Pudding River watershed and tributaries on the west side of the upper Pudding River. The TMDLs address segments of the following streams identified as water quality limited on the 303(d) list: Pudding River and Zollner Creek, as well as previously unlisted impairments on the Pudding River and Little Pudding River. Required TMDL components from OAR 340-042-0040 are listed in Table 4 - 1. Table 4 - 1: Components of the DDT and Dieldrin TMDLs.
Name and Location of Waterbodies OAR 340-042-0040(4)(a)
Perennial and intermittent streams, as identified in OAR 340-041- 0340; Figures 340A & 340B, streams in the Molalla-Pudding Subbasin, HUCs 1709000902, 1709000903, 1709000904 and the 6th field HUCs 170900090108, 170900090109 and 170900090110.
Pollutant Identification
OAR 340-042-0040(4)(b) Pollutants: dichlorodiphenyltrichloroethane (DDT), dieldrin, and chlordane.
Water Quality Standards and Beneficial Use
Identification OAR 340-042-0040(4)(c)
OAR 340-041-0033(1) OAR 340-041-0033(2)
(1) Narrative Criteria: Toxic substances may not be introduced above natural background levels in the waters of the State in amounts, concentrations, or combinations that may be harmful, may chemically change to harmful forms in the environment, or may accumulate in sediments or bioaccumulate in aquatic life or wildlife to levels that adversely affect public health, safety or welfare, aquatic life, wildlife or other designated beneficial uses.
(2) Numeric Criteria: Levels of toxic substances may not exceed the criteria listed in Table 20 which were based on criteria established by EPA and published in Quality Criteria for Water (1986), unless otherwise noted. Human Health Criteria are 0.000024, 0.000071, and 0.00046 micrograms per liter for DDT, dieldrin, and chlordane, respectively. Aquatic Life Chronic Criteria are 0.001, 0.0019, 0.0043 micrograms per liter for DDT, dieldrin, and chlordane, respectively. The Oregon Environmental Quality Commission approved new toxics criteria in May 2004, including revisions of the DDT, dieldrin, and chlordane criteria in Table 33A , but these values are not yet approved by EPA. For this TMDL, DEQ uses the more conservative of the criteria in Table 20 and Table 33A.
Beneficial Uses: Fish and aquatic life: Salmon and trout rearing and migration (aquatic life criteria). Water and fish consumption (human health criteria)
TMDL Loading Capacity OAR 340-042-0040(4)(d) Excess Load OAR 340-042-0040(4)(e) Sources or Source Categories OAR 340-042-0040(4)(f)
Loading Capacity: The loading capacity was determined through the development of load duration curves that determine the load that will achieve the human health criteria for DDT, dieldrin, and chlordane.
Excess Load: The difference between the actual pollutant load and the loading capacity of a waterbody. Excess load was calculated for five flow intervals across all flow conditions. Sources: DDT, dieldrin, and chlordane were used for urban and agricultural insect control until 1972, 1970, and 1988, respectively. All three chemicals persist in the environment because they degrade slowly and are fat soluble, so may bioaccumulate in aquatic organisms. The source of these banned pesticides to streams is primarily sediment transported by erosion and runoff from agricultural land use. Urban stormwater has not been discounted as a source, but the greater percentage of land use in the Molalla Pudding Subbasin is agricultural.
Table 4 – 1 Continued
Wasteload Allocations OAR 340-042-0040(4)(g) Load Alloacations OAR
340-042-0040(4)(h) Surrogate Measures OAR 340-042-0040(5)(b)
40 CFR 130.2(i)
Waste Load Allocations (Point Sources): DEQ allots wasteload allocations for DDT and dieldrin to point sources that cover their current conditions of discharge. The point sources to which wasteload allocations are given are wastewater treatment plants that discharge into the DDT-listed reach of the Pudding River.
Load Allocations (Non-Point Sources): Load allocations for DDT and dieldrin are expressed as a percent reduction, partially attained through a TSS target of 15 mg/l in Pudding River and Zollner Creek and 7 mg/L in Little Pudding River. Additional reductions in DDT and dieldrin inputs to surface water will be necessary to achieve load allocations. The chlordane load allocation is expressed as a percent reduction in fish tissue concentrations.
Surrogate Measures
Total Suspended Solids (TSS) concentrations are used as one surrogate measure of DDT based on the relationship between the two parameters, the relative ease of measuring TSS and the relevance of TSS to applicable measures of performance (e.g. erosion control). The TSS/dieldrin relationship is not as strong as that between TSS and DDT, but based on fewer detections and lower concentrations of dieldrin, as well as an apparent decreasing trend in dieldrin
concentrations, DEQ believes that achieving DDT criteria through TSS reduction and other means will also result in the attainment of dieldrin criteria. A percent reduction is also used as a surrogate measure because the allowable DDT and dieldrin load allocations would be less than current analytical methods could detect. A percent reduction in fish tissue concentrations is the surrogate measure for the chlordane load allocation.
Seasonal Variation OAR 340-042-0040(4)(j)
CWA §303(d)(1)
Violations of water quality standards occur throughout the year and under both low flow and high flow conditions.
Margins of Safety OAR 340-042-0040(4)(i)
CWA §303(d)(1)
Margins of Safety: No numeric margin of safety is developed in this TMDL, although
conservative assumptions and procedures result in an implicit margin of safety. Modeling and reductions are based on achieving the stringent human health criteria rather than the chronic aquatic life criteria. Also, assigning reductions to the Little Pudding River and Zollner Creek (for DDT) addresses pollutant loads in streams not yet listed for pesticide exceedances.
Reserve Capacity
OAR 340-042-0040(4)(k) DEQ allocates 10% of the loading capacity for DDT, dieldrin, and chlordane to reserve capacity.
Water Quality Management Plan OAR 340-042-0040(4)(l)
The Water Quality Management Plan (WQMP) provides the framework of management
strategies to attain and maintain water quality standards. Detailed plans and analyses included in specific DMA implementation plans will supplement the WQMP.
NAME AND LOCATION OF WATERBODIES
Two streams in the Molalla-Pudding Subbasin, Pudding River and Zollner Creek, a tributary to the Pudding River, are included on the 303(d) list of water quality impaired waterbodies due to high levels of pesticides. The Pudding River from mouth to river mile 35.4 is listed due to high levels of DDT. Zollner Creek from mouth to RM 7.8 is listed due to high levels of chlordane and dieldrin. Both streams are water quality limited for these pollutants year-round.
While not currently included on the 303(d) list, recent monitoring by ODEQ shows that Zollner Creek and the Little Pudding River, which is also a tributary to the Pudding River, contain levels of DDT and its metabolites which exceed State of Oregon water quality criteria. Little Pudding River enters the Pudding River at RM 37.5 and Zollner Creek enters at RM 29.6. Loads from these streams appear to be the primary cause of DDT criteria exceedances in the Pudding River. While also not currently included on the 303(d) list, monitoring by USGS shows that Pudding River may contain levels of dieldrin which exceed State of Oregon water quality criteria.
Table 4 - 2 and Table 4 - 3 show 303(d) listed reaches addressed by this TMDL.
Table 4 - 2: Molalla-Pudding Subbasin waterbodies 303(d) listed for pesticides and additional documented impairments.
Waterbody LLID and
River Miles Parameter Season Criteria Beneficial Uses
Assessment Year
Action Pudding River
0 to 35.4 DDT Year Around Table 20 Toxic Substances
Anadromous fish passage Drinking water
Resident fish and aquatic life
1998 Added to database Zollner Creek
0 to 7.8 Chlordane Year Around Table 20 Toxic Substances Drinking water Fishing
2002 Added to database Zollner Creek
0 to 7.8 Dieldrin Year Around Table 20 Toxic Substances
Anadromous fish passage Drinking water
Resident fish and aquatic life 2002 Status modification - Added to 303(d) list Pudding River 0 to 35.4 Dieldrin Year Around Table 20 Toxic Substances
Anadromous fish passage Drinking water
Resident fish and aquatic life Not previously listed Zollner Creek 0 to 7.8 DDT Year Around Table 20 Toxic Substances
Anadromous fish passage Drinking water
Resident fish and aquatic life
Not previously listed
Little Pudding River
0 – 18.3 DDT Year Around Table 20 Toxic Substances
Anadromous fish passage Drinking water
Resident fish and aquatic life
Not previously listed
Table 4 - 3: Data used as basis for 303(d) listings and additional documented impairments. Waterbody
LLID and
River Miles Parameter Data Source and Supporting Data
Pudding River
0 to 35.4 DDT
Previous Data:
USGS Data: (Site 14202000, at Aurora): 2 of 4 values, at or above detection, with an average of 0.0015 μg/L exceeded DDT standard (0.001 μg/L – fresh water chronic criteria, .024 ng/l water and fish ingestion criterion) between 5/25 – 11/9/94 (USGS, 1995).
Zollner Creek
0 to 7.8 Chlordane
Previous Data:
USGS 14201300: 5/5 samples > criterion of 0.46 ng/L. Zollner Creek 0 to 7.8 Dieldrin Previous Data: USGS 14201300: 3/5 > criterion of 0.071 ng/L. Pudding River 0 to 35.4 Dieldrin
USGS Data: (Site 14202000, at Aurora): 2 of 5 values, unfiltered water samples, at or above detection (0.001 μg/L), exceeded 0.071 ng/l water and fish ingestion criterion in 1994.
Zollner Creek
0 to 7.8 DDT
Zollner Creek Near Mt Angel (USGS 14201300, ODEQ 10899) DDT detected in 3 of 10 ODEQ samples collected 2005-2007 . All detections exceed 0.001 µg/L aquatic life chronic criterion and 0.000024 µg/L human health criterion.
Little Pudding River
0 to 18.3 DDT
Little Pudding River at Rambler Road (ODEQ 31875) DDT detected in 9 of 10 ODEQ samples collected 2005-2007. All detections exceed 0.001 µg/L aquatic life chronic criterion and 0.000024 µg/L human health criterion.
POLLUTANT IDENTIFICATION
The primary pesticides of concern in the Pudding River Watershed are the listed pesticides: chlordane, dieldrin, and DDT (dichlorodiphenyltrichloroethane), including the DDT metabolites DDE and DDD. Chlordane, dieldrin, and DDT are toxic organochlorine pesticides. Historically, DDT, dieldrin, and
chlordane were used extensively as agricultural insecticides and to control insect disease vectors such as mosquitoes. The use of these compounds has been banned in the United States for decades (DDT since 1972, chlordane since 1988, and dieldrin since 1970) but they are long-lived in soils.
Sampling performed by USGS as part of the U.S. Geological Survey National Water-Quality Assessment (NAWQA) Program (Bonn, et al, 1995 and Rinella and Janet, 1998) and the Willamette River Basin Water Quality Study (Anderson, et al, 1996 and Anderson, et al, 1997) suggests that a number pesticides may be present in the Willamette Basin in concentrations which may exceed either State of Oregon water quality criteria or other national or international criteria 1. In addition to the listed pesticides (DDT and its metabolites DDE and DDD, chlordane, dieldrin), additional pesticides identified in the Willamette Basin include, atrazine, chlorpyrifos, diazinon, lindane (γ-HCH), and malathion. In particular, chlorpyrifos was identified as exceeding water quality criteria in the Molalla-Pudding subbasin. DEQ has not developed TMDLs for these additional pesticides, but does discuss and analyze the presence of these current use pesticides in the Molalla-Pudding Subbasin in Appendix I of this document.
A review of USGS and ODEQ monitoring data did not reveal any detected water column concentrations of chlordane. Therefore, the basis for the Zollner Creek 303(d) listing for chlordane is unclear. While no chlordane was detected in the water column, chlordane was detected in fish tissue samples collected in 1992 and 1997 in concentrations which exceed potential Oregon Department of Human Services (DHS) action levels. Fish tissue samples may also include fish tissue samples, such as from Sculpin, and shellfish tissue samples, such as from Asiatic clams. Therefore, even though no chlordane was detected in the water column, a TMDL has been developed to address this listing.
1Other pesticide criteria have been established by such bodies as National Academy of Sciences and National Academy or Engineering (NAS/NAE), the Canadian Council of Resources and Environmental Ministers (CCRM), or the U.S. Environmental Protection Agency (USEPA).
DDT
DDT (1,1,1-trichloro-2,2-bis(p-chlorophenyl)ethane)2 does not occur naturally in the environment. DDT is a pesticide that was once widely used to control insects on agricultural crops and insects that carry diseases like malaria and typhus, but is now used in only a few countries to control malaria. Technical grade DDT may also contain DDE 2,2-bis(p-chlorophenyl)ethylene) and DDD (1,1-dichloro-2,2-bis(p-chlorophenyl)ethane) as contaminants. DDD, now banned, was also used to kill pests, but to a far lesser extent than DDT. Both DDE and DDD are breakdown products of DDT3.
CHLORDANE
Chlordane is a man-made chemical that was used as a pesticide in the United States from 1948 to 1988 (ATSDR, 1994)4. It is a broad spectrum insecticide that has been used extensively for termite control, as an insecticide for homes and gardens, and as a control for soil insects during the production of crops such as corn. Chlordane is readily soluble in natural fats and fat soluble substances5. It is estimated that prior to 1983, 3.6 million pounds were used annually in the U.S. Technical grade chlordane is a mixture of at least 50 compounds; the major constituents are cis- and chlordane, heptachlor, cis- and trans-nonachlor, and alpha-, beta- and gamma-chlordane. In the aquatic environment, chlordane is very persistent in the adsorbed state. Based on the high bioconcentration factor (BCF) values ranging between 7,240 and 20,000 chlordane is expected to have a high potential for bioconcentration. Trans-nonachlor is the most bioaccumulative of the chlordanes exceeding human health guidelines in fish tissue.6
DIELDRIN
Aldrin and dieldrin7 are the common names of two structurally similar compounds that were once used as insecticides. They are chemicals that are made in the laboratory and do not occur naturally in the environment. Technical-grade aldrin contains not less than 85.5% aldrin. The trade names used for aldrin include Aldrec, Aldrex, Drinox, Octalene, Seedrin, and Compound 118. Technical-grade dieldrin contains not less than 85% dieldrin. The trade names used for dieldrin include Alvit, Dieldrix, Octalox, Quintox, and Red Shield8.
Dieldrin is a long-lived oxidation breakdown product of aldrin. Aldrin quickly breaks down into dieldrin in the body or in the environment, typically within a matter of days. Thus, the environmental concentrations of dieldrin are a cumulative result of the historic use of both aldrin and dieldrin. Dieldrin is extremely persistent in the environment, and by means of bioaccumulation it is concentrated many times as it moves up the food chain. Its persistence is due to its extremely low volatility and low solubility in water resulting in a high affinity for fat (USEPA 1993, Meyer 1990).9
2 DDT Synonyms:
A synonym for p,p’-DDT is 4,4’-DDT and a synonym for o,p’-DDT is 2,4’-DDT. A synonym for p,p’-DDE is 4,4’-DDE and a synonym for o,p’-DDE is 2,4’-DDE. A synonym for p,p’-DDD is 4,4’-DDD and a synonym for o,p’-DDD is 2,4’-DDD. (U.S. EPA Substance Registry System
http://iaspub.epa.gov/srs/srs_proc_qry.name_query ) 3
(http://www.atsdr.cdc.gov/toxprofiles/phs35.html#bookmark01
Public Health Statement for DDT, DDE, and DDD, U.S. Department of Health and Human Services, Public Health Service, Agency for Toxic Substances and Disease Registry, September 2002).
4http://www.atsdr.cdc.gov/toxprofiles/phs31.html 5
Ambient Water Quality Criteria for Chlordane, EPA 440/5-80-027, U.S. EPA, Washington DC October 1980. 6In the Lake Michigan Mass Balance, trans-nonachlor will serve as a model for the cyclodiene pesticides.” Lake Michigan Mass Balance Study, USEPA
http://www.epa.gov/glnpo/lmmb/substs.html#Trans-nonachlor 7
The scientific name for aldrin is 1,2,3,4,10,10-hexachloro-1,4,4α,5,8,8α-hexahydro-1,4-endo,exo-5,8-dimethanonaphthalene. The abbreviation for the scientific name of aldrin is HHDN. The scientific name for dieldrin is 1,2,3,4,10,10-hexachloro-6,7-epoxy-1,4,4α,5,6,7,8,8α-octahydro-1,4-endo,exo-5,8-dimethanonaphthalene. The abbreviation for the scientific name for dieldrin is HEOD. 8
U.S. Department of Heath and Human Services, Agency for Toxic Substances & Disease Registry (ATSDR).
(http://www.atsdr.cdc.gov/toxprofiles/phs1.html#bookmark01
Aldrin and dieldrin have been two of the most widely used domestic pesticides. The primary use of the chemicals in the past was for control of corn pests, although they were also used to controls the pests of other crops. The U.S. Department of Agriculture canceled all uses of aldrin and dieldrin in 1970. In 1972, however, EPA approved aldrin and dieldrin for killing termites and use continued until 1987. In 1987, the manufacturer voluntarily canceled the registration for use in controlling termites10.
WATER QUALITY STANDARDS AND BENEFICIAL USES
The beneficial uses affected by the presence of pesticides are anadromous fish passage, drinking water, fishing (Human Health – Water and Fish Ingestion), and resident fish and aquatic life. The most sensitive beneficial use is Human Health – Water and Fish Ingestion. This TMDL evaluates the 303(d) listed parameters, in order to determine if water column, fish or shellfish tissue, or sediment concentrations are high enough to potentially adversely impact aquatic life or human health.
WATER COLUMN CRITERIA
State of Oregon water quality criteria are shown in Table 4 - 4. The State of Oregon adopted toxics water quality criteria from EPA guidance (EPA, 1986) to protect the most sensitive beneficial uses of Oregon waterbodies. Those criteria are summarized in Table 20 of OAR 340-041-0033. The Oregon
Environmental Quality Commission approved new toxics criteria in May 2004, including revisions of the DDT, dieldrin, and chlordane criteria in Table 33A, but EPA has not yet approved those criteria because of on-going litigation regarding fish consumption rate. Until the 2004 proposed criteria are approved, DEQ continues to use the criteria in Table 20 for federal Clean Water Act purposes, including TMDLs. In this TMDL, if the Table 33A criterion is more conservative than the Table 20 criterion (e.g. dieldrin), DEQ has used the Table 33A criterion as the applicable criterion. Chronic and acute aquatic life criteria are intended to protect aquatic life. Human health criteria are intended to minimize adverse human health effects from ingestion of water and organisms residing in the waterbody.
Table 4 - 4: Water Quality Criteria
Compound
Freshwater For Consumption of: Human Health
Drinking Water MCLs Acute µg/L Chronic µg/L Water + OrganismB µg/L Organism onlyB µg/L µg/L Chlordane 2.4 Table 20 0.0043 Table 20 0.00046 Table 20 0.00048 Table 20 2 Dieldrin 2.5 Table 20 0.0019 Table 20 0.000071 Table 20 0.000076 Table 20
Chlordane 2.4 Table 33A 0.0043 Table 33A 0.00080 Table 33A 0.00081 Table 33A DDT 1.1 Table 20 0.001 Table 20 0.000024 Table 20 0.000024 Table 20
DDD 4,4'- 0.00031 Table 33A 0.00031
Table
33A
DDE 4,4'- 0.00022 Table 33A 0.00022 Table 33A
Dieldrin 0.24 Table 33A 0.000052 Table 33A 0.000054
Table
33A
MCL - Maximum Contaminant Level (MCL) - The highest level of a contaminant that is allowed in drinking water. MCLs are set as close to MCLGs as feasible using the best available treatment technology and taking cost into consideration. MCLs are enforceable standards. Table 20 and 33A are contained in OAR 340-41-0033
10http://www.atsdr.cdc.gov/toxprofiles/phs1.html#bookmark01 and U.S. Department of Heath and Human Services, Agency for Toxic Substances & Disease Registry ATSDR
FISH TISSUE CONCENTRATIONS OF CONCERN
Action levels for poisonous or deleterious substances are established by the Food and Drug
Administration (FDA) to control levels of contaminants in human food and animal feed. Action levels and tolerances represent limits at or above which FDA will take legal action to remove products from the market. Where no established action level or tolerance exists, FDA may take legal action against the product at the minimal detectable level of the contaminant. FDA action levels for fish (edible portion) are shown in Table 4 - 511.
Table 4 - 5. FDA Action levels for fish (edible portion)
Pesticide FDA Action Level
CHLORDANE 0.3 ppm (300 µg/kg)
DDT, DDE, & TDE 5 ppm (5000 µg/kg)
ALDRIN & DIELDRIN 0.3 ppm (300 µg/kg)
Fish Advisories for the State of Oregon are issued by the Oregon Department of Human Services (DHS) Environmental Toxicology Program. To date, DHS has not issued any fish advisories for chlordane, DDT or dieldrin and, therefore, has not established official Oregon action levels for these compounds. When determining advisory thresholds, DHS typically begins with USEPA fish screening levels (Table 4 - 6) and adjusts them using an assumed consumption rate of 20 g/day, rather than 6.5 g/day. Application of this methodology results in the assumed action levels shown in Table 4 - 6 (Kauffman, K.W., 2007).
Table 4 - 6: DHS Assumed action levels for fish
Pesticide USEPA fish tissue
screening value (carcinogenicity)
DHS assumed action level (adjusted to assumed 20 g/d
consumption rate)
Chlordane (total) 80 µg/kg (0.08 ppm) 27 µg/kg
DDT (total isomers) 300 µg/kg (0.3 ppm) 100 µg/kg
Dieldrin 7 µg/kg (0.007 ppm) 2.3 µg/kg
SEDIMENT CONCENTRATIONS OF CONCERN
Oregon DEQ has not promulgated criteria for streambed sediment. In order to determine if sediment concentrations of chlordane, dieldrin, and DDT and other pesticides exceed levels of potential concern, concentrations may be compared to sediment quality guidelines recommended by other organizations to support and maintain designated uses of the aquatic environment (Tanner, 2002). Guidelines for comparison to observed concentrations are from the Puget Sound Dredged Disposal Analysis Program (PSDDA, 2000) and the Canadian Council of Ministers of the Environment (CCME, 2001) (Table 4 - 7). The PSDDA is a joint program of the U.S. Environmental Protection Agency and the U.S. Army Corps of Engineers, with the responsibility of regulating dredged material management activities in the State of Washington under the Clean Water Act. Two PSDDA guidelines are listed, the screening level and the maximum level. The screening level identifies the concentration below which the disposal of dredged material is expected to have no unacceptable adverse effects (Tanner, 2002).
Canadian governmental agencies have based sediment guidelines on the simultaneous effects of several contaminants on benthic organisms. Probable effect levels (PEL) are interim guidelines developed by the Canadian Council of Ministers of the Environment. They indicate the concentrations above which
adverse biological effects are expected to occur frequently (Tanner, 2002).
Table 4 - 7: Guidelines for organic chemicals in streambed sediments (Tanner, 2002)
Organic chemical PSDDA
Screening Level Guideline (µg/kg) Canadian Interim Guideline Probable Effects level (µg/kg) Total chlordane
(cis-chlordane + trans-chlordane + cis-nonachlor + trans
-nonachlor + oxychlordane) - 8.87 Dieldrin 10 6.67 Total DDD ( 2,4’-DDD + 4,4’-DDD) - 8.51 Total DDE ( 2,4’-DDE + 4,4’-DDE) - 6.75 Total DDT ( 4,4’-DDD + 4,4’-DDE + 4,4’-DDT) 6.9 - Lindane (γ-HCH) 10 1.38
SOURCES OR SOURCE CATEGORIES
A review of existing data and previous studies indicates that the main source areas for the pesticides of concern are areas of agricultural land use associated with sediment entering streams. USGS found in the Willamette River Basin Water Quality Study that water column concentrations of several pesticides, particularly DDT, correlated with suspended solids concentrations (Anderson, et al, 1996 and Anderson, et al, 1997). The USGS also found that pesticides correlate highly with the percent of watershed in agricultural land use. Since much of the sediment which enters streams comes from sediment washed off fields during storm events, pesticides associated with sediment may be controlled by reducing surface erosion.
DEQ’s data review and modeling (explained in detail in Appendix J) indicate that the major sources of DDT to the Pudding River are Zollner Creek and Little Pudding River. The data review that led to conclusions about source areas makes up this section.
Frequent monitoring of water column pesticides concentrations was performed by USGS at three locations in the Pudding River watershed: Little Abiqua Creek Near Scotts Mills (1992 - 2004), Pudding River At Aurora (1992 - 1997), and Zollner Creek Near Mt Angel (1992 - 2006) (Figure 4 - 1 and Table 4 - 8). Occasionally monitoring was also done by USGS at other sites. DEQ performed frequent monitoring of water column pesticides at 10 sites from 2005 to 2007, shown in Table 4 - 9.
! < ! < ! < ! < ! < ! < ! < ! < ! < $ 1 $1 $ 1 $ 1 $ 1 $ 1$1 $ 1 $ 1 $ 1 $ 1 $ 1 $ 1 BU TTE CR PUDD ING R A B IQ U A C R MO LALL A R RO CK CR MIL L C R SIL VER C R DR IFT CR SE NE CA L C R LITT LE P UDDI NG R MILK C R LIT TL E A BIQ UA R Butte Creek at Hwy 211
Zollner Creek at Hwy 214
Silver Creek at Brush Creek Road
Pudding River at Aurora at Hwy 99E
Butte Creek at Butte Creek Road LD Abiqua Creek at Gallon House Bridge
South Fork Bochsler Creek at Hwy 214
Little Pudding River at Rambler Road
Little Abiqua Creek near Scotts Mill Senecal Creek at Fellers Rd nr Donald
Mill Creek at Ehuen Road Bridge at Aurora
Pudding River near Mt. Angel at Saratoga Rd Zollner Creek near Mt. Angel at Monitor-McKe
0 0.51 2 3 4Miles
Pudding River Watershed Pesticides Monitoring Sites
Legend $ 1Pesticides Stations usgs_gages STATUS ! <Historic ! <Realtime majorlu polygon MAJORLU 1 Urban or Built-Up 2 Agricultural 3 Range 4 Forest 5 Water 6 Wetland 7 Barren 8 Tundra
9 Perennial Snow and Ice
Table 4 - 8: Active and historic USGS discharge gages and water quality monitoring sites USGS
Gage Number
NAME RM Drainage Area (sq.mi.)
Periods LAT LONG STATUS ELEV (ft) 14202000 Pudding River at Aurora
(Hwy 99E, u/s from Mill Cr) 8.1 479 1928-64, 93-97, 02-present
45.2333 -122.7489 Realtime 72
14201340 Pudding River near Woodburn
23.4 314 1997-present
45.1514 -122.8031 Realtime 130 14201300 Zollner Creek near Mt. Angel 0.4 15.0
1993-present 45.1006 -122.8206 Realtime 240 14200000 Molalla River near Canby 6.0 323 1928-59,
63-78, 00-present
45.2444 -122.6861 Realtime 94
14200300 Silver Creek near Silverton 3.0 47.9 1963-79 45.0094 -122.7875 Historic 218 14200400 Little Abiqua at Scotts Mills 0.1 9.8 1993-2004 44.9558 -122.6272 800 14201000 Pudding River near Mt.
Angel (Saratoga Rd) 40.7 204 1939-66 45.0361 -122.8292 Historic 120 14201500 Butte Cr at Monitor 5.9 58.7 1936-85 45.1017 -122.7450 Historic 155 Table 4 - 9: ODEQ water quality monitoring sites
Station Name and DEQ Lab Analytical Storage and Retrieval (LASAR)
number % U rba n % Ag % Fore st
River Mile Draina
ge Ar ea u/s fro m sta tion mi (mi2) Pudding River at Aurora (Hwy 99E)
(USGS Gage 14202000, 10917) 5 58 36 8.1 479.0
Pudding River near Mt. Angel (Saratoga
Rd) (old USGS Gage 14201000, 31877) 3 47 50 40.7 204.0 Abiqua Creek at Gallon House Bridge
(31872) 2 29 68 1.9 76.0
Butte Creek at Hwy 211 (10896) 1 24 75 1.3 67.8 Silver Creek at Brush Creek Road
(10646) 6 17 77 1.3 54.4
Little Pudding River at Rambler Road
(31875) 22 74 3 2.9 52.9
Zollner Creek Near Mt Angel
(Monitor-McKee Rd) (Gage 14201300, 10899) 1 99 0 0.4 15.0
Zollner Creek at Hwy 214 (11515) 1 98 1 1.0 6.9 South Fork Bochsler Creek at Hwy 214
(11514, tributary to Zollner Cr) 1 98 1 0.6 2.6
Senecal Creek at Fellers Rd
(trib to Mill Cr to Pudding R) 8 89 3 3.1 9.7
Little Abiqua Creek near Scotts Mill
(Gage 14200400) 0 4 96 0.4 9.8
Butte Creek at Butte Creek Road LD
USGS and ODEQ measured water column concentrations of these parameters were compared to criteria to determine if concentrations could potentially adversely affect aquatic life or human health (Table 4 - 10). Parameters in concentrations in excess of applicable criteria are shown as “> Std.” Parameters detected but not in concentrations in excess of applicable criteria as shown as “>DL.” Parameters all or virtually all below detection are shown as “OK.” GS and Q in table indicate whether the dataset is via USGS (GS) or ODEQ (Q). t-DDT shown in Table 4 - 10 is the Total DDT concentration and includes DDT and its metabolites (t-DDT = 4-4’-DDT + 4-4’-DDE + 4-4’-DDD).
Table 4 - 10 shows the percent of land above each station on an areal basis that is classified as urban, agriculture, or forest. Rinella and Janet, 1998, classified streams with land use greater than 90% forested as “forested”; and streams with land use greater than 50% agricultural and less than 25% urban as “agricultural.” In accordance with this, the Zollner Creek (including Bochsler Creek) and Little Pudding River sites are agriculture sites, whereas Little Abiqua Creek and Butte Creek at Butte Creek Road LD sites are forestry sites. The remaining sites are integrator sites: those sites which include a mixture of land uses.
Table 4 - 10: Comparisons of observed concentrations to water quality criteria or other levels of concern. Parameters in concentrations in excess of applicable criteria are shown as “> Std.” Parameters all or virtually all below detection are shown as “OK.” GS and Q in table indicate whether the dataset is via USGS (GS) or ODEQ (Q). Note 1: One estimated concentration for 4,4’-DDT of 0.002 µg/L exceeded criteria. Note 2: One of 12 samples exceeded DL with a concentration of 0.002 µg/L (> ODEQ criteria of 0.001 µg/L).
Station Name and Lab Analytical Storage and Retrieval (LASAR) number
% U rba n % Ag % Fore st t-DDT C h lo rd an e Dieldrin
Integrator Sites (mix of agriculture, forestry and urban land uses):
Pudding River at Aurora (Hwy 99E)
(Gage 14202000, LASAR 10917) 5 58 36 >Std (GS)
OK (Q)1
OK (GS)
OK (Q) >Std (GS)OK (Q)
Pudding River near Mt. Angel (Saratoga Rd) (old Gage 14201000, LASAR 31877)
3 47 50 OK (Q) OK (Q) OK (Q)
Abiqua Creek at Gallon House Bridge (31872) 2 29 68
Butte Creek at Hwy 211 (near mouth) (10896) 1 24 75 >Std (Q)
OK (Q)
Silver Creek at Brush Creek Road (10646) 6 17 77 OK (Q)
Agriculture Sites:
Little Pudding River at Rambler Road (RM 2.9)
(31875) 22 74 3 >Std (Q) OK (Q) OK (Q)
Zollner Creek Near Mt Angel (Monitor-McKee
Rd) (Gage 14201300, 10899) 1 99 0 >Std (GS) >Std (Q) OK (GS) >Std (GS) >Std (Q)
Zollner Creek at Hwy 214 (11515) 1 98 1 South Fork Bochsler Creek at Hwy 214 (11514,
tributary to Zollner Cr) 1 98 1
Senecal Creek at Fellers Rd (trib to Mill Cr to Pudding R)
8 89 3 OK (GS)
Forestry Sites:
Little Abiqua Creek near Scotts Mill (Gage 14200400)
0 4 96 OK
(GS)
OK (GS) OK (GS)
Butte Creek at Butte Creek Road LD (31874) 0 4 96 >Std (Q)2
In forested sites, there was only one detection of a pesticide of concern: a single DDT detection out of 11 for the upper Butte Creek site (Butte Creek Road LD). This represents a detection frequency of less than 10%. For integrator sites with less than 50% agriculture, there was also only one detection of a pesticide of concern, a single DDT detection out of 5 near the mouth of Butte Creek (at Hwy 211). This represents a 20% frequency of detection.
Zollner Creek and its tributary Bochsler Creek are the only streams with land use > 90% agriculture. Chlordane was not detected, but state criteria for DDT and dieldrin were exceeded. The Little Pudding River also has a high percentage of agriculture, as well as a relatively high percentage urban. While the only pesticide of concern in excess of criteria at this site was DDT, the concentrations of DDT at this site were the highest observed in the subbasin.
Integrator sites showed pesticide concentrations that appear to relate more to whether the site is
impacted by Zollner Creek and Little Pudding River than the percent agriculture. DDT and dieldrin which have been detected in Zollner Creek or the Little Pudding River, have also been detected downstream at the Pudding River at Aurora (RM 8.1) site. However, upstream at the Pudding River near Mt. Angel site, no pesticides of concern were detected, even though this site has a percent agriculture that is similar to the Aurora site (47% vs. 58%). Pesticides of concern were also not detected at the other integrator sites, other than for a single DDT detection at the lower the Butte Creek site.
The following section presents observed concentrations of the 303(d) listed pesticides: DDT, chlordane, and dieldrin.
DDT
DDT was one of the most frequently detected organochlorine compounds in samples collected from 39 Willamette Basin sites during Phase I and Phase II of the Willamette River Basin Water Quality Study (WRBWQS) (Anderson, et at, 1996). However, DDT was not detected during other studies by USGS, mainly because, while a lot of measurements were made of 4,4’-DDE concentrations, far fewer were made for total DDT (t-DDT = DDT + DDE + DDD). This is because 4,4’-DDE was the only DDT
metabolite measured routinely by USGS as part of the Phase III of the WRBWQS (USGS Schedule 2010 methodology)(Anderson, et al, 1997). Prior to 2001 the method detection limit (MDL) for these analyzes was a relatively high 0.006 µg/L, which is quite a bit higher than the 0.001 µg/L DEQ chronic criteria for t-DDT. For samples analyzed 2001 and later, the MDL was generally 0.003 µg/L. Other than for a few estimated values, 4,4’-DDE was detected in none of the Molalla-Pudding Subbasin samples.
For a limited number of USGS Pudding River and Zollner Creek samples, analyses were performed for 4,4’-DDT and its metabolites 4,4’-DDE and 4,4’-DDD. These analyses had minimum reporting levels (MRLs) of 0.001 µg/L, which allow for comparison to the 0.001 µg/L DEQ criterion. Recent samples collected by ODEQ were also analyzed for 4,4’-DDT, 4,4’-DDE and 4,4’-DDD with MRLs of 0.001 µg/L. Concentrations in excess of ODEQ criteria were observed in Pudding River, Little Pudding River, Zollner Creek, and Butte Creek, but not in the heavily forested Little Abiqua Creek, Silver Creek, or upper Butte Creek. Note, however, that while the MRL for each metabolite is 0.001 µg/L, the detection level for t-DDT is the sum of these MRLs, or 0.003 µg/L, so simply because the three metabolites are below detection does not necessarily mean that the criteria has been met.
DDT and its metabolites were the most commonly detected organic compounds in fish tissues from the Willamette Basin (Anderson, et al, 1997). However, the only DDT metabolite analyzed for by USGS during Phase III of the Willamette River Basin Water Quality Study, 4,4’-DDE, was detected in none of the water column samples collected in the Willamette Basin (Anderson, et at, 1997). But this may be
because the detection level for 4,4’-DDE was relatively high and no analyses were performed for other DDT metabolites or for DDT itself.
The USGS found during Willamette River Basin Water Quality Study (WRBWQS) that in-stream DDT concentrations in the Willamette Basin correlate with suspended solids concentrations (Anderson, et al, 1996). DDT and its metabolites preferentially associate with the suspended phase because they are
hydrophobic, with organic carbon-water partitioning coefficients (Koc) of 770,000 for DDD, 4,400,000, for DDE and 243,000 for DDT (Anderson, et al, 1996). The fraction of DDT in the suspended phase is controlled by the Koc values, the concentration of suspended organic carbon, and the degree to which equilibrium is achieved. Theoretical computations performed by USGS predicted that 55 to 81 percent of the mass of DDT and metabolites should have been associated with the suspended phase if the systems were at equilibrium. In all cases measured by USGS, observed amounts in the suspended phase were only slightly greater than predicted.
DDT - Water Column Data Integrator Sites
Pudding River integrator sites include Pudding River at Aurora (RM 8.1) and Pudding River at Mt. Angel (RM 40.7). Tributary integrator sites include sites on Abiqua, Butte, and Silver Creeks.
The Pudding River at Aurora station (USGS gage No. 14202000 and DEQ LASAR No. 10917) is the most important integrator site since it is the most downstream integrator site in the watershed and integrates all loads except for those from Mill Creek and its tributary Senecal Creek. It is the integrator site with the highest percent land use as agriculture (58%) and it is the only integrator site located downstream from the confluences of Zollner Creek and Little Pudding River, which are streams dominated by agriculture and which at times contain significant concentrations of pesticides. It is the only integrator site where pesticides were detected frequently. The only other integrator site where a pesticide was detected was the lower Butte Creek site, for which DDT was detected in one sample.
At the Pudding River at Aurora integrator site, DDT was detected occasionally in samples collected by both USGS and ODEQ. Observed total DDT (t-DDT) concentrations are shown in Figure 4 - 2, with measurements from 1993 and 1994 by USGS and 2005 through 2007 by ODEQ. As shown, DDT was detected in 2 of 6 USGS and 1 of 11 DEQ samples, with the single DEQ detection an estimate only. For Figure 4 - 2, t-DDT concentrations were calculated by setting DDT, DDE, and DDD non-detects to zero. These constitute “best case” concentrations, since the MRLs for DDT, DDE, and DDD are all 0.001 µg/L. Therefore, actual t-DDT concentrations could be greater than the values shown.
Pudding R at Aurora - DDT (water column) - "Best Case" Concentrations
Total DDT = 4,4'-DDT + 4,4'-DDE + 4,4'-DDD; Values < detection set to zero
0 0.001 0.002 0.003 0.004 0.005 0.006 12/ 31/ 1992 12/ 31/ 1993 12/ 31/ 1994 12/ 31/ 1995 12/ 30/ 1996 12/ 31/ 1997 12/ 31/ 1998 12/ 31/ 1999 12/ 30/ 2000 12/ 30/ 2001 12/ 31/ 2002 12/ 31/ 2003 12/ 30/ 2004 12/ 30/ 2005 12/ 30/ 2006 12/ 31/ 2007 t-D D T ( µ g/ L) USGS Data ODEQ Data Chronic (CCC) Criterion (DDD + DDE + DDT) Human Health Criterion (DDD + DDE + DDT)
Alternatively, to determine “worst case” concentrations, values less than detection could be set to MRLs, as shown in Figure 4 - 3. Since 4,4'-DDD, 4,4'-DDE, and 4,4'-DDT each have detection levels of 0.001 µg/L, the detection level for t-DDT is 0.003 µg/L. Since this detection level is greater than the chronic criterion of 0.001µg/L, concentrations greater than the criteria may not always be detected. This is also true for human health criteria. Separate human health criteria apply for DDD, DDE, and DDT. These individual criteria sum to 0.000554 µg/L (0.554 ng/L). Therefore, concentrations in excess of human health criteria may frequently not be detected.
Pudding R at Aurora - DDT (water column) - "Worst Case" Concentrations
Total DDT = 4,4'-DDT + 4,4'-DDE + 4,4'-DDD; Values < detection set to MRL
0 0.001 0.002 0.003 0.004 0.005 0.006 12/ 31/ 1992 12/ 31/ 1993 12/ 31/ 1994 12/ 31/ 1995 12/ 30/ 1996 12/ 31/ 1997 12/ 31/ 1998 12/ 31/ 1999 12/ 30/ 2000 12/ 30/ 2001 12/ 31/ 2002 12/ 31/ 2003 12/ 30/ 2004 12/ 30/ 2005 12/ 30/ 2006 12/ 31/ 2007 t-D D T ( µ g/ L) USGS Data ODEQ Data DDT DL (0.001+0.001+0.001 =0.003) Chronic (CCC) Criterion (DDD + DDE + DDT) Human Health Criterion (DDD + DDE + DDT)
Figure 4 - 3: Pudding River at Aurora (RM 8.1) - "Worst Case" t-DDT concentrations
Figure 4 - 4 shows the range of likely t-DDT concentrations for each sample, with a mid point plotted half way between the maximum and minimum values. As shown, all samples could have contained
concentrations greater than applicable chronic toxicity and human health based criteria. However, t-DDT was only shown to be present in excess of criteria in 3 of the samples, and for one of the samples, the 12/21/2005 DEQ measurement, the concentration was only an estimate.
Pudding R at Aurora - DDT (water column) - Ranges of Possible Concentrations 4,4'-DDT + 4,4'-DDE + 4,4'-DDD; Values < MDL set to zero
0 0.0005 0.001 0.0015 0.002 0.0025 0.003 0.0035 0.004 0.0045 04/27 /1993 05/11/ 1994 05/25 /199 4 10/28 /1994 10/29/ 199 4 11/09 /1994 02/08/ 2005 04/19 /200 5 06/30/ 2005 12/21 /2005 02/28 /2006 04/20/ 200 6 04/26 /2007 05/03/ 2007 05/10 /2007 06/05 /2007 06/14/ 200 7 D D T ( µ g/ L) MAX Mid point MIN
The only other integrator site where DDT was detected is Butte Creek at Hwy 211 (RM 1.3), where DDT was detected in 1 of 4 samples (Figure 4 - 5). For the single detection the 4,4’-DDT concentration was 0.002 μg/L (both DDE and DDD were below detection). The Butte Creek watershed is 75% forest and 24% agriculture. No other pesticides of concern were detected at this site. As discussed below, DDT was also detected at the upper Butte Creek site, which is a site where forestry comprises 96% of the drainage area land use.
For Figure 4 - 5, the concentrations of metabolites that were not detected were set to zero. Therefore, the total DDT concentrations shown represent “best case” concentrations. As discussed above, actual concentrations could be greater than these.
Butte Creek at Hwy 211 (RM 1.3) - DDT "Best Case" Concentrations t-DDT = 4,4'-DDT + 4,4'-DDE + 4,4'-DDD; Values < detection set to zero
0 0.0005 0.001 0.0015 0.002 0.0025 0.003 0.0035 12 /3 1/ 2004 12 /3 1/ 2005 12 /3 1/ 2006 12 /3 1/ 2007 t-D D T ( µ g/ L) DDT DL (0.001+0.001+0.001= 0.003) ODEQ Data Chronic (CCC) Criterion (DDD + DDE + DDT) Human Health Criterion (DDD + DDE + DDT)
Figure 4 - 5: Butte Creek at Hwy 211 (RM 1.3) - "Best Case" t-DDT concentrations DDT - Agriculture Sites
DDT was detected frequently in the two agricultural watersheds, Zollner Creek and Little Pudding River (in addition to being detected at the Pudding River at Aurora integrator site located downstream from Zollner Creek and Little Pudding River). Total DDT concentrations for Zollner Creek Near Mt. Angel and Little Pudding River at Rambler are shown in Figure 4 - 6 and Figure 4 - 7. These are the only agriculture sites where DDT, DDE, and DDD were measured with low MRLs of 0.001 µg/L. For the Zollner Creek near Mt. Angel site, DDT was detected in 1 of 6 USGS and 3 of 10 ODEQ samples. For the Little
Pudding River at Rambler Road site, DDT was detected in 9 of 10 ODEQ samples (USGS did not monitor this site).
For the plots, concentrations for metabolites that were not detected were set to zero. Therefore, the total DDT concentrations shown represent “best case” concentrations.
Zollner Cr near Mt. Angel - DDT - "Best Case" Concentrations Total DDT = 4,4'-DDT + 4,4'-DDE + 4,4'-DDD; Values < detection set zero
0 0.02 0.04 0.06 0.08 0.1 0.12 12 /3 1/ 19 92 12 /3 1/ 19 93 12 /3 1/ 19 94 12 /3 1/ 19 95 12 /3 0/ 19 96 12 /3 1/ 19 97 12 /3 1/ 19 98 12 /3 1/ 19 99 12 /3 0/ 20 00 12 /3 0/ 20 01 12 /3 1/ 20 02 12 /3 1/ 20 03 12 /3 0/ 20 04 12 /3 0/ 20 05 12 /3 0/ 20 06 12 /3 1/ 20 07 t-D D T (µ g /L ) USGS Data ODEQ Data Chronic (CCC) Criterion (DDD + DDE + DDT)
Figure 4 - 6: Zollner Creek Near Mt. Angel- "Best Case" t-DDT concentrations
Little Pudding River at Rambler Rd - DDT - "Best Case" Concentrations Total DDT = 4,4'-DDT + 4,4'-DDE + 4,4'-DDD; Values < detection set to zero
0 0.02 0.04 0.06 0.08 0.1 0.12 12/ 31/ 2004 12/ 31/ 2005 12/ 31/ 2006 12/ 31/ 2007 t-DDT (µ g /L ) ODEQ Data Chronic (CCC) Criterion (DDD + DDE + DDT)
Figure 4 - 7: Little Pudding River at Rambler - "Best Case" t-DDT concentrations
Potential “worst” case (maximum) concentrations are presented in Figure 4 - 8 and Figure 4 - 9
(logarithmic scale). In the worst case scenario, values less than the detection level were set equal to the detection level. As shown, due to detection level limitations, all samples could potentially have contained concentrations greater than applicable chronic toxicity and human health based criteria. However, only Little Pudding River samples were found to contain concentrations that virtually always exceed criteria (Figure 4 - 9).
A significant difference between the Little Pudding River and Zollner Creek watersheds is that, while agriculture is a significant land use in both watersheds, urban is a significant land use for the Little Pudding (22%) and not for Zollner. Much of this urban area is within the limits of the cities of Salem and Keizer. Loads from urban stormwater could be a source of some of the observed DDT.
Zollner Cr near Mt. Angel - DDT - "Worst Case" Concentrations Total DDT = 4,4'-DDT + 4,4'-DDE + 4,4'-DDD; Values < detection set to MRL
0.0001 0.001 0.01 0.1 1 12 /3 1/ 19 92 12 /3 1/ 19 93 12 /3 1/ 19 94 12 /3 1/ 19 95 12 /3 0/ 19 96 12 /3 1/ 19 97 12 /3 1/ 19 98 12 /3 1/ 19 99 12 /3 0/ 20 00 12 /3 0/ 20 01 12 /3 1/ 20 02 12 /3 1/ 20 03 12 /3 0/ 20 04 12 /3 0/ 20 05 12 /3 0/ 20 06 12 /3 1/ 20 07 t-D D T ( µ g/ L) USGS Data ODEQ Data Chronic (CCC) Criterion (DDD + DDE + DDT) Human Health Criterion (DDD + DDE + DDT) DDT DL (0.001+0.001+0.001 =0.003)
Figure 4 - 8: Zollner Creek Near Mt. Angel- "Worst Case" t-DDT concentrations
Little Pudding R at Rambler Rd - DDT - "Worst Case" Concentrations t-DDT = 4,4'-DDT + 4,4'-DDE + 4,4'-DDD; Values < detection set to MRL
0.0001 0.001 0.01 0.1 1 12 /3 1/ 2004 12 /3 1/ 2005 12 /3 1/ 2006 12 /3 1/ 2007 t-D D T ( µ g/ L) ODEQ Data Chronic (CCC) Criterion (DDD + DDE + DDT) Human Health Criterion (DDD + DDE + DDT) DDT DL (0.001+0.001+0.001 =0.003)
DDT - Forestry Sites
The only pesticide of concern detected at a forestry site was a single DDT detection out of 11 ODEQ samples collected from 2005 through 2007 at Butte Creek at Butte Creek Road LD. This sample, collected in May of 2007, contained 0.002 µg/L 4,4’-DDT (both DDE and DDD were below detection) (Figure 4 - 10). There were no detections of chlordane or dieldrin at this or the other forestry site (Little Abiqua Creek near Scotts Mill, USGS gage No. 14200400).
Butte Creek at Butte Cr Rd LD (RM 15.8) - DDT "Best Case" Concentrations t-DDT = 4,4'-DDT + 4,4'-DDE + 4,4'-DDD; Values < detection set to zero
0 0.0005 0.001 0.0015 0.002 0.0025 0.003 0.0035 12 /3 1/ 2004 12 /3 1/ 2005 12 /3 1/ 2006 12 /3 1/ 2007 t-D D T ( µ g/ L) DDT DL (0.001+0.001+0.001= 0.003) ODEQ Data Chronic (CCC) Criterion (DDD + DDE + DDT) Human Health Criterion (DDD + DDE + DDT)
Figure 4 - 10: Butte Creek at Butte Creek Road LD (RM 15.8) - "Best Case" t-DDT concentrations DDT - Fish Tissue Concentrations
Fish tissue DDT and DDT metabolite concentrations were measured by USGS in Pudding River, Zollner Creek, and Little Abiqua Creek in 1992, 1993, and 1997 (Figure 4 - 11). The following measured parameters were summed to calculate total DDT (t-DDT) : DDT, 2,4'-DDT, DDE, 2,4'-DDE, 4,4'-DDD, and 2,4'-DDD. Resultant t-DDT concentrations are presented in Table 4 - 11.
The detection level for each of the parameters was 5 µg/kg (wet weight), so the detection level for t-DDT is the summation of the detection levels for the six components, or 30 µg/kg. Therefore, if neither DDT nor its metabolites was detected, then the t-DDT concentration ranged between zero and 30 µg/kg. DDT was detected in all samples from the agriculture site, Zollner Creek, and in both samples from the Pudding River at Aurora integrator site (Table 4 - 11). In only one sample, the 1997 sample from Zollner Creek, was the DHS assumed action level for t-DDT of 100 µg/kg exceeded. This was due mostly to an unusually high measured concentration of 4,4'-DDE concentration of 550 µg/kg.
DDT was not detected in fish tissue from the forestry site, Little Abiqua Creek. Therefore, the fish tissue concentrations for samples from this stream ranged from somewhere between zero and 30 µg/kg (Table 4 - 11).
Table 4 - 11: Fish t-DDT concentrations
Total DDT Concentration wet weight, µg/kg
Site No Site Date Body Part Min Max
14200400 Little Abiqua Creek Near Scotts Mills 9/15/1993 Organism, whole 0 30 14200400 Little Abiqua Creek Near Scotts Mills 9/15/1993 Organism, whole 0 30 14200400 Little Abiqua Creek Near Scotts Mills 8/15/1997 Organism, whole 0 30
14201300 Zollner Creek Near Mt Angel 9/7/1992 Organism, whole 69 84
14201300 Zollner Creek Near Mt Angel 9/7/1992 Edible portion 9 34
14201300 Zollner Creek Near Mt Angel 9/7/1993 Organism, whole 72 87
14201300 Zollner Creek Near Mt Angel 8/12/1997 Organism, whole 659 664
14202000 Pudding River At Aurora 9/8/1992 Edible portion 56 71
14202000 Pudding River At Aurora 9/21/1993 Edible portion 71 86
CHLORDANE
Chlordane - Water column concentrations
Neither USGS nor ODEQ detected chlordane in water column samples collected in the Pudding River watershed. However, due to difficulties associated with analyzing for chlordane, only a limited number of chlordane results were reported. USGS reported results for only 6 Pudding River and 6 Zollner Creek samples, with results reported for chlordane (technical) and heptachlor. Neither chlordane nor heptachlor was detected in the samples.
ODEQ reported chlordane results as part of its 2005 through 2007 studies for six samples from each of the following sites: Butte Creek at Butte Creek Road (RM 15.8), Little Pudding River at Rambler Road (RM 2.9), Pudding River at Aurora (RM 8.1), Pudding River Near Mt. Angel (RM 40.7), and Zollner Creek Near Mt. Angel (RM 0.4). Chlordane was detected in none of these thirty samples.
The lack of chlordane detections in the USGS and ODEQ samples is inconsistent with the basis for the listing which cites five out of five samples collected from the Zollner Creek near Mt. Angel site that violate the human health criterion of 0.46 ng/L. It is likely that the 2002 listing was an error, perhaps included based on fish tissue chlordane detections (described in the following section of this chapter). DEQ’s records indicate that the USGS chlordane analytical results from the Zollner Creek site were reviewed again in 2004 with the status designated “unknown.” The Zollner Creek chlordane listing was probably not proposed for removal in 2004 because the detection limit of the analysis (0.1 µg/L) exceeded both the chronic aquatic life (0.0043 µg/L) and the human health criteria (0.46 ng/L = 0.00046 µg/L), so attainment of water quality standards could not be confirmed.
Even very low concentrations could pose an unacceptable risk for bioaccumulation. Due to the limited amount of samples analyzed for chlordane and the high detection levels relative to chronic aquatic life toxicity and human health based criteria, DEQ also evaluated fish tissue concentrations.
Chlordane - Fish tissue concentrations
Fish tissue chlordane component concentrations were measured by USGS in the Pudding River, Zollner Creek, and Little Abiqua Creek in 1992, 1993, and 1997. Components measured were Oxychlordane, trans-Nonachlor, cis-Nonachlor, Heptachlor, trans-Chlordane, and cis-Chlordane. Summations of measured component concentrations are presented in Table 4 - 12.
Table 4 - 12: Fish Chlordane concentrations
Chlordane Concentration wet weight, µg/kg
Site No Site Date Body Part Min Max
14200400 Little Abiqua Creek Near Scotts Mills 9/15/1993 Organism, whole 0 30 14200400 Little Abiqua Creek Near Scotts Mills 9/15/1993 Organism, whole 0 30 14200400 Little Abiqua Creek Near Scotts Mills 8/15/1997 Organism, whole 0 30 14201300 Zollner Creek Near Mt Angel 9/7/1992 Organism, whole 30 45 14201300 Zollner Creek Near Mt Angel 9/7/1992 Edible portion 0 30 14201300 Zollner Creek Near Mt Angel 9/7/1993 Organism, whole 23 38 14201300 Zollner Creek Near Mt Angel 8/12/1997 Organism, whole 35 50
14202000 Pudding River At Aurora 9/8/1992 Edible portion 0 30
14202000 Pudding River At Aurora 9/21/1993 Edible portion 0 30 The detection level for each of the components was 5 µg/kg (wet weight), so the detection level for chlordane is the summation of the detection levels for each of the six components, or 30 µg/kg. For a majority of the measurements, none of the components were detected. Chlordane was not detected in fish tissue from Little Abiqua Creek or the Pudding River, so the fish tissue concentrations for samples from these streams ranged between zero and 30 µg/kg.
Chlordane was detected in 3 out of 4 fish tissue samples in Zollner Creek. In at least two of these samples, chlordane concentrations exceeded the DHS assumed action level for chlordane of 27 µg/kg. Though DEQ did not confirm water column chlordane detections, DEQ based its response to the chlordane listing on these fish tissue detections. DEQ has made the conservative assumption that chlordane presence in fish tissue exceeding DHS action levels indicates a potential chlordane concentration in surface water exceeding the human health criteria.
Chlordane sorbs to sediment, but to a significantly lesser degree than DDT and dieldrin, which is reflected in lower observed organic carbon-water partitioning coefficients, Koc. The Koc for chlordane is 15,500 to 24,000 L/kg12 . This indicates that at equilibrium from 8 to 12% of chlordane would be sorbed to sediment vs. from 58% to 96% for DDT and its metabolites and 52% for dieldrin.
DIELDRIN
Zollner Creek is included on the 303(d) List due to observed dieldrin detections. Dieldrin was one of the most frequently detected organochlorine compounds in samples collected from 39 Willamette Basin sites during Phase I and Phase II of the Willamette River Basin Water Quality Study (WRBWQS) (Anderson, et at, 1996). However, dieldrin was not detected by USGS during the Phase III of the WRBWQS (Anderson, et at, 1997).
12
Dieldrin - Water column concentrations
Like DDT, dieldrin sorbs to sediment. However, dieldrin sorbs to sediment to a lesser degree than DDT which is reflected in lower observed organic carbon-water partitioning coefficients, Koc. The USGS found that empirical data from the Willamette River Basin was consistent with a Koc of 1,700 mL/g reported by USEPA (Anderson, et al, 1996; Anderson, et al, 1997). This is much lower than the Koc values for DDT and its metabolites (770,000 mL/g for DDD, 4,400,000 mL/g, for DDE and 243,000 mL/g for DDT). Based on this 1,700 mL/g value, dieldrin would be almost completely associated with the dissolved phase, whereas most of DDT would be sorbed to sediment (from 58% to 96% of total DDT would be sorbed to sediment, based on a suspended organic concentration of 5.7 mg/L). However, more recently EPA determined that a more appropriate estimate of Koc for dieldrin is 190,546 mL/g. Based on this updated Koc, 52% of dieldrin would be sorbed to sediment (U.S. EPA, 2003).
Dieldrin Integrator Sites
The State of Oregon has established aquatic life chronic and human health based criteria for dieldrin. None of the samples collected in the Pudding River by either USGS or ODEQ exceeded the aquatic life chronic criterion (Figure 4 - 12). Dieldrin was detected in none of the 10 samples collected recently by ODEQ for which dieldrin concentrations were reported and in none of 34 samples collected by USGS that were filtered prior to analysis. However, dieldrin was detected in 2 of 5 unfiltered USGS samples. Detected concentrations equaled the typical MRL for the method of 0.001 µg/L. While these
concentrations are less than the 0.0019 µg/L chronic criterion, they significantly exceed the 0.052 ng/L (0.000052 µg/L) human health based criterion.
The two detected dieldrin concentrations indicate that the Pudding River is impaired for dieldrin. Although this impairment was not included on the 303(d) list, DEQ has determined the load capacity and developed a load allocation for dieldrin in the Pudding River.
Pudding River at Aurora (Hwy 99E) (RM 8.1) - Dieldrin USGS and ODEQ data; Values < detection set to MRL
0.00001 0.0001 0.001 0.01 0.1 1 12 /3 1/ 1992 12 /3 1/ 1993 12 /3 1/ 1994 12 /3 1/ 1995 12 /3 0/ 1996 12 /3 1/ 1997 12 /3 1/ 1998 12 /3 1/ 1999 12 /3 0/ 2000 12 /3 0/ 2001 12 /3 1/ 2002 12 /3 1/ 2003 12 /3 0/ 2004 12 /3 0/ 2005 12 /3 0/ 2006 12 /3 1/ 2007 µg /L USGS Dieldrin (filtered) USGS Dieldrin (unfiltered) ODEQ Dieldrin Chronic toxicity based criteria Human Health based criteria Dieldrin MRLs
Dieldrin - Agriculture Sites
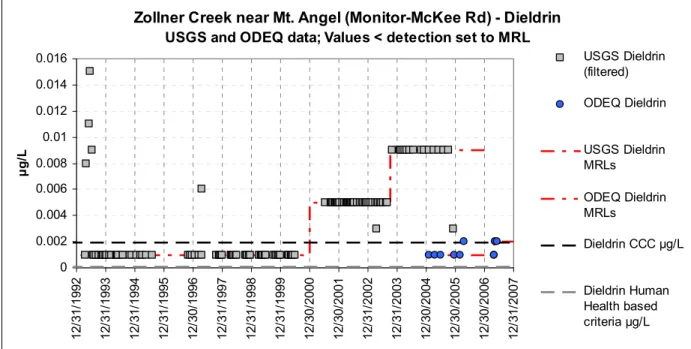
Sampling was performed by both USGS and ODEQ at the Zollner Creek near Mt Angel USGS gage (Monitor-McKee Road Bridge, USGS Gage no. 14201300, ODEQ LASAR No. 10899). Dieldrin is a legacy pesticide which, presumably, has not been applied to Willamette Basin croplands for many years. Therefore, dieldrin concentrations should be declining. A number of significant exceedances of the State of Oregon 0.0019 µg/L chronic and 0.052 ng/L (0.000052 µg/L) human health based criteria were observed in the 1990s. Since then dieldrin has been detected only occasionally (Figure 4 - 13).
Zollner Creek near Mt. Angel (Monitor-McKee Rd) - Dieldrin
USGS and ODEQ data; Values < detection set to MRL
0 0.002 0.004 0.006 0.008 0.01 0.012 0.014 0.016 12 /31 /1 99 2 12 /31 /1 99 3 12 /31 /1 99 4 12 /31 /1 99 5 12 /30 /1 99 6 12 /31 /1 99 7 12 /31 /1 99 8 12 /31 /1 99 9 12 /30 /2 00 0 12 /30 /2 00 1 12 /31 /2 00 2 12 /31 /2 00 3 12 /30 /2 00 4 12 /30 /2 00 5 12 /30 /2 00 6 12 /31 /2 00 7 µg /L USGS Dieldrin (filtered) ODEQ Dieldrin USGS Dieldrin MRLs ODEQ Dieldrin MRLs Dieldrin CCC µg/L Dieldrin Human Health based criteria µg/L Figure 4 - 13: Zollner Creek near Mt. Angel - "Worst Case" Dieldrin concentrations
Since April, 1997, when a 0.006 µg/L concentration was observed, dieldrin has been detected by USGS only once in Zollner Creek, a 0.003 µg/L estimated concentration observed April, 2003. However, the low frequency of detection may be due to relatively high recent MRLs. The MRL for USGS analyses
increased from 0.001 µg/L to 0.005 µg/L in 2000 and to 0.009 µg/L in 2002 (Figure 4 - 13). Therefore, it’s inconclusive from this data whether concentrations greater than the 0.0019 µg/L chronic criteria occurred. DEQ monitored Zollner Creek pesticides starting in 2005, with the MRL generally at 0.001 µg/L. Dieldrin was detected in 2 of 10 samples, with 0.002 µg/L detected April 2006 and 0.001 µg/L detected May 2007 (however, a field duplicate collected at the same time as the May 2007 sample had a concentration below detection, so the second detection may not be conclusive). Neither detection exceeded the chronic criterion, but both exceeded the very low human health based criterion.
Dieldrin - Forestry Sites
Dieldrin was not detected by either USGS or ODEQ at forestry sites.
Dieldrin - Fish tissue concentrations
Fish tissue dieldrin concentrations were measured by USGS in the Pudding River, Zollner Creek, and Little Abiqua Creek in 1992, 1993, and 1997 (Table 4 - 13). Dieldrin was not detected in fish tissue from Little Abiqua Creek or the Pudding River. However, dieldrin was detected in 3 out of 4 samples from Zollner Creek. In these samples dieldrin concentrations exceeded the DHS assumed action level for dieldrin of 2.3 µg/kg.