73:3 (2015) 35–41 | www.jurnalteknologi.utm.my | eISSN 2180–3722 |
Full paper
Jurnal
Teknologi
A Review on Electrical Capacitance Tomography Sensor Development
Noor Amizan Abd. Rahmana, Ruzairi Abdul Rahima*,Abdullah Mohd Nawib, Leow Pei Linga, Jaysuman Pusppanathana, Elmy Johana
Mohamadc, Chan Kok Seongd, Shahrulnizahani Mohammad Dina, Nor Muzakkir Nor Ayoba, Fazlul Rahman Mohd Yunusa
aProtom-i Research Group, Infocomm Research Alliance, Control and Mechatronic Engineering Department, Universiti Teknologi Malaysia, 81310 UTM Johor Bahru, Johor, Malaysia
bLanguage Academy, Universiti Teknologi Malaysia, 81310 UTM Johor Bahru, Johor, Malaysia
cDepartment of Mechatronics and Robotics Engineering, Faculty of Electrical & Electronics Engineering, Universiti Tun Hussein Onn Malaysia, Pt. Raja,
86400 Bt. Pahat, Johor, Malaysia
dEvolusi Engineering, Skudai, Johor, Malaysia
*Corresponding author: [email protected]
Article history
Received :15 August 2014 Received in revised form : 5 January 2015
Accepted :10 February 2015
Graphical abstract
Abstract
Electrical Capacitance Tomography (ECT) detects changes in the distribution of transparency in enclosed areas or pipes. Until now, various methods have been used to determine the optimum ECT sensor for a particular application. Some important parameters that affect the sensitivity of the sensor cannot be ignored. Design factors discussed in this paper study the needs in industry by producing the best image, without affecting the operation of the process. From previous studies many parameters influence the quality and effectiveness of an ECT sensor. The parameters that play important roles in ECT sensor design include the thickness and type of material in the pipe wall between the electrodes and the sensing zone, the thickness and material of the pipe wall separating the electrodes and the screen, the size of the electrodes, the guarding used, example radial guards or plane axial guards, and whether end guards are used. Other matters of concern regarding the dimension and the distance between the electrodes with guardians it is important design factor. Electrodes positioned either inside or outside the vessel will affect the cost factor design to the type of system to be used. This overview of the study is a basic guide for the essential requirements for an ECT sensor system design.
Keywords: Electrical capacitance tomography; sensor parameter and structure design
© 2015 Penerbit UTM Press. All rights reserved.
1.0 INTRODUCTION
The word ‘tomography’ is derived from the Greek words ‘tomo’ meaning ‘to slice’ and ‘graph’ meaning ‘image’. The Oxford English Dictionary defines tomography as ‘radiography’ in which an image of a predetermined plane of the body or other object is obtained by rotating the detector and the source of radiation in such a way that points outside the plane produce a blurred image. Tomographic technology involves the acquisition of measurement signals from sensors located on the periphery of an object, such as vessel or pipeline [1]. This gives information on the nature and distribution of components within the sensing area. Most of the tomographic techniques are concerned with abstracting information to form cross sectional images. This can be done by placing sets of array sensors (mainly electrodes) around the pipes to be imaged. The sensing field interrogates a projection of a suitable radiation across the materials of interests, which is assumed to be a circular cross section [2].
Recently, tomography has been well accepted in the process industry application due to the need of monitoring process and control [3]. It helps users to identify the process flow via image reconstructed non-invasively. Typically, the 'image' of the cross sectionis reconstructedfromthe measured dataset. Manyways have been explored, including ultrasonic excitation, electromagnetic, nucleonic and electricity. One of the tomography modalities is Electrical Capacitance Tomography (ECT), which detects the variation of permittivity distribution in the closed region or pipe.
Use appropriate algorithm affect good imaging results as the location measurement is made between the capacitor electrodes around the vessel monitoring.ECT is a non-invasive technique, in which the process flow is not been interrupted and the flow in the pipe does not need to be stopped. Generally, the ECT sensor is mounted outside the pipe or vessel wall, with the number of electrodes determined by the designer based on the result required, and the process environment such as the size of the pipe.
This feature makes ECT superior to Electrical Resistance Tomography (ERT), wherethere is nointerruptioninthe process, especially when operations involving real-time monitoring of ongoing operations. Therefore, ECT has been treated as new method tomography replace
d
the existing system before using many ERT systems
for applications in industrial tomography [5]. The key difference between ECT and ERT sensors is that ERT electrodes are in direct contact with the process [6], where as if theprocessinvolves heating thesubsurfaceor steaminjection, the liquidsaturationchangeswill affect theelectricalresistivity ofthe nextresolution on thesensitivityexperiencinga disruption of the process data received. ECT electrodes are insulated through a thin non-conducting liner. ECT sensors comprise multiple electrodes arranged around the circumference of a pipeline. The most common arrangement is for external electrodes to be mounted on a section of non-conducting pipe with an external earthed screen. The electrodes can be etched from flexible copper coated laminate. This arrangement has the advantage that the electrodes are non-invasive and non-intrusive. The circular sensors are suitable for most pipelines and generally used for monitoring the flow of oil / gas systems or pneumatic conveying of powders, grain or plastics [7].2.0 GENERAL DESIGN PRINCIPLES
Generally ECT has three main components group. The first is the capacitance sensor comprising electrodes mounted on the edge of the pipe to be sensible view in the imaging process. The second groupincludesthe capacitance unitto acquireand process the signals from the sensor capacitance measurements. The last group is the computer controls including the coaxial cable and connector, which display a reconstruction of the image of the process flow distribution from data obtained. Figure 1 show the basic configuration of ECT, which consists of the architecture of the ECT system. From theobservation ofprevious builds, usually the ECTsensorisround, andthe electrodesare arrangedin the formof single plane or twin plane. The ECTsensordiameteris between 1 and 4 inches [8].
There are several factors to be considered to design the ECT effectively [9]. First, they comprisemeasuringthe meanslopeof the sensor sensitivitymeasurement curve.The ECT sensor is a soft-field sensor, which the sensitivity decreases towards the centre of the pipe.
Another factor that needs to be considered is the dynamic range; which is the ratio between large stand smallest output sensors resulting in the reconstruction phase. Received signal strengthdepends on thedistancebetweenthesensorsinstalledin the test sample. This gap distance needs to be as minimal as possible to minimize the potential loss of the system. However, the image reconstruction can be improved by increasing the amplitude and avoiding the sensor distortion from the measurement range [10].
The connection of the guard electrodes need to be secured properly to avoid stray capacitances and ground loops. The driven-guard technique is applied to remove or reduce stray capacitance [11].If the sensor electrodes are short compared to
[image:2.612.323.560.141.223.2]the diameter of the sensor; extra axial guard electrodes will normally be required at each end of the measuring electrodes. The guard electrodes are used to maintain a parallel electric field pattern across the sensor in the region of the measuring electrodes by preventing the electric field lines from spreading axially at the ends of the measuring electrodes. This improves both the axial resolution and the sensitivity of the sensor [12].
Figure 1 Architecture of the ECT system[13]
Imaging resolution can be improved by increasing the number of electrodes or channels. However, by increasing the number electrodes, the sensor area will be decreased, which effects measurement sensitivity and signal strength of the sensor [13]. Imaging speed depends on the total number of measurementchannels and
i
maging speed depends on the total number of measurement channels and speed imaging process that occurs depends on the frequency [14, 48].The ECT system structures are determined depending on purpose and the environment of testing. This determination factor involves the sensor material, pipes material and the material that is being examined [15, 47].
Surface contact is a major source of uncertainty. The problem can be accrued during adjusting the gap between an ideal monitoring sample and object. The sensor electrode does not follow the specific data required. Saline gel is usedto improve the surface contact of the electrode in ECT system designs [16]. Contact measurement known as ‘Debye Layer’, which is the interface between the sensor and sample. This phenomenon can be avoided by using non-contact measurement and adding a passive layer. Substrate and backplane geometry occurs due to their close proximity to drive the top of the electrode substrate [17]. Cross talk between channels applies when adjacent electrodes are positioned close to one another. This cross talk can be controlled by applying the electrode size limitation [18].
3.0 DEVELOPMENT OF A CAPACITANCE SENSOR
The sensor is a device operational that provides support for the imaging process. The sensor is composed of a number of electrodes mounted in the periphery of the pipe. There are two types of electrode installation; external and internal. The typical ECT installs the electrode externally because it is easier to be installed, designed and fabricated. Furthermore, external electrodes are non-intrusive and not subjected to extreme temperatures, high temperature & turbulence condition data. Compared to internal sensor design, the system requires more complex design and needs to withstand extreme temperature and corrosion inside if fluid is corrosive [19].
proportional to the transparency of the charge in the vessel [20]. In addition, the determination method of installation depends on the type of electrode used plumbing pipes. If pipes made of conductor material, the internal electrode technique is used.
I
f the pipe is made of insulating material, the electrode should be installed with the external method.The signal from the sensor is sent to the control computer. The computer processes the information obtained and reconstruct cross-sectional images of the rate of change in capacitance pipe. Measurement between two electrodes in the presence of 0.2 fF dug into the earth stray capacitance of 200 pF at 2000 measurements per second. Some designs capacitance between any pair of electrodes around 10 onwards [21]. The minimum length of the electrode axis of 3.5 cm to 8 sensor electrodes, or 7 cm to 12 sensor electrodes [22].
Each electrode can be configured to act as a source or detector. During normal operation one electrode is the source, while the other is a detector with an output proportional to the measured capacitance. Generally the signal received by the adjacent electrodes is about ten times more than opposite electrodes. It is desirable to regulate the output of each sensor is zero when the pipe is filled with a minimum of transparency, and full scale (FSD) when a pipe filled with a maximum of transparency. Therefore, it is common to provide a programmable gain as increased dynamic range instruments. To reduce the effects of noise, it is desirable for all off-chip communication to be digital. All measurement data bit in series between integrated electrodes and host computer [23].
Material used for a pipeline, usually made of organic glass, because pipelines are insulated with this material to easy monitor the fluid path. The electrodes are usually made of copper foil and a protective electrode comprising a protective cover and radial electrode as shown in Figure 2. Radial electrode not only reduces the dynamic range of the measured change in capacitance value and difficulty in circuit design data acquisition, but also can improve circulation sensitivity space. The overall structure parameters become important and can affect sensor performance and quality of image reconstruction. Therefore, a model [24-26] to analyze the effect of radial electrodes on the capacitance and distribution of sensitive areas is developed, as seen in Figure 3.
Figure 2 Copper foil and the shielding electrode comprises a shielding cover and radial electrodes [23]
Figure 3 Influence of radial electrodes on capacitance values and the distribution of sensitivity field [24]
[image:3.612.385.515.59.179.2] [image:3.612.69.270.485.634.2]The ECT sensor consists of several key areas of measurement electrodes, external insulation frame, axial and radial end of the screen, and a coaxial cable and connectors. Generally, the ECT system fabricated between 8 or 12 electrodes with a length of 10 cm is installed outside the frame work of the insulation and enclosed by a grounded outer screen following Figure 4[27].
Figure 4 Cross-section of sensors with external and internal electrodes [27] 4(a) External Electrodes, 4(b) Internal Electrodes
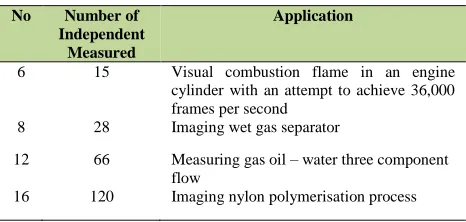
Another topic that needs to be considered is the number of electrodes. The small number of electrodes used in the system produces less parallel data acquisition. The number of electrodes depends on the size of the pipe as well as the electrode itself. The number of electrodes also relates to the independent measurement of the system, generally for an n-electrode system, the number of independent measurements N is given by the following Equation 1, of combination;
𝑀 =
𝑁 (𝑁−1)2(1)
For a 12-electrode system, this number is 66.
problems forimage reconstruction [28],while the rate of data acquisitionperiodwilloccurmoreslowly
.
Table 1 Relationship number of electrode inside process ECT
No Number of Independent
Measured
Application
6 15 Visual combustion flame in an engine cylinder with an attempt to achieve 36,000 frames per second
8 28 Imaging wet gas separator
12 66 Measuring gas oil – water three component flow
16 120 Imaging nylon polymerisation process
The length of the electrode is also important in designing the ECT system. The shorter electrode will provide better dynamic factors. The typical electrode length is 4 inches (~ 10 cm) [29]. For example, for the 12 -electrode ECT, the value for capacitance between 0.5 pF, that means sensor diameter reduced and length electrode will reduced to 5 cm [30].
In a previous study, suggested to additional component for driven guard at both ends of the measurements. This fabrication is to enable short measurement electrodes to be used. Two driven guard electrodes in the same axial line as the excitation electrode are applied the same excitation signal, while all other electrodes are kept at either real ground or virtual ground. By applying this arrangement, the fringe effect can be relieved because the electric field is prevented from spreading in the axial dimension, and hence shorter measurement electrodes may be used.
There are three types of earthed screens to apply in ECT: the outer screen, the axial end screen and the radial screen. Typical ECT design applies earthed axial screens at both ends to reduce external noise to some extent. The earthed axial screens have negative effect on capacitance measured because of the electrical field [31].
Current needs of the masses of these systems are used in an industry that has operated the operating temperature and pressure as used in current production engineering. Usually ECT system can be operating at temperatures up to 300°C [32], while the process pressure up to 150 bar there needs to be higher [33]. Previous method the testing used a capacitance meter multi-phase flow, which can stand up to high temperatures and high pressures. Application of twin plane is used for velocity profile and distance measurement. Twin plane measurement is applied for long pipe fabrication, but it produces poor cross correlation [34].
Therefore, in this review, a 12 electrode electrical capacitance tomography system is developed. This system can provide more data for processing to obtain more precise images of the pipeline. However, the number of electrodes in an ECT system is inverse proportional to the size of the electrodes. Decrement of electrodes’ size will lower the sensitivity of the sensor towards the materials being investigated, and therefore lessen the Signal to Noise Ratio (SNR) of the system. In order to reduce the noise in the system, an on-plate signal conditioning board is applied in this research to eliminate certain noise sources from the analogue transmission line.
A key requirement of the imaging system is only a measuring circuit to measure the capacitance between the selected pair of electrodes, and it should not be sensitive to stray capacitance between the measuring electrode and the earth. This shows that the stray immune capacitance measuring circuit should be used for the measurement. The examples of
stray-immune circuit are AC bridge arm ratio of output current and switch-capacitor charge transfer circuit [35]. AC bridges typically operate with low excitation frequency of 100 kHz, and they are more of a charge transfer circuit in terms of in terms of low basic drift and high SNR.
Charge transfer circuit to rate the shorter the switching frequency up to 2 MHz Parallel channels can be used with each having a demodulator and this step can reduce the cost and complexity of the structure of electronic circuits. Besides helping in the complexity of data transfer with a short period and reduces noise and drift basic level.
Capacitance measurement method based on the sample object to the measured electrical capacitance difference when charged and discharged, and this process involves no noise created during the measurement. A capacitance measurement system of 12 electrodes was constructed based on the new measurement circuit [36]. Test results show the data acquisition time of 66 capacitors (to reconstruct an image) is less than 1.25ms [37]. Circuit structure consists of an electrode, the electrode projected guards, screens, and pipe insulation and circuit capacitance to voltage (-ve). Conversion of the data acquisition system is fixed on the guard electrode projected. A printed circuit board is connected to the flex cable. Each electrode is connected to a capacitance-measuring circuit module. There are 12 modules for a 12-electrode ECT system.
Advantages of using this method, each electrode link to connect by individual directly into the printed circuit board and stay on the screen. There is also the additional modules and data acquisition software. If any measurement module fails, simply replace the defective one with a new one, because all the modules for each electrode are identical. While the cable length between electrodes printed circuit board to only a few centimeters in length and cable type consists of 'noon-screened'.
This arrangement can reduce the effects of
a
stray capacitancewire. The signals to theflexcable that connect the sensorandmain boardare the control signalandthe measured capacitance. A mobile cable has no influence on the measurement. Because the capacitancemeasurement moduleis fixedbelow the screen, the size of theprinted circuit boardfrom the screen canbe verysmall. Sensorsanddata acquisitionsystem scan be set together.This method can reduce the influence of restructuring moves at the measurement cable. The data acquisition systemcanbemorecompact.Thus the capacitance measures only charged /discharged onceinameasurementcycle. In principle, there is no noiseat the output ofthe measurementcircuit. A parallel detection scheme, which can reduce measurement
times,
is used in the system. The cross-sectional image of the distribution electricity transparency to conduct measurement of a non-electric object.It can be used to map the com position of themixture oftwo phases such as gas-
oil system andprovidesa useful toolforvisualization and measurement ofmultiphase flowandpotential applicationsin the petroleum industry.Principle
ECT sensor gets the signal from the measured capacitance value is then used reconstruction algorithm suitable for image distribution transparency. Even so linear, iterative or regularizing the inversion technique commonly usedto introduceunwanted smoothingeffectsin the reconstructed images, maybecome unstableormaynotconverge to thedesiredsolution[38].Testing methods use Inversion SA of static physical model and simulate the normal distribution pattern of two-component flow. Inversion technique has several advantages compared to approaches based on damping least square inversion: they find a good solution beginning with poor initial model, implement complex in format ion easier priori, and do not introduce smoothing effects in the final permittivity. SA application to measured data inversion ECT has provided us favorable results. This method does not require model, synthetic data with noise and without noise. Create good results with real data inverting, acceleration procedures will be reviewed using the sling regularly in space that could justify a reduction in the number of parameters by an order of magnitude [39].
Charge coupled device has been used (abbreviated as CCD) as a linear image sensor in optical tomography for imaging different particle sizes [40]. In measurement system, which is composed off our CCD linear image sensors, is configured round a pipe flow for four octagonal projection systems.
The basic capacitance measurement principle used in ECT is shown in Figure 5 [41]. An alternating voltage (Vs) is applied
between one electrode (the source electrode) and ground and the resulting currents A which flow between the source electrode and the remaining (detector) electrodes to ground are measured. These currents are directly proportional to the capacitances between the source and detector electrodes. The set of capacitance measurements made when one electrode is excited as a source is known as a "projection".
In ECT a complete set of measurement projections is made by exciting each electrode in turn as a source electrode and measuring the currents which flow into the remaining detector electrodes. So for an 8 electrode sensor, there will be 8 x 7 = 56 possible capacitance measurements. However, as half of these will be reciprocal measurements (the same capacitance should be measured by exciting electrode 1 as a source and measuring the current into electrode 2 as is obtained by exciting electrode 2 as a source and measuring the current into electrode 1), there will only be 28 unique capacitance measurements for a complete set of projections.
The current measurement circuits ‘A’ in Figure 5 are chosen to have very low internal impedance, which ensures that all of the detector electrodes are held close to ground potential at all times. As the source electrode is also held at a fixed potential at all times, this capacitance measurement circuit has the important property of stray immunity, that is, it does not respond to any capacitances between individual electrodes and ground. This is important, because the capacitances between electrodes and ground will normally be much larger than the inter-electrode capacitances and may vary due to flexing of connecting leads.
The alternating source voltage is a nominal 15V p-p square wave at an excitation frequency in the range 1 to 10 MHz.and can capture frames of data at speeds up to 5000 frames per second with sound effects are low [42].
The capacitors can be measured between a pair of electrodes (which effectively becomes a new “virtual electrodes”). Most work to date has used a circular ship most convenient arrangement in which the capacitor is measured between a single pair of electrodes. Measurement sequences for protocol 1 are shown in Figure 5 [43] and involve the alternating voltage of the supply source impedance and the impedance of the electrodes. Balance (detector) electrodes at zero (virtual ground) potential and the current flowing into the electrode sensors (and proportional to the capacitance between the electrodes) were measured. The second electrode is then selected as the source electrode and the sequence is repeated until all possible capacitor electrode pairs were measured.
[image:5.612.357.529.84.264.2]Generate ‘M’ independent capacitance is measured to determine the number of electrodes through Equation 1.
Figure 5 Capacitance measurement principle [44]
Any measuring system has to follow certain protocols or sets of well-defined and properly established procedures to extract meaningful information from the sensor. Here the term protocol mainly refers to the sequence used to excite the sensor electrodes, and the order in which the signals are acquired.
In tomography, the object to be imaged is surrounded by electrodes, which act as both sources and detectors. The electrodes are excited one by one, or in pairs depending on the protocol used. At any point in time only one electrode or a pair of electrodes is excited, while the remaining electrodes function as detectors. Typically, ECT systems use 12 electrodes to acquire data regarding the inter-electrode capacitances. The data collected is used for constructing the permittivity distribution images in the subsequent stages. The electrodes are numbered as shown in Figure 2 [45]. Different protocols can be devised as the capacitances between any two electrodes can be measured, and any sequence can be followed in exciting an electrode or a pair of electrodes.
acquisition rate. For an ECT system having ‘E’ electrodes and
using protocol number ‘P’, the number of independent inter-electrode capacitance measurements ‘M’ is given in Equation 2.
𝑴 =
(𝑬)∙(𝑬−(𝟐𝑷−𝟏))
𝟐
(2)
Protocol 1, is highly compatible with LBPA for reconstructing of the permittivity distribution images using the measured inter-electrode capacitances. LBPA is moderately efficient and fast when it comes to on-line reconstructing of images. It is the most preferred algorithm for reconstructing permittivity distribution images in the industry. For a typical capacitance sensor with 12 electrodes and using protocol 1,66 independent inter-electrode capacitances can be measured.
4.0 CONCLUSION
Electrical Capacitance Tomography is a method to detect the distribution of transparency in the ongoing process of non-conductive liquid phase. Thispaperdiscusses thestructurein the construction of a system that was developed by previous researchers. Important factors ECT system design consists of several key elements, such as the number ofelectrodesused, can affectthe rate ofresolution ofthe imageproduced. In addition, thelengthofthe electrode, and whether the electrodepositionis installed either inside or outside the pipeline, depends on the suitability or object being monitored. The composition of the earthscreen iscategorized intoanouterscreen,radialaxialend screensandscreens. Applications use this system in practice to the exposure process in the temperature range and the high pressure system to assess the level of sensitivity. With some changes in the design of structures previously described as an inducement to use the system. In addition to the advantage of very low levels of noise, wide dynamic measurement range, and high immunity to stray capacitance to ground and can run at high speed measurement process.
Acknowledgement
The author would like to thank Universiti Teknologi Malaysia for supporting the research study (vot. no. 03H31 & 03H96) and also this appreciation goes to the other members in PROTOM-i research groups for their honorable cooperation.
References
[1] Prof. L. R. Subramaniam and Sharath Subash Donthi. 2004. Capacitance
Based Tomography for Industrial Application. M.Tech Credit Seminar Report. Electronic System Group, EE Dept. IIT, Bombay.
[2] Williams R. A and M. S Beck. 1995. Process Tomography Principles,
Techniques and Application. United Kingdom: Butterworth Heinemann Ltd.
[3] M. S. Beck. 1999. Special Issue of Measurement. Science &
Technology. Process Tomography. (7): 3.
[4] Capacitance Level Measurement 1998 VEGA Controls Limited
(Seminar Series, The Institute of Measurement and Control).
[5] A. Hunt., J. Pendleton., M. Byars. Non-intrusive Measurement of
Volume and Mass using Electrical Capacitance Tomography. Process
Tomography Limited. Cheshire, United Kingdom.
[6] S. J. Stanley., G. T. Bolton. 2008. A Review Of Recent Electrical
Resistance Tomography (ERT). Applications Forwet Particulate
Processing. Part. Part. Syst. Charact. 25: 207–215.
[7]
http://www.directindustry.com/prod/industrial-tomography- systems/electrical-capacitance-tomography-ect-sensors-40901-1503071. 14 Dec 2014.
[8] Jaworski A J., Dyakowski T., Davies G. A. 1999. A Capacitance Probe
For Interface Detection In Oil And Gas Extraction Plant. Meas. Sci.
Technol. 10:15–20.
[9] S. M. Huang., A. B. Plaskowski., C. G. Xie., M. S. Beck. 1989.
Tomographic Imaging Of Two-Component Flow Using Capacitance
Sensors. J. Phys. E: Sci. Instrum. 22: 173–177.
[10] R. Thorn., S. M. Huang., C. G. Xie., J. A. Salkeld., A. Hunt., M. S. Beck.
1990. Flow Imaging For Multi Compoent Flow Measurement. Flow
Meas. Instrum. 259–268.
[11] Process Tomography Ltd. 1996. Electrical CapacitanceTomography
System Type PTL 300—InstructionManual (Wilmslow, Cheshire:
Process Tomography Ltd).
[12] S. Khan., F. Abdullah., 1991. Computer Aided Design of Process
Tomography Capacitance Electrode System For Flow Imaging. Proc 5th
Conf. Sensor And Their Application. Edinburgh. 209–214.
[13] I. Ismail., J. C. Gamio., S. F. A. Bukhari., W. Q. Yang. 2005.
Tomography For Multi-Phase Flow Measurement In Oil Industry. Flow
Meas. and Instrum. 16: 145–155.
[14] W. Q. Yang. 1996. Calibration Of Capacitance Tomography Systems: A
New Method For Setting System Measurement Range. Meas. Sci.
Technol. 7(6): 863–867.
[15] L. Sun., D. Chen., G. Zheng. 2006. Analysis of Performance and
Capacitance Sensitivity Distributions of Sensor for Electrical
Capacitance Tomography System. Proceedings of the 6th World
Congress on Intelligent Control and Automation. Dalian, China. 4977– 4981.
[16] Y. Holiday N. Dai., R. A. William. M. Wang., G. Lucas. 2005. A High
Performance EIT System. IEEE Sensor. 5: 289–299.
[17] General Design Priciples by X. B. Li, S. D. Larson, A. S. Zyuzin. 2004
IEE.
[18] K. W. Leitner., M. Winter., J. O. Besenhard. 2003. Composite
Supercapacitor Electrodes. Journal of Solid State Electrochemistry.
Publisher Springer-Verlag. 8(1): 15–16.
[19] F. J. Dickin., A. Hunt., B. S. Hoyle., S. M. Huang., O. Iiiyas., C. Lenn.,
R. C. Waterfall., R. A. William. 1992, Tomography Imaging Of
Industrial Process Equipment Review Of Need And Method. IEEE Proc
G Electron Circuit & System. 139(1): 72–82.
[20] Unpublished Class Notes of EE -617, Prof. L. R. Subramanyan,
Department of Electrical Engineering, Indian Institute of Technology, Bombay.
[21] W. Q. Yang. 1997. Modelling of Capacitance Tomography Sensors. IEE
Proc.- Sci. Meas. Technol. 144: 203–208.
[22] Application Note AN 3. 2001. Engineering Design Rules forECT
Sensors. Issue 4, March 2001, Process Tomography Limited, Cheshire, United Kingdom.
[23] S. Liu., W. Q.Yang., H. G. Wang. 2000. Electrical Capacitance
Tomography Sensor With Internal-External Electrodes. Proc. of PIE
Conference: Process Imaging for Automatic Control. Boston. USA. Vol. 4188: 300–307.
[24] G. Chaplin., T. Pugsley., L.Van Der Lee., A. Kantzas., C. Winters. 2005.
The Dynamic Calibration Of An Electrical Capacitance Tomography Sensor Applied To The Fluidized Bed Drying Of Pharmaceutical
Granule. Meas. Sci. Technol. 16: 1281–1290.
[25] Quote From Encyclopedia Britannica. 2009. Dielectrics (Physics).
Britannica. 1.
[26] P. M. Williams., R. J. Haycock., T. A. York. 1998. Integrated Electrodes
for Electrical Capacitance tomography. IEEE Instrumentation and Measurement. Technology Conference St. Paul, Minnesata, USA Department of Electrical Engineering & Electronics.
[27] D. Y. Chen., G. B. Zheng. 2004. Simulation Of Sensors And Image
Reconstruction Algorithm Based on Genetic Algorithms For Electrical
Capacitance Tomography System. Journal Of System Simulation. 16(1):
152−154.
[28] Olmos, A. M., Primicia, J. A., Marron, J. L. F. 2006. Influence Of
Shielding Arrangement On ECT Sensors. Sensors. 6: 1118–1127.
[29] D. Y. Chen., X. Y. Yin. 2006. The Optimized Design And Simulation
Of Electrical Capacitance Sensor For Electrical Capacitance
Tomography System. Journal Of Electronic Measurement and
Instrument. 20(1): 22–27.
[30] Y. Y. Zhang. 1991. Dielectric Physics. Xi’an Jiaotong University Press
[31] Yan, H., Shao, F.Q., and Wang, S. 1998. Fast Calculation Ofsensitivity
Distributions In Capacitance Tomography Sensors. Electron. Lett.
[32] H. Yan, F. Q. Shao, H. Xu and S. Wang. 1999. Three-Dimensional
Analysis Of Electrical Capacitance Tomography Sensing Fields. Meas.
Sci. Technol. 10: 717–725.
[33] H. Yan, F. Q. Shao, H. Xu and S. Wang. 1999. Three-Dimensional
Analysis Of Electrical Capacitance Tomography Sensing Fields. Meas.
Sci. Technol. 10: 717–725.
[34] W. Yang. 2006. Key Issues In Designing Capacitance Tomography
Sensors. IEEE SENSORS 2006. EXCO, Daegu, Korea. 497–505.
[35] W. Q. Yang, A. Chondronasios, V. T. Nguyen., S. Nattras., M. Betting.,
I. Ismail. 2004. Adaptive Calibration Of A Capacitance Tomography
System For Imaging Water Droplet Distribution. Flow Meas. and
Instrum. 15(5–6): 249–258.
[36] Process Tomography LTD. 2009. Electrical Capacitance Tomography
System. Type TFLR 5000. Operating Manual Issue 1. Volume 1. ‘
Fundamentals of ECT’.
[37] http//:www.tomography.PTL Application Note AN3: Engineering
design rules for ECT sensors, 2001. on 12 October 2014, 1.00am.
[38] T. Dyakowski., M. Miko., D. Vlaev., R. Mann., G. W. Follows. 1999.
Imaging Nylon Polymerisation Processes by Applying Electrical
Tomography. Proc. of 1st World Congress on Industrial Process
Tomography, Buxton. 383–387.
[39] W. Q. Yang., A. Chondronasios., V. T. Nguyen., S. Nattras., M. Betting,.
I. Ismail. 2004. Adaptive Calibration Of A Apacitance Tomography
System For Imaging Water Droplet Distribution. Flow Meas. and
Instrum. 15(5–6): 249–258.
[40] W. Q. Yang. 1996. Calibration Of Capacitance Tomography Systems: A
New Method For Setting System Measurement Range. Meas. Sci.
Technol. 7(6): 863–867.
[41] HOROWITZ, P., and HILL, W. 1989. The Art Of Electronics.
Cambridge University Press. 396
[42] Baoliang W., Haifeng J., Zhiyao H., Haiqing L. 2005. A High-Speed
Data Acquisition System for ECT Based on the Differential Sampling
Method. IEEE SENSORS JOURNAL. 1530–437X.
[43] C. G. Xie., S. M. Huang., B. S. Hoyle. 1992. Electrical Capacitance
Tomography For Flow Imaging: System Model For Development Of Image Reconstruction Algorithms And Design Of Primary Sensors.
Proc. Inst. Elect. Eng. 139: 89–98.
[44] Xie, C. G., Huang, S. M., Hoyle, B. S., Thorn, R., Lenn, C. and Beck,
M. S. 1992. Electrical Capacitance Tomography For Flow Imaging-System Model For Development Of Reconstruction Algorithms And
Design Of Primary Sensors. IEE Proc. G. 139: 89–98.
[45] Process Tomography Ltd. 2009. Electrical Capacitance Tomography
System. Operating Manual Type Tflr5000. Fundamentals Of Ect. Wilmslow UK. 1: 2–13.
[46] Application Note AN 1. 2001. Generation of ECT Images from
Capacitance Measurements. Issue 3, Process Tomography Limited. Cheshire, United Kingdom.
[47] E. J. Mohamad, R. Abdul Rahim, P. L Leow, K. S. Chan, M. H. Fazalul
Rahiman. 2011. Hardware Development Of Electrical Capacitance
Tomography For Imaging A Mixture Of Water And Oil. Jurnal
Teknologi-Special Issue on Instrumentation & Sensor Technology.
Universiti Teknologi Malaysia. 54: 425–442.
[48] Shahrulnizahani Mohammad Din, Aizat Azmi, Chee Pei Song, Ruzairi
Abdul Rahim, Leow Pei Ling. 2014. Electric Potential of Various 4-electrode Segmentation Excitation for Electrical Capacitance
Tomography System. Jurnal Teknologi-Special Issue on Advanced
![Figure 1 Architecture of the ECT system [13]](https://thumb-us.123doks.com/thumbv2/123dok_us/8761959.894443/2.612.323.560.141.223/figure-architecture-ect.webp)
![Figure 3 Influence of radial electrodes on capacitance values and the distribution of sensitivity field [24]](https://thumb-us.123doks.com/thumbv2/123dok_us/8761959.894443/3.612.385.515.59.179/figure-influence-radial-electrodes-capacitance-values-distribution-sensitivity.webp)
![Figure 5 Capacitance measurement principle [44]](https://thumb-us.123doks.com/thumbv2/123dok_us/8761959.894443/5.612.357.529.84.264/figure-capacitance-measurement-principle.webp)
