N e u t r o n diff r a c ti o n s t u di e s of
m a g n e t o s t ri c tiv e F e–G a a lloy
r i b b o n s
Z h a o , X, M e llo r s , NJ, Kilcoy n e , S H , Lo r d , DG, L u p u , N, H o ri a , C a n d
H e n ry, P
h t t p :// dx. d oi.o r g / 1 0 . 1 0 6 3 / 1 . 2 8 3 7 2 4 4
T i t l e
N e u t r o n d iff r a c ti o n s t u di e s of m a g n e t o s t ri c tiv e F e–G a a lloy
r i b b o n s
A u t h o r s
Z h a o , X, M e llo r s , NJ, Kilcoy n e , S H , Lo r d , DG, L u p u , N,
H o r i a , C a n d H e n ry, P
Typ e
Ar ticl e
U RL
T hi s v e r si o n is a v ail a bl e a t :
h t t p :// u sir. s alfo r d . a c . u k /i d/ e p ri n t/ 2 0 7 4 4 /
P u b l i s h e d D a t e
2 0 0 8
U S IR is a d i gi t al c oll e c ti o n of t h e r e s e a r c h o u t p u t of t h e U n iv e r si ty of S alfo r d .
W h e r e c o p y ri g h t p e r m i t s , f ull t e x t m a t e r i al h el d i n t h e r e p o si t o r y is m a d e
f r e ely a v ail a bl e o nli n e a n d c a n b e r e a d , d o w nl o a d e d a n d c o pi e d fo r n o
n-c o m m e r n-ci al p r iv a t e s t u d y o r r e s e a r n-c h p u r p o s e s . Pl e a s e n-c h e n-c k t h e m a n u s n-c ri p t
fo r a n y f u r t h e r c o p y ri g h t r e s t r i c ti o n s .
Neutron diffraction studies of magnetostrictive Fe–Ga alloy ribbons
Xuegen Zhao, Nigel Mellors, Susan Kilcoyne, Don Lord, Nicoleta Lupu et al.Citation: J. Appl. Phys. 103, 07B320 (2008); doi: 10.1063/1.2837244 View online: http://dx.doi.org/10.1063/1.2837244
View Table of Contents: http://jap.aip.org/resource/1/JAPIAU/v103/i7
Published by the American Institute of Physics.
Related Articles
Magnetic and calorimetric studies of magnetocaloric effect in La0.7-xPrxCa0.3MnO3
J. Appl. Phys. 111, 07D726 (2012)
Converse magnetoelectric effect dependence with CoFeB composition in ferromagnetic/piezoelectric composites
J. Appl. Phys. 111, 07C725 (2012)
A model-assisted technique for characterization of in-plane magnetic anisotropy
J. Appl. Phys. 111, 07E344 (2012)
Magnetostriction measurement of a giant magnetoresistance film on a practical substrate covered by a shield layer
J. Appl. Phys. 111, 07E340 (2012)
Dynamic magnetoelastic properties of epoxy-bonded Sm0.88Nd0.12Fe1.93 pseudo-1-3 negative magnetostrictive particulate composite
J. Appl. Phys. 111, 07A940 (2012)
Additional information on J. Appl. Phys.
Journal Homepage: http://jap.aip.org/
Journal Information: http://jap.aip.org/about/about_the_journal
Top downloads: http://jap.aip.org/features/most_downloaded
Neutron diffraction studies of magnetostrictive Fe–Ga alloy ribbons
Xuegen Zhao,a兲Nigel Mellors, Susan Kilcoyne, and Don Lord
Institute for Materials Research, University of Salford, Salford M5 4WT, United Kingdom
Nicoleta Lupu and Horia Chiriac
National Institute of Research and Development for Technical Physics, Iasi 700050, Romania
Paul F. Henry
Institut Laue-Langevin, F-38042 Grenoble, France
共Presented on 7 November 2007; received 12 September 2007; accepted 7 November 2007; published online 1 February 2008兲
Melt-spun Fe–Ga ribbons were prepared and some ribbons were annealed at 1000 ° C for 1 h then slowly cooled to room temperature. X-ray diffraction patterns revealed no evidence of texture and only bcc phase in the as-quenched ribbons. However, high-resolution neutron diffraction patterns gave more information on the structure of these ribbons. Only diffractions from the disordered bcc A2 phase were found in as-quenched ribbons with 15, 17.5, and 19.5 at. % Ga content, without any trace of satellite peaks or splitting peaks from the proposed Ga–Ga pairing superlattice structure. The broadening of the base of the共110兲peaks for all samples except the as-quenched 15 at. % Ga ribbon might indicate the existence of some kind of short range ordering. Ribbons developedL12
phase after annealing especially in the Fe 19.5 at. % Ga ribbon where the formation ofL12phase
reduced the Ga content in the remainingA2 phase and decreased its lattice parameter dramatically. D03phase formed in the as-quenched 22.5 at. % Ga ribbon and the following annealing treatment
transformed moreA2 phase into D03 phase. ©2008 American Institute of Physics. 关DOI:10.1063/1.2837244兴
I. INTRODUCTION
The Fe–Ga system is characterized by a large solid solu-bility of Ga in bcc ␣-Fe, 11 at. % at room temperature, and up to 36 at. % at 1037 ° C.1 However, appreciable amounts of Ga well in excess of the solubility limit can be retained in the metastable disordered bcc solid solution phase 共A2 phase兲at room temperature by rapid cooling.1–3The replace-ment of Fe by Ga results in a large increase in magnetostric-tion, approaching 400 ppm for quenched single crystals4–6at room temperature, with low saturation fields of several hun-dreds of oersted, and over −2000 ppm has been reported for melt-spun Fe–Ga ribbons.7,8The magnetostriction100 maxi-mizes around 17– 19 at. % of Ga and then decreases with increased Ga content.9 The decrease of 100 at higher Ga content coincides with the change of structure from the dis-ordered bcc to a low-energy long range dis-ordered phase共D03兲. Local short-range ordering of the Ga atoms along the关100兴 direction in the disordered Fe structure has been suggested to be responsible for this increase10but experimental confirma-tion still remains a challenge.11,12 This is because the peaks corresponding to bothD03andA2 phases overlap except for
the weak satellite peaks corresponding to the ordered struc-ture. These satellite peaks can generally not be clearly iden-tified due to the very low relative intensities found using x-ray diffraction. Neutron diffraction is expected to give bet-ter results as the difference in atomic scatbet-tering factor be-tween Fe and Ga atoms is bigger in neutron diffraction and the atomic scattering factor does not change with the chang-ing scannchang-ing angle.13
In this paper, we have studied the extent to which the disordered bcc phase can be retained at room temperature by melt spinning in the hope of further increasing100. Neutron diffraction has been used to identify theD03phase and
con-firm the existence of possible short range order.
II. EXPERIMENT
Ingots of Fe100−xGax 共x= 15, 17.5, 19.5, 21, and 22.5兲
were prepared by arc melting high purity共⬎99.9兲constituent elements multiple times to ensure homogeneity. High vapor pressure of Ga and the use of care in the melting procedures resulted in negligible Ga loss. Ribbon samples were pro-duced by melting 3 g of ingot with an induction coil in a partial argon atmosphere and ejecting the melt onto a rotat-ing copper wheel at a wheel speed of 35 m/s. The orifice diameter of the quartz crucible was approximately 0.5 mm. Isothermal heat treatment was performed on some ribbons at 1000 ° C for 1 h followed by slow cooling to room tempera-ture. Ribbons were evacuated in a quartz tube and then sealed under approximately 1 atm of argon before heat treat-ment.
X-ray diffraction examinations were performed using a Bruker D8 Advance diffractometer. The-2scans were ob-tained using CuK␣ radiation in a Bragg–Brentano configu-ration. The x-ray diffraction patterns obtained were used to determine the phases present and the crystallographic texture of the samples.
Neutron diffraction experiments were carried out on both as-quenched and annealed Fe100−xGax共x= 15, 17.5, 19.5, and
22.5兲 alloy ribbons on the D2B diffractometer, ILL at
a兲Electronic mail: [email protected].
JOURNAL OF APPLIED PHYSICS103, 07B320共2008兲
Grenoble, France. Ribbon samples were packed into vana-dium cans and scanned from 0° to 158° at ambient tempera-ture by using the high-resolution mode with a scanning step size of 0.05°.
III. RESULTS AND DISCUSSION
The x-ray diffraction patterns of as-quenched melt-spun ribbons show no evidence of obvious texture. In addition to the primary reflections at 2⬃44°共110兲and⬃64°共200兲, no reflections corresponding to theD03phase were observed.
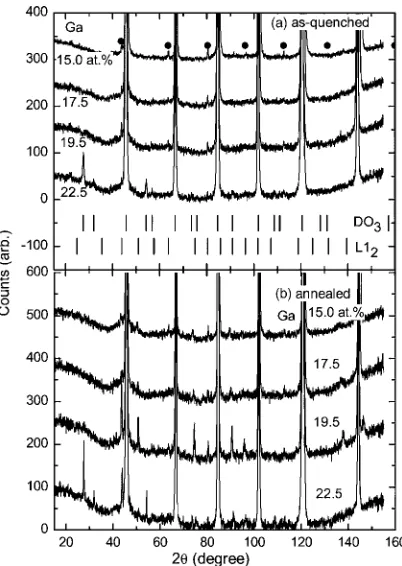
The neutron diffraction patterns from both melt-spun rib-bons and annealed ribrib-bons are shown in Fig. 1. The six strong diffraction peaks can be easily identified as arising from 共110兲, 共200兲,共211兲,共220兲, 共310兲, and共222兲reflections from the bcc共A2 phase兲structure or correspondingly共220兲,
共400兲,共422兲,共620兲, and共444兲reflections from theD03 struc-ture. The ratios of peaks compared with the strongest diffrac-tion peak关共110兲forA2 phase or共220兲forD03phase兴 inten-sities are almost identical among samples.
However, after enlarging the low intensity part of the diffraction patterns, as shown in Fig. 2, we can see some weak diffraction peaks, in addition to the six strong peaks. One group of them belongs to the vanadium container used in the experiment. Vanadium, being bcc with a= 3.0297 Å, has diffraction peaks close to the left of A2 peaks and are clearly shown in the diffraction pattern of Fe 15 at. % Ga melt-spun ribbon. When the Ga content is increased to 22.5 at. %, extra peaks from the ordered Fe3GaD03structure
are observed.
It is mentioned in several papers that Ga–Ga pairs formed along the具100典direction may be responsible for the
high magnetostriction found in Fe–Ga alloys. This kind of ordering results in a structure change from bcc to tetragonal and should give some satellite peaks or even peak splitting.11 These peaks are not expected to be identified from the D03
phase as they will overlap. However, we cannot see any sat-ellite peaks from such a superlattice structure or a noticeable splitting of the observed peaks for ribbons with 15, 17.5, and 19.5 at. % Ga, although these ribbons show only disordered A2 phase. Broadening of the base of the 共110兲peak for all samples except the as-quenched 15 at. % Ga ribbon might indicate the existence of some kind of short range ordering, although the possibility of thermal diffuse scattering from phonons could not be excluded considering that the dramatic elastic softening occurs in these materials with Ga doping.14 More peaks were observed in the patterns from samples which had been annealed at 1000 ° C for 1 h then slowly cooled down to room temperature, especially with x = 19.5 at. % Ga. These new peaks have been indexed as com-ing from a Fe3GaL12phase. It was a surprise to observe this phase appearing in these annealed ribbon samples as it is believed that theL12phase is very difficult to form and we have not seen such a phase in annealed Fe–Ga bulk samples. However, this annealing treatment has not developed a sig-nificant volume of theD03phase in the 19.5 at. % Ga ribbon
and no obvious Bragg peaks from D03 can be seen even in
the low intensity part of the diffraction pattern. This may indicate a structural transformation from A2 to L12, rather
than fromD03toL12 during the annealing process.
[image:4.612.70.274.43.332.2]It is difficult to tell how much A2 phase exists in the 22.5 at. % Ga ribbons. No obvious peak splitting can be seen with the peaks above 60°, in fact, they can be easily fitted with a single-peak profile. However, the percentage of the FIG. 1. Neutron diffraction patterns of as-quenched and annealed Fe–Ga
ribbons.
FIG. 2. Enlargement of the low intensity parts of Fig.1. Peak positions of vanadium共쎲兲,D03andL12phases are also shown.
[image:4.612.335.536.47.330.2]D03 superlattice peak intensities at 2⬃27.5° and 57.2°
compared with the共220兲peak, increases from 1% and 0.5% to 2.4% and 1%, respectively, after annealing, within an un-certainty of⫾0.3%. This increase in intensity seems to indi-cate an increase in the volume ofD03phase after annealing,
which in turn implies that there might be A2 phase in the as-quenched ribbons and someA2 phase be transformed into D03phase after annealing.
To calculate the lattice parameters, we fitted the diffrac-tion patterns with GSAS, a software package for diffraction refinement.15 It has been noticed that the low angle 共110兲 peak is different from all other peaks and cannot be treated as a simple single peak. The lattice parameters calculated from individual peaks from the Fe 17.5 at. % Ga ribbon are shown in Fig. 3, Clearly, the共110兲 peak produces a param-eter well above the average. Although these ribbons are fer-romagnetic materials and there are both magnetic and struc-tural contributions to this peak, the magnetic peak is at the same position as the structural one, and should not affect the calculation of the lattice parameters. The cause of this abnor-mal value is still under investigation.
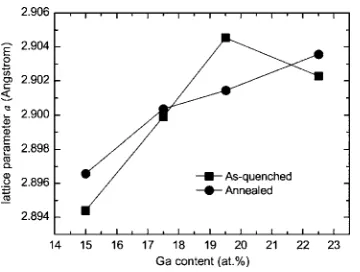
By assuming a bcc共A2兲 structure and only using three high angle peaks to avoid the possible error resulting from the low angle共110兲peaks, the calculated parameteravalues are shown in Fig.4. TheD03structure has a lattice parameter
of 2a.
With the increase in Ga content, the structure of the rib-bons changes from disordered bcc for 19.5 at. % to ordered-bcc structure for 22.5 at. %, which results in a decrease in lattice parameters as expected.16,17
It can be seen from Fig.4 that the ribbon sample with 19.5 at. % Ga shows a significant change in lattice parameter after annealing treatment. The as-quenched ribbon has A2 phase witha= 2.9045 Å. After heat treatment, the ribbon has developed orderedL12Fe3Ga phase and possiblyD03Fe3Ga
phase as well that reduce the Ga content in theA2 phase and, thus, the lattice parameter reduces down to 2.9014 Å. Using this parameter and the relation between composition and lat-tice parameter obtained from the annealed ribbons with 15 and 17.5 at. % Ga, it is estimated that the annealed 19.5 at. % ribbon might have an actual Ga content of 18.1 at. % for the A2 phase, and the volume fraction of L12
phase could be around 20%.
BothD03andL12Fe3Ga phases have different magnetic
properties to disorderedA2 Fe–Ga alloys, and will therefore act as impurities in the A2 matrix, such as rare-earth inclu-sions in Terfenol-D, decreasing the magnetostrictive perfor-mance of the materials. If element 共M兲 substitution or the addition method, in addition to quenching, can be used to hinder the formation of second phase material such as D03
while still maintaining a high Ga content and high Curie temperature, then it may be possible to obtain much higher magnetostriction from Fe– Ga–M alloys.
ACKNOWLEDGMENTS
This work was generated in the context of the MESEMA project, funded under the 6th Framework Programme of the
European Community 共Contract No.
AST3-CT-2003-502915兲.
1H. Okamoto, inPhase Diagrams of Binary Iron Alloys, Monograph Series
on Alloy Phase Diagrams No. 9, edited by H. Okamoto共ASM Interna-tional, Materials Park, OH, 1993兲, pp. 147–151
2C. Dasarathy and W. Hume-Rothery, Proc. R. Soc. London, Ser. A286,
141共1965兲.
3H. L. Luo, Trans. Metall. Soc. AIME239, 119共1967兲.
4J. R. Cullen, A. E. Clark, M. Wun-Fogle, J. B. Restorff, and T. A.
Lograsso, J. Magn. Magn. Mater.226, 948共2001兲.
5R. A. Kellogg, A. B. Flatau, A. E. Clark, M. Wun-Fogle, and T. A.
Lograsso, J. Appl. Phys.91, 7821共2002兲.
6A. E. Clark, M. Wun-Fogle, J. B. Restorff, and T. A. Lograsso, Mater.
Trans., JIM43, 881共2002兲.
7G. D. Liu, X. F. Dai, Z. H. Liu, J. L. Chen, and G. H. Wu, J. Appl. Phys.
99, 093904共2006兲.
8M. C. Zhang, H. L. Jiang, X. X. Gao, J. Zhu, and S. Z. Zhou, J. Appl.
Phys.99, 023903共2006兲.
9A. E. Clark, K. B. Hathaway, M. Wun-Fogle, J. B. Restorff, T. A.
Lograsso, V. M. Keppens, G. Petculescu, and R. A. Taylor, J. Appl. Phys.
93, 8621共2003兲.
10J. R. Cullen, A. E. Clark, M. Wun-Fogle, J. B. Restorff, and T. A.
Lograsso, J. Magn. Magn. Mater.226, 948共2001兲.
11T. A. Lograsso, A. R. Ross, D. L. Schlagel, A. E. Clark, and W.
Wun-Fogle, J. Alloys Compd.350, 95共2003兲.
12T. A. Lograsso and E. M. Summers, Mater. Sci. Eng., A416, 240共2006兲. 13G. E. Bacon, inNeutron Diffraction共Clarendon, Oxford, 1975兲, pp. 39–
40.
14G. Petculescu, K. B. Hathaway, T. A. Lograsso, M. Wun-Fogle, and A. E.
Clark, J. Appl. Phys.97, 10M315共2005兲.
15A. C. Larson and R. B. von Dreele,
GSAS, General StructureAnalysis Sys-tem共LANSCE, Los Alamos National Laboratory, Los Alamos, 1994兲.
16N. Kawamiya, K. Adachi, and Y. Nakamura, J. Phys. Soc. Jpn.33, 1318
共1972兲.
17Y. Nishino, M. Matsuo, S. Asano, and N. Kawamiya, Scr. Metall. Mater.
[image:5.612.86.258.47.176.2]25, 2291共1991兲. FIG. 3. Lattice parameters fitted from individual diffraction peaks of Fe
17.5 at. % ribbons.
FIG. 4. Lattice parameters of as-quenched and annealed ribbons.
[image:5.612.85.265.585.721.2]