FEASIBILITY STUDY ON PRODUCING FUNCTIONAL PARTS USING MOLDING TECHNOLOGY
ADEL MUHSIN ELEWE
A thesis submitted in partial fulfillment of the requirement for the award of the Degree of Master of Mechanical Engineering
Faculty of Mechanical Engineering and manufacturing University Tun Hussein Onn Malaysia
iv
CONTENTS
TITLE PAGE
DEDICATION
ACKNOWLEDGEMENT
ABSTRACT CONTENTS
LIST OF TABLE
LIST OF FIGURE LIST OF ABBREVIATION AND SYMBOLS
LIST OF APPENDIX CHAPTER 1 INTRODUCTION
1.1 Introduction
1.2 Background of study
1.3 Problem Statement 1.4 Objective of Study
1.5 Scopes of Study
1.6 Significance of Study
1.7 Organization of thesis CHAPTER 2 LITERATURE REVIEW
2.1 Introduction 6
2.2 Composites 6
2.3 Electrical Conductivity 7
2.4 Percolation Theory 8
2.5 Factors Affecting Electrical Conductivity 10
2.5.1 Filler Conductivity 10
2.5.2 Particle Size and Morphology 10
2.5.3 Polymer Wets 11
2.5.4 Filler Orientation 12 2.5.5 Packing Factor
2.6 Material Selection
2.6.1 ABS (Acrylonitrile-Butadiene-Styrene)
2.6.2 Copper Powder 16
2.7 Injection Molding 17
2.8 The Effective Injection Molding Process
18
2.8.1 Barrel Temperature
18
2.8.2 Injection Pressure
18
2.8.3 Mold Temperature 18
2.9 Hot-Press Compression Molding 19
2.10 The Effective compression Molding Process 20
2.10.1 Hot-Press Pressure 20
2.10.2 Hot-Press Temperature 21
2.10.3 Hot-Press Time 21
2.11 Summary of Literature Review CHAPTER 3 METHODOLOGY 3.1 Fabrication Methods
23
3.1.1 Plastography 25
3.1.2 Grinding
26
3.1.3 Viscosity and MFI Test 28
3.1.4 Density and Porosity Test 31
3.1.5 Injection Molding Machine 32
3.1.6 Hot-Press Molding Machine 35
3.2 Micro-Structure Analysis 37
3.2.1 Scanning Electron Microscopy (SEM)
37
3.3 Electrical Resistivity Test 38
3.3.1 IV Test 38
3.4 Strength Test 40
3.4.1 Tensile Test 40
3.4.2 Hardness Test 43
3.5 Details of Experiments 44
vi
3.7 Summary 47
CHAPTER 4 RESULTS AND ANALYSIS 4.1 Introduction 48
4.2 Matrix Composition Effect on MIF 49
4.3 All fabricated samples results 52
4.3.1 Injection molding machine samples 52
4.3.2 Hot press molding machine 53
4.4 Matrix Composition Effect on electrical resistance
54
4.4.1 Effect of packing factor
60
4.5 Matrix Composition Effect on Hardness
60
4.6 Matrix Composition Effect on Tensile strength
63
4.7 Matrix Composition Effect on Density 65
4.8 Microstructure analysis 68
CHAPTER 5 DISCUSSIONS 5.1 Introduction 71
5.2 Mechanical Characteristics of Composites 71
5.2.1 Effect of filler content on hardness 72
5.2.2 Effect of filler content on Tensile Properties 72
5.2.3 Effect of filler content on viscosity 73
5.3 Electrical resistivity 74
5.3.1 Effect of filler content on Percolation properties 76
5.3.2 The packing factor 76
CHAPTER 6 CONCLUSIONS AND RECOMMENDATION 6.1 Conclusions 77
6.2 Suggestion for Future Work 78
REFERENCES 84
LIST OF TABLE
NO. TITLE OF TABLE PAGE
2.1 Physical Properties of ABS
2.2 Physical Properties of Copper powder (Madison, 2010) 3.1 Grinder machine data
3.2 Standard test conditions 3.3 Moulding machine data
3.4 Specific data of hot-press machine 3.5 Computer requirements
3.6 Dimensions of tensile test specimen 3.7 Filler percentage
4.1 The MFI experiment result 4.2 Result obtained by Toray Plastics
4.3 Influence of the addition of copper powder 4.4 The I-V test results
4.5 Hardness test results 4.6 Tensile test results
4.7 Results of composite density
viii
LIST OF FIGURE
NO. TITLE OF FIGURE PAGE
2.1 Square lattice diagram with clusters circled
2.2 Dependency of electrical conductivity on filler volume fraction 2.3
2.4 Injection moulding machine
2-5 Hot- press compression molding machine
2.6 The temperature gradient at different times during the press cycle 3.1 Flow chart of the hole study research
3.2 Plastography machine (ceramic polymer lab in UTHM) 3.3 Grinder machine (ceramic polymer lab in UTHM) 3.4 Grinder machine components
3.5 Typical range of viscosity (GLS Thermoplastic Elastomers) 3.6 Melt-flow machine (ceramic polymer lab in UTHM)
3.7 METILER TOLIDO machine (ceramic polymer lab in UTHM) 3.8 NISSEI injection moulding machine (ceramic polymer lab) 3.9 Tensile bars type I
3.10 Hot-Press machine (ceramic polymer lab in UTHM) 3-11 Optical microscopes (ceramic polymer lab in UTHM)
3-12 Electrical Resistivity Testing machine (at COE (MINT-SRC)
24 25 26 27 28 30 31 32 33 34 34 36 37 38 39 41 42 43 (a) Schematic representation of the assumed distribution of poly
3.15 ASTM Tensile test specimen 3.16 Durometer Chart
3.17 Durometer Test Equipment(UTHM lab) 4.1 Composite MIF results
4.2 IInjection molding samples, 4.3 Hot press samples
4.4 Characteristic of electrical resistivity curve for copper filler matrix 4.5 The Relationship between Hardness and Young Modulus
4.6 The Young’s modulus in injection molding 4.7 Rrelationship of density vs filler weight 4.8 Relationship of density vs. hardness
4.9 Relationship of density with Young Modulus 4.10 Relationship of density with porosity
4.11 Void content in ABS
4.12 SEM micrographs of 60% Cu with ABS 4.13 SEM micrographs of 60% Cu with ABS 4.14 SEM micrographs of 70% Cu with ABS
x
LIST OF SYMBOLS AND ABBREVIATIONS
A Area
ASTM American Society for Testing and materials E Young's modulus
F Packing Factor L Time piston stroke I Curve
J Current density P Pressure
Rco Resistance of the contact Rcr Resistance of the circuit R m Resistance of the sample Rp Resistance of the polymer S Average area
V Voltage
Vf Volume of Filler Vp Volume of Polymer d Material density m Mass
t Time v Volume
µ Viscosity
γ Shear rate
σ"c" Critical conductivity σf Filler conductivity
σ"m" Matrix conductivity "Φ" c Volume filler fraction Ω Ohms
viii
LIST OF TABLE
NO. TITLE OF TABLE PAGE
2.1 Physical Properties of ABS
2.2 Physical Properties of Copper powder (Madison, 2010) 3.1 Grinder machine data
3.2 Standard test conditions 3.3 Moulding machine data
3.4 Specific data of hot-press machine 3.5 Computer requirements
3.6 Dimensions of tensile test specimen 3.7 Filler percentage
4.1 The MFI experiment result 4.2 Result obtained by Toray Plastics
4.3 Influence of the addition of copper powder 4.4 The I-V test results
4.5 Hardness test results 4.6 Tensile test results
4.7 Results of composite density
LIST OF FIGURE
NO. TITLE OF FIGURE PAGE
2.1 Square lattice diagram with clusters circled
2.2 Dependency of electrical conductivity on filler volume fraction 2.3
2.4 Injection moulding machine
2-5 Hot- press compression molding machine
2.6 The temperature gradient at different times during the press cycle 3.1 Flow chart of the hole study research
3.2 Plastography machine (ceramic polymer lab in UTHM) 3.3 Grinder machine (ceramic polymer lab in UTHM) 3.4 Grinder machine components
3.5 Typical range of viscosity (GLS Thermoplastic Elastomers) 3.6 Melt-flow machine (ceramic polymer lab in UTHM)
3.7 METILER TOLIDO machine (ceramic polymer lab in UTHM) 3.8 NISSEI injection moulding machine (ceramic polymer lab) 3.9 Tensile bars type I
3.10 Hot-Press machine (ceramic polymer lab in UTHM) 3-11 Optical microscopes (ceramic polymer lab in UTHM)
3-12 Electrical Resistivity Testing machine (at COE (MINT-SRC)
24 25 26 27 28 30 31 32 33 34 34 36 37 38 39 41 42 43 44 (a) Schematic representation of the assumed distribution of poly
x
3.13 I-V Curve obtained by the Oriel I-V Test Station
3.14 Universal testing machine (ceramic polymer lab in UTHM) 3.15 ASTM Tensile test specimen
3.16 Durometer Chart
3.17 Durometer Test Equipment(UTHM lab) 4.1 Composite MIF results
4.2 IInjection molding samples, 4.3 Hot press samples
4.4 Characteristic of electrical resistivity curve for copper filler matrix 4.5 The Relationship between Hardness and Young Modulus
4.6 The Young’s modulus in injection molding 4.7 Rrelationship of density vs filler weight 4.8 Relationship of density vs. hardness
4.9 Relationship of density with Young Modulus 4.10 Relationship of density with porosity
4.11 Void content in ABS
4.12 SEM micrographs of 60% Cu with ABS 4.13 SEM micrographs of 60% Cu with ABS 4.14 SEM micrographs of 70% Cu with ABS
LIST OF SYMBOLS AND ABBREVIATIONS
A Area
ASTM American Society for Testing and materials E Young's modulus
F Packing Factor L Time piston stroke I Curve
J Current density P Pressure
Rco Resistance of the contact Rcr Resistance of the circuit R m Resistance of the sample Rp Resistance of the polymer S Average area
V Voltage
Vf Volume of Filler Vp Volume of Polymer d Material density m Mass
t Time v Volume
µ Viscosity
γ Shear rate
xii
ρ Density
x Ristance
σ"c" Critical conductivity σf Filler conductivity
σ"m" Matrix conductivity "Φ" c Volume filler fraction Ω Ohms
LIST OF APPENDIX
APPENDIX TITLE PAGE
I List of literatures review 83
II Gantt Chart for Master’s Project 1 86 III Gantt Chart for Master’s Project 2 87
1
CHAPTER 1
INTRODUCTION
1.1 Introduction
3
1.3 Problem Statement
UTHM).
1.4 Objective of Study
The objective of this study is to investigate the feasibility of producing functional parts by mixing metallic particles into the polymer matrix materials using the available plastic molding technology. In order to achieve the objective, some of the tasks are planned which are:
i. To investigate the effective mixture of the materials used on producing the functional parts using the packing factor method.
ii. To assess the strength of the composite to prove its strength characteristic and the resistivity of the parts to determine its electrical conductivity.
iii. By validating the formulation of the metal-plastic from mold technology proposed.
1.5 Research Scopes
The scopes of the study are:-
i. The main technology used to produce samples is molding technology.
ii. The resistance of the functional parts will be measured IV test which is measure the current flow into the specimen.
5
iv. The polymer material compositions used are (Acrylonitrile-Butadiene- Styrene) ABS
v. The metallic particles used are copper powder material.
1.6 Significant of Study
Thermoplastics are non corrosive, are lighter, and are often more cost effective than metals . It can be tailored for specific applications and properties depending on the matrix of the material. This work has been conducted by varying the amount of a filler in a composite material to fill the gap between metal and polymer in order to enable to produce more functional composite material combine the advantageous properties of metals and plastics including high electrical conductivity at low filler loading levels, and also controlling the electrical and physical characteristics which determines the variety of ranges of their application by offering a wide fabrication range of design flexibility.
1.7 Organization of Thesis
CHAPTER 2
LITERATURES REVIEW
2.1 Introduction
The purpose of this literature review is to provide background information on the issues to be considered in this thesis and to emphasize the relevance of the present study. This treatise embraces some related aspects of polymer composites with special reference to their electrical conductivity and stress characteristics.
2.2 Composites
7
Various kinds of polymers and polymer matrix composites reinforced with metal particles have a wide range of industrial applications such as heaters, electrodes, composites with thermal durability at high temperature etc. (Kumlutas, 2006). In the past, composites, such as coconut fiber/natural rubber latex was extensively used in 40 years of applications such as boat hulls, corrugated sheet, pipe, automotive panels, and sporting goods (Rodney, 1988).
Today, many thermoplastic-based materials have also been developed to address a wide range of applications. Many researchers improved the composite material properties such as low mechanical properties (Impact, Tensile, Flexural Strength, and hardness) (Bell et al., 2008) (Robert, 2014) (Wilkinson, 2013) (Carlos
et al., 2003). Essentially, the advantage of a composite material is the ability to
combine the desired properties of its building blocks. To date, the driving force in the development of composites has been enhanced strength-to-weight ratios in the aircraft industry (Rodney, 1988), but now cost advantages are also becoming a major factor, particularly in automotive applications. There is even a burgeoning industry to incorporate sustainable materials into composite structures (Wilkinson, 2013).
2.3 Electrical Conductivity
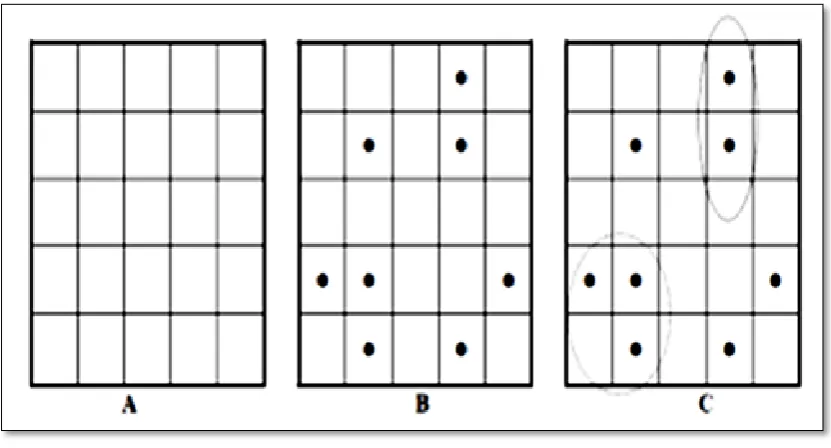
Pike and Seager denoted the percolation theory was a measure of connectivity between regularly or randomly positioned sites within a space (Pike, 1974) (Eliodoro, 2010). To embellish on the definition of Pike and Seager, Stauffer explained percolation theory with the assistance of a square lattice as shown below in Figure 2.1A (Stauffer, 1985).
Figure 2.1: Square lattice diagram with clusters circled (Mamunya et al., 2002)
9
[image:25.595.109.533.172.485.2]The percolation theory provides an explanation of the composite’s electrical conductivity near the critical volume or percolation threshold value. In Figure 2.2, Clingerman graphically described the dependence of conductivity on the filler volume fraction (Clingerman, 2003).
Figure 2.2: Dependency of electrical conductivity on filler volume fraction (Clingerman, 2003)
Filler properties play a significant role in determining the electrical conductivity of the composite (Rodney, 1988) (Mamunya et al., 2002). Studying these variables affecting the electrical conductivity will result in the mechanical stability of the composite and may influence the choice of conductive filler utilized. In the forefront.
2.5.1 Filler Conductivity
The conductivity of the filler is the major factor in the electrical conductivity of the composite (Bell and Goh, 2008) (Marino, 2005) (Mamunya et al., 2002).
2.5.2 Particle Size and Morphology
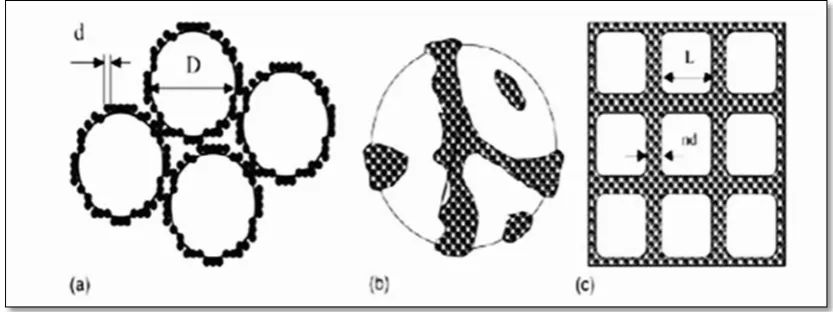
[image:26.595.115.532.509.665.2]Other filler properties can have a significant impact on the electrical conductivity, such as particle size and morphology for partical size( Mamunya et al., 2002) reported that For systems having size of polymer and metal particles D and d
11
for conductivity arising in the system ; (c) Schematic representation of the shell structure model.(Mamunya et el., 2002)
It is important to mention that for the appearance of conductivity it is not required that each polymer particle is completely covered with a monolayer of metallic particles in contact with each other. As is shown in Fig. 2-3b taken from (Mamunya et al., 2002) certain effective filler portion on the polymer particle surface provides conductive cluster. Further increase of filler content results in the increase of the number of layers n of metallic particles on the kernel surface and in the decrease of the size L of the unfilled region, L ¼ D. The schematic picture of the composite structure having shell thickness equal as is shown in Fig. 2-3c (Mamunya
et al., 2002).
2.5.3 Polymer Wets
The factors mentioned in the previous paragraphs are excellent at forecasting the electrical conductivity of the composite system (Rodwick and Julia, 2008) but there are some subtle factors which when coupled can lead to erroneous electrical conductivity predictions. One factor is how well the polymer wets the surface of the filler (Rodwick and Julia, 2008) (RIOS, 2007). This adhesion of the filler of the polymer can be quantified by the difference between the two surface energies of the materials. Poor wetting of the filler by the polymer will result in segregated filler distributions within the composite (Ruschau, 1992). Mamunya (Mamunya et al.,
Another factor is the orientation of the fillers within the composite (Rodney and Nichols, 1988). The orientation factor is usually a condition of the fabrication process of the composite and the filler angle measurement gives some indication of the filler’s orientation in the composites and its measured from the direction of conduction (Rodwick and Julia, 2008) (Beth et al., 2009).
2.5.5 Packing Factor
One of the most important characteristics of the filler polymer composite is the filler packing factor F (Mamunya et al., 2002).Packing factor is a dimensionless ratio that describes the amount of volume that a substance takes up in a particular volume. The value of F depends on the particle shape and on the possibility of the skeleton or chained structure formation (Marino, 2005). The parameter is a limit of system filling and equal to the highest possible filler volume fraction at a given type of packing:
………. 2.1
Where is the volume occupied by the filler particles at the highest possible filler fraction and the volume occupied by the polymer (space between filler particles). For statistically packed monodispersed spherical particles of any size, F is equal to 0.64 (Mamunya and Mater, 1998) (Mamunya et al., 2002).
2.5.6 Density and Porosity
13
The determination of filler volume contents and composite densities, void volumes of each composite prepared were then determined (Yeetsorn 2010).
One of the correlate factors to the density is the porosity.Porosity is a voids and air bubbles in composite (Mehmet 2006). It represents one of the affecting Parameters on the performance of polymer composites containing functional fillers which related to processing, structure, property relationships ( Marino 2005) and also solidification shrinkage(Aran 2007).
The functional material should have improved properties such as low porosity, low water adsorption, higher flexural strength and higher electrical conductivity( Marino 2005) Increased electrical conductivity, along with reduced porosity, have been attributed to a homogeneous distribution of conductive particulates, creating a conductive network throughout the composite (Chan 2011). These problems are usually overcome by hot pressing i.e. by sintering under pressure between punches in a die. The pressure provides the major part of driving force to eliminate porosity(Beura 2012).
2.5.7 Viscosity and MFI
Viscosity is the parameter that relates deformation rate to stresses in the fluid and hence the pressure in any flow, layers move at different velocities and the fluid's viscosity arises from the shear stress between the layers that ultimately oppose any applied force.
Thermoplastic polymers are viscoelastic materials and as such exhibit a pronounced time or frequency dependence. For convenience, thermoplastic melts are characterized with a representative material relaxation time. In a similar way, individual steps in a manufacturing or transformation process can be described by a characteristic process time.
matrix at the interface. During molding process, molten material is forced into the mold, where excessive shear occurs.
A complicating factor is that shear stress τ, is the product of viscosity and shear rate (Cansever 2007)
τ = µγ ………. 2.2
Where µ is viscosity, and γ is shear rate, to specify the viscosity, the Melt flow index can be used as a method for finding viscosity, that’s because MFI is inversely related to viscosity (Hamilton 2010).
2.6 Material Selection:
15
knowledge represents the connections between items of data, the source of this knowledge, which contributes to an understanding of the results.
2.6.1 ABS (Acrylonitrile-Butadiene-Styrene)
Because of a unique balance of properties, modern ABS (-(CH2-CH=CHCH2) n-[(CH2-CHh-CNi) n-(CH2-CH) (Yoshitake et al., 2010) co- polymers have been used in an ever increasing scale for the manufacture of many industrial and domestic products.
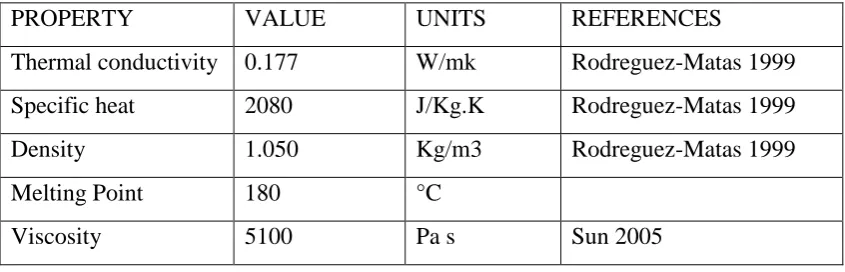
[image:31.595.108.531.473.609.2]ABS is a thermoplastic that has an acrylonitrile-styrene matrix with butadiene rubber uniformly distributed in it. This quality makes it unique (John, 1990) and the physical properties of ABS show in Table 2.1 below.
Table 2.1: Physical Properties of ABS
PROPERTY VALUE UNITS REFERENCES
Thermal conductivity 0.177 W/mk Rodreguez-Matas 1999
Specific heat 2080 J/Kg.K Rodreguez-Matas 1999
Density 1.050 Kg/m3 Rodreguez-Matas 1999
Melting Point 180 °C
Viscosity 5100 Pa s Sun 2005
The material is very tough and resilient, has high impact strength, good chemical resistance and is non-toxic and taint free, also it’s capable of being recycled or reused. These advantageous properties have attracted engineers in many industries. Additional factors make ABS materials are an excellent choice, such as (John, 1990):
3-Ease of moulding
4-Good metal adhesion to the substrate
5-Good appearance after plate
Since ABS copolymer has been developed to have a higher performance value which is often called a polymer alloy (Yoshitake et al., 2010) the high specifications percolate it for models, prototypes, patterns, tools and end-use parts (Fred, 2011).
2.6.2 Copper Powder
Copper and its alloys are so adaptable that they can be used in a multitude of applications in almost every industry. Malleability, machinability and conductivity have made it a long-time favourite metal of manufacturers and engineers (Madison, 2010).
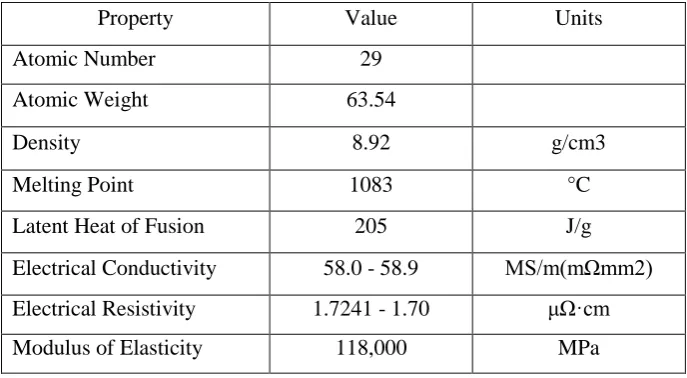
[image:32.595.147.491.577.766.2]High conductivity coupled with intrinsic strength, formability and corrosion resistance make copper alloys unique as conductors of electricity as show in Table 2.2, making them ideal for connectors and other electrical/ electronic products (Madison, 2010) (Yoshitake et al., 2010).
Table 2.2: Physical Properties of Copper powder (Madison, 2010)
Property Value Units
Atomic Number 29
Atomic Weight 63.54
Density 8.92 g/cm3
Melting Point 1083 °C
Latent Heat of Fusion 205 J/g
Electrical Conductivity 58.0 - 58.9 MS/m(mΩmm2)
Electrical Resistivity 1.7241 - 1.70 μΩ·cm
17
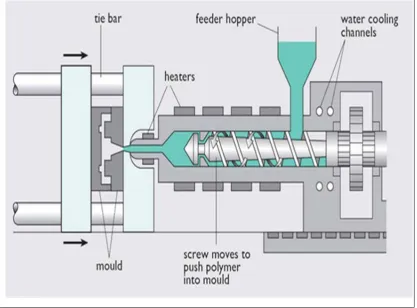
2.7 Injection Moulding
[image:33.595.108.526.341.649.2]Injection moulding machine shown in Figure 2.4 is singularly the most popular of all the plastics processes. Unlike extrusion or blow moulding, it allows producing a plastic part with three-dimensional characteristics. This permits very intricate designs and high production rates (Muccio, 1994). The injection moulding machine consists of an injection unit and a clamp unit. The injection unit is the part where the plastic pellets are melted and the plastic melt is forced into the mould. The injection unit is very similar to an extruder in design and construction, particularly in that it has an alloy barrel and a flighted screw (Marino, 2005).
2.8.1 Barrel Temperature
Barrel temperature influences the orientation, degradation and viscosity of the melt (CAHIT and Yılmazer, 2007).
Depending on the size and design of the injection unit, there may be three to five distinct zones to control. If there are five zones, the middle zone may have a temperature setting 100C higher than that of the feed zone and the temperature of the front zone will be set approximately equal to the desired melt temperature of the plastic being processed. The nozzle’s temperature is higher because of keeping the plastic melted (Muccio, 1994).
2.8.2 Injection Pressure
Injection pressure influences the surface quality, orientation and mechanical stressing of the melt (CAHIT and Yılmazer, 2007) and also increases the percolation (Mamunya et al., 2002).
It is also called pack pressure, high pressure, boost pressure and first stage pressure. Basically stated, it is the pressure generated by the screw tip on the plastic melt (the pressure used to pack the mould cavity once it has been filled. There is a hydraulic pressure continuum from the screw through the plastic into the mould. Until this pressure is generated, the only pressure on the plastic melt is associated with its resistance as it fills the mould (Muccio , 1994).
2.8.3 Mould Temperature
Accurate temperature control of the mould cavity walls is important and has a direction influence on the production of quality moulded part (CAHIT and Yılmazer, 2007).
19
control the mould temperature. Higher mould temperatures delay freezing to facilitate filling long, thin sections. They also encourage greater crystallization of the semi crystalline resins, which affects both mechanical properties and shrinkage or dimensions.
2.9 Hot-press Compression Molding
Compression molding is a method of molding in which the molding material, generally preheated, is first placed in an open, heated mold cavity. The mold is closed with a top force or plug member, pressure is applied to force the material into contact with all mold areas, while heat and pressure are maintained until the molding material has cured as shown in Figure 2.5.
The process employs thermosetting resins in a partially cured stage. it’s The oldest and simplest method of processing thermoset molding materials(Plenco 2008).
Hot-press temperature, time, pressure, density level, is effective parameters on the mechanical properties of matrix (Gu 2010) and also the electrical conductivity.
2.10.1 Hot-Press Pressure
The press closing and the initial energy transfer from the hot platens to the mat characterization, as seen in Figure 2-6 it shows the temperature rise which can be detected in the core, which indicates the energy has been transferred from the platens (Bolton et al. 1989a and Torrey 2001)( Hood 2004)
21
2.10.2 Hot-Press Temperature
Thermal energy is transfer from one body to another of different temperature by way of direct contact. This can occur between solids, fluids at rest or both, from the high thermal energy body to the low thermal energy body from the platens of the hot-press to the surface particles of the mat (Bolton 1989).that plays a more important role in heat transfer as the mat is consolidated further and the void fraction in the mat decreases with increasing density
2.10.3 Hot-Press Time
Conductive heat transfer plays an important role in hot-pressing initially because of the direct contact between the hot plates and the oriented strandboard mats that’s give the time sensitive nature of hot-pressing a total reliance on conduction would not be practical due to the slow rate of heat transfer (Hood 2004).
This time requirement to increase the mat temperature is the main restraining factor in the production rate.
2.11 Summery of Literature Review
23
CHAPTER 3
METHODOLOGY
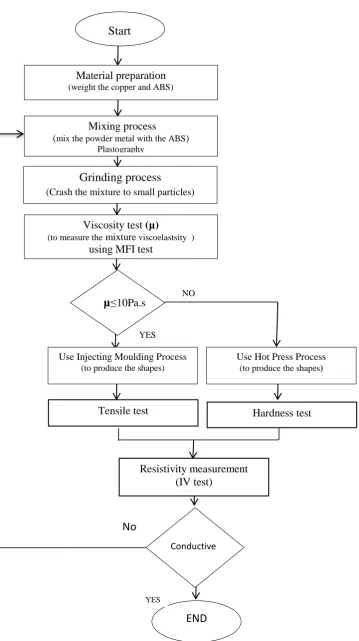
3.1 Fabrication Methods
One of the aims of the project is to investigate the feasibility of producing functional parts by mixing metallic particles into the polymer matrix material. The materials used are ABS and copper powder.
Hardness test Tensile test
YES Start
Material preparation (weight the copper and ABS)
Mixing process
(mix the powder metal with the ABS)
Plastography
Viscosity test (µ)
(to measure the mixture viscoelastsity ) using MFI test
NO
Use Injecting Moulding Process
(to produce the shapes)
µ≤10Pa.s
Grinding process
(Crash the mixture to small particles)
Use Hot Press Process
(to produce the shapes)
No
END
Conductive
YES
[image:40.595.116.476.89.731.2]Resistivity measurement (IV test)
80
REFERENCES
Bell J.M., Goh R.G.S., Waclawik E.R., Giulianini M. and Motta N. (2008). Polymer-Carbon
Nanotube Composites: Basic Science And Applications. Materials Forum Volume 32,
Institute Of Materials Engineering Australasia Ltd.
Beth A. Johnson (2009). Thermally and Electrically Conductive Polypropylene Based Resins
For Fuel Cell Bipolar Plates. Michigan Technological University. USA. Master’s
Thesis.
Bhattacharya S.K. (1986). Metal-Filled Polymers (Properties And Applications). New York, Marcel Dekker.
Cahit Can Cansever (2007). Effects of Injection Molding Conditions On The Mechanical
Properties Of Polyamide / Glass Fiber Composites. Middle East Technical University,
Turkey. Master’s Thesis.
Carlos Velasco Santos (2003). Improvement of Thermal And Mechanical Properties Of Carbon
Nanotube Composites Through Chemical Functionalization. American Chemical
Society.
Clingerman M.L. (2001). Development and Modeling Of Electrically Conductive Composite
Materials. Michigan Technological University, USA. Ph.D. Thesis.
Eliodoro Chiavazzo and Pietro Asinari (2010). Reconstruction And Modeling Of 3D Percolation
Networks Of Carbon Fillers In A Polymer Matrix By The Lattice Boltzmann Method.
Politecnico di Torino, Italy. Master’s Thesis.
Gabriel Pinto and Abdel-KarimMaaroufi (2011). Critical Filler Concentration For
Electroconductive Polymer Composites. Society of Plastics Engineers (SPE).
No. 1, pp. 165 to 170.
Jonathan Patrick Hood (2004). Changes in Oriented Strand board Permeability during
Hot-Pressing.Faculty of Virginia Polytechnic Institute and State University.
Kai Gu (2010). Evaluation of New Formaldehyde-Free, Soy Flour-Based Wood Adhesives For Making Particleboard.Oregon State University. Master’s Thesis.
Khairu.K., Raman.I, Mohamed, Ibrahim, Wahab (2013). Parameter Optimerizationfor Photo
Polymerization Of Microstereolithography. Advanced Materials Research Vol. 626.
Kumlutas D.and Tavman I.H. (2006). Numerical and Experimental Study on Thermal
Conductivity of Particle Filled Polymer Composites. Journal of Thermoplastic Composite
Materials.
Liang Guodong (2007). Electrical Properties Of Polymer Composites Filled With Conductive
Fillers. City University Of Hong Kong. Hong Kong. Ph.D. Thesis.
Madison Avenue (2011). The Copper Advantage, Guide To Working With Copper And Copper
Alloys. Copper Development Associated, New York.
Mamunya Ye., Boudenne A., Lebovka N., Ibos L., Candau Y., Lisunova M. (1998). Electrical
And Thermophysical Behaviour Of PVC-MWCNT Nanocomposites. Elesever.
Mamunya Ye.P., Davydenko V.V., Pissis P., Lebedev E.V. (2002). Electrical And
Thermal Conductivity Of Polymers Filled With Metal Powders. Institute of
Macromolecular Chemistry, European Polymer Journal.
Marino Xanthos(2005). Functional Fillers For Plastics. WILEY-VCH Verlag GmbH & Co KGaA, Germany, pp. 1-12.
Mehmet Doğan (2006).Effect Of Polymer Additives On The Physical Properties Of Bitumen
82
Muccio E.A. (1994). Plastic Processing Technology. ASM International Publishers, U.S.A. Park S.H. and Bandaru P.R. (2010). Improved Mechanical Properties Of Carbon
Nanotube/Polymer Composites.Elsevier.
Planes E. Flandin L. Alberola N. (2012). Polymer Composites Bipolar Plates For Pemfcs. Energy Procedia, Elsevier.
Refat N.A., Ibrahim Z.S., Oustafa G.G., Sakamoto K.Q., Ishizuka M., Fujita S. (2008). The
Induction Of Cytochrome P450 1A1 By Sudan Dyes. J. Biochem. Mol. Toxicol. 22 (2):
pp. 77–84.
Rodwick L. Barton Carter (2008). Development And Modeling Of Electrically Conductive Resins
For Fuel Cell Bipolar Plate Applications. Michigan Technological University, USA.
Ph.D. Thesis.
Rodwick L. Barton Carter (2008). Development And Modeling Of Electrically Conductive Resins For Fuel Cell Bipolar Plate Applications. Michigan Technological University.USA. Ph.D. Thesis.
Rosalin Beura (2012). Synthesis And Characterization Of Polymer- Ferroelectric Composite.
National Institute Of Technology, Rourkela. Master’s Thesis.
Rungsima Yeetsorn (2010). Development Of Electrically Conductive Thermoplastic Composites For Bipolar Plate Application In Polymer Electrolyte Membrane Fuel Cell. University of Waterloo. Canada. Ph.D. Thesis.
Ruschau G. R. and Newnham (1992). Critical Volume Fractions In Conductive Composites.
Journal of Composite Materials, Vol 26, No 18, pp 2727–2735.
Ruschau G.R., Newnham (1992).Critical Volume Fractions In Conductive Composites. Journal of Composite Materials, Vol. 26, No. 18, pp. 2727–2735.
Sabu Thomas, KuruvillaJoseph, Sant Kumar Malhotra, Koichi Goda (2012). Advances in
Stauffer D. (1985). Introduction to Percolation Theory. Philadelphia, Taylor and Francis Inc., pp. 1-11.
Stephen H. Foulger (1998). Electrical Properties of Composites in the Vicinity of the Percolation
Threshold. Journal of Applied Polymer Science, Vol. 72, PP. 1573–1582.
Yoshitake Nishi, Nobuaki Kunikyo, Masae Kanda, Laurent Lebrun and Daniel Guyomar (2010).Impact Value of High Electric Conductive ABS Composites with Copper Powder
Dispersion Prepared by Solution-Cast Method. Materials Transactions, Vol. 51, No. 1,