www.arpnjournals.com
OPTIMAL DESIGN OF A SINGLE TUNED PASSIVE FILTER TO
MITIGATE HARMONICS IN POWER FREQUENCY
D. M. Soomro And M. M. Almelian
Department of Electrical Power Engineering, Faculty of Electrical and Electronic Engineering, Universiti Tun Hussein Onn Malaysia(UTHM)
86400 Parit Raja, Batu Pahat, Malaysia
E-Mail: [email protected], [email protected]
ABSTRACT
Electricity has been one of the most important necessities for industrialization, increasing living standard of people around the world. Power electronic devices are applied in industry as well as in domestic appliances. The excessive use of these devices cause power quality (PQ) problems in the power system (PS), due to generation of harmonics. The consequences of harmonics include; increased probability in occurrence of resonance, neutral overload in 3-phase systems, overheating of all cables and equipment, loss of efficiency in electric machines, electromagnetic interference with communication systems, errors in measurements when using average reading meters, nuisance tripping of thermal protections. Many researches are being done to find out the best solution against the cause. For this, various tools and techniques are being improved and applied to mitigate such cause and enhance the PQ of the PS. One of the methods to mitigate harmonics is by designing and using passive filter. Moreover, it reduces the need of capacitor for supplying extra needed kVAr. Due to these two attracting features of Passive filter, its design and application can be found in many reasearches. The the main aspect of filter design has been challenging issue. This paper presents the optimal design of single tuned passive filter that its application is to mitigate harmonics in power frequency. The optimal parameters of this filter were calculated by using Lagrange interpolation method. The results were obtained by Matlab/simulation which shows the effectiveness of this filter.
Key words: Power Quality Passive Filter Total Harmonic Distortion Matlab/Simulink
INTRODUCTION
Harmonic signal can be described as a signal whose frequency is the integer multiple of the fundamental/reference frequency. Mathematically, it is described as the ratio of the frequency of such a signal to the frequency of the reference signal (Grady, W. M, 2001).
Power distribution system is designed to operate with sinusoidal voltage and current waveform at constant frequency. However, when non linear load like thyristor drives, converters and arc furnace are connected to the system, excessive harmonic currents are generated and this causes both current and voltage distortions. These harmonics pollute the PS and produce many adverse effects like malfunction of sensitive equipment, reduced power factor, overloading of capacitor, flickering lights, overheating of equipments, reduced system capacity, etc.
Few of the other reported harmonic effects include; excessive current in neutral wire, overheating of the motor, microprocessor problem and unexplained computer crash. Its more effect can be found at distribution grid stations as well as industrial sectors where it causes higher transformer losses, line losses, reactive power and resonance problems, untoward protection system activations, harmonic interactions between customers or between the utility and the load.
Basically, the common source of harmonic signal is nonlinear load. It is due to the fact that current does not vary smoothly with voltage. Nonlinear load such as fluorescent lamp, electric welding machine and three-phase rectifier generates primarily 5th and 7th current harmonic and some of higher order harmonics.
The harmonic signal cannot be totally mitigated, but it can be reduced by several ways, such as by using active filters, passive filters and hybrid filters. The common practice for harmonic mitigation is the installation of passive harmonic filters due to many advantages. Passive filters are the simplest, no power supply required and exhibit the best relationship cost-benefit among all other mitigation techniques when dealing with low and medium voltage rectifier system (Fujita et al, 2000).
SINGLE TUNED PASSIVE FILTER DESIGN
The concept of passive filter is followed by the use of passive components such as capacitors, inductors and resistors which conceal the harmonic components from the nonlinear loads (Dugan et al, 1996).
Basic configuration of passive filter
The basic structure of passive filter is as shown in Figure 1 (Srivastava, K et al, 2013). It consists of the voltage source, non-linear load and passive filter. The three phase voltage source supplies sinusoidal waveform to the non-linear load. This load affects the sinusoidal waveform causing waveform, distorted. The distorted waveform or harmonic contented current is to be compensated by a passive filter in the system. Passive filter is shunt connected.
Optimal passive filter design
cost of the filters and reduce the total harmonic distortion of currents and voltages. This requires to calculate the lowest values of capacitor, inductor, and resistor to obtain the standard total harmonic distortion (THD) of current (Dastfan et al., 2014).
Figure 1: Basic configuration of passive filter.
There are several types of passive filters. The most common filter types are as shown in Figure 2 (Das, J. C, 2011) .
Figure 2: Different type of passive filters.
Single tuned passive filter design
The single tuned filter is the most common type of filter which is used in industry for mitigating the harmonic. This filter is inexpensive and simplest compared with other filters for mitigating the harmonic problems (Cho, Y. S et al., 2011), (Buła, D et al, 2010).
This filter is connected in shunt with the distribution system and it will offer low impedance to current through which harmonic current will tend to divert in the system. A very simple arrangement of the single tuned passive filter is shown in the Figure 3 (Singh, B et al, 1999). For designing the single tuned passive filter, it is important to calculate an appropriate resistor, capacitor and inductor values that enable to mitigate harmonics in power frequency. The equation of resonant frequency for single tuned frequency is given by following equation.
1
2√ 1
fr = Frequency resonant in Hertz
[image:2.612.72.292.136.268.2]L = Inductance of Filter in Henry C = Capacitance of Filter in Farad
Figure 3: Simple arrangement of single tuned passive filter.
Following are the steps, to designing the single tuned passive series filter:
Step 1: Determine The three-phase capacitive reactive power (Qc) in VArs. Specify it with a positive value. For
this, a range of Qc i.e. 500 to 9500 at the step of 1000 was
used. To get THD ≤ 5%, an optimal value of (Qc) was
obtained by using Langrange interpolation method. This method is discussed later on.
Step 2: Evaluate the capacitive reactance (Xc), at the
fundamental frequency (f).
2 1
2 3
V = The (rms) nominal line to line voltage (in kV)
Step 3: Calculate the inductive reactance (XL) and
inductance (L) at the fundamental frequency.
4
2 5
hn = The harmonic order
Step 4: Calculate the resistance (R) for a specified quality factor (Q). The range value of Q lies between 30 and 50.
6
X 7
Xn = The characteristic reactance
Lagrange interpolation method
Mostly data is given in discrete points such as (x0,,y0), (x1,,y1), …., (xn,,yn). Therefore to represent (n+1)
[image:2.612.74.294.341.451.2]Through interpolation one can find the value of (y) at any other value of (x).
If f(x) falls outside the range of (x)for which the data is given, it is no longer interpolation but instead it is called extrapolation.
A polynomial is a common choice for an interpolating function because polynomials are easy to evaluate, differentiate and integrate, relative to other choices such as a trigonometric and exponential series.
Figure 4: Interpolation of discrete data.
Polynomial interpolation involves finding a polynomial of the order (n) that passes through the (n+1) data points. One of the methods used to find this polynomial is called the Lagrangian method of interpolation. Other methods include Newton’s divided difference polynomial method and the Direct method. The Lagrangian interpolating polynomial is given by:
!!
!"#
8
Where (n) in f (x) stands for the (nth) order polynomial that approximates the function y = f (x) given at (n+1) data points as (x0,,y0), (x1,,y1),…., (xn,,yn), and
! % & '
!& '
'"# '(!
9
Where Li (x) is a weighting function that includes
a product of (n-1) terms with terms of j=i omitted.
Pparameters of single tuned passive filter design
[image:3.612.68.556.74.348.2]The values of C, L and R were calculated based on the equations from equation (2) to equation (9). The Table 1 that shows the circuit parameters of Figure 5.
Table 1:Circuit parameters (Das, J. C, 2011)
Components Parameter Values
Source Voltage VLL= 220 Vrms
Source Frequency f = 50 Hz
Line inductance Labc= 1.7 mH
Rectifier load inductance LL= 1 mH
Rectifier load resistance R = 100 Ω
[image:3.612.87.280.501.636.2]Table 2 shows the optimal values of the single tuned filter where the optimal parameters of the single tuned passive filter are computed at Q=50 and 5% THD based on IEEE Standard 519 (F II, 1993). The filter is tuned to the 5th harmonic because it is found the highest value of the fundamental harmonic component as shown in Table 3.
Table 2:values of desgined filter
C (F) L (H) R (Ω)
0.3995e-3 1.0145e-3 0.0319
RESULTS ANALYSIS AND DISCUSSION
The performance of the single tuned filter parameters has been verified by using Matlab/Simulink software.
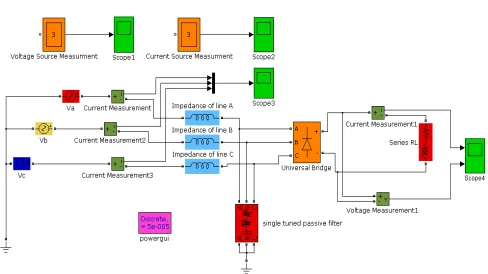
In this paper, non-linear load (three-phase AC-DC converter) has been simulated with and without single tuned filter. The simulated circuit is shown in Figure 5.
Figure 6 and Figure 7 show the supply voltage and current waveform respectively, without a single tuned passive filter. From Figure 7, it is clear that the current waveform contains some non-linear relationship. Therefore to obtain its frequency spectrum and know the THD, fast fourrier transform analysis was used as shown in Figure 8. It shows the THD of the order of 28.28%.
Table 3 presents the harmonic value in % with respect to the fundamental component, while developed single tuned filter is not connected.
Figure 6: Supply voltage without single tuned passive filter
Figure 7: Supply current without single tuned passive filter
[image:4.612.76.295.173.208.2]Figure 8: Frequency spectrum of Supply current without single tuned passive filter
Table 3:Harmonicvalues in the supply current with respect to the fundamental component (without single tuned
passive filter)
Fundamental (50Hz) = 3.28 % THD = 28.28%
Harmonic order
% of fundamental
harmonic
Harmonic order
% of fundamental
harmonic
1 100 11 8.64
2 0.03 12 0.03
3 0.05 13 5.69
4 0.03 14 0.03
5 22.59 15 0.05
6 0.03 16 0.02
7 10.83 17 4.94
8 0.03 18 0.02
9 0.05 19 3.52
10 0.03 20 0.00
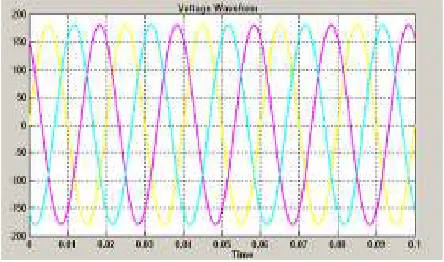
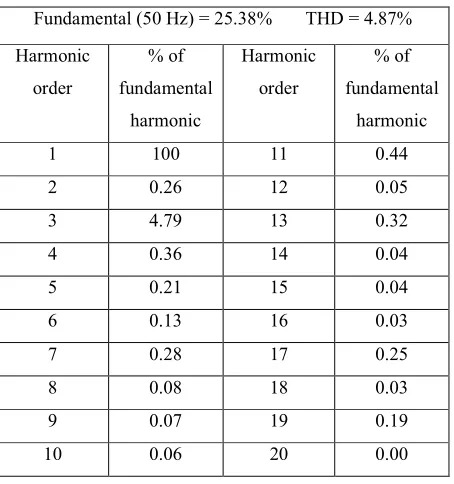
Figure 9 shows the supply current waveform when single tuned passive filter is connected. The 5th harmonic is eliminated of the source current, as can be seen in its frequency spectrum, which is shown in Figure 10 and in Table 4 (harmonic value in % with respect to the fundamental component). We can see how the harmonic values decrease, improving the THD from 28.28% to 4.87% by using one type of passive filter namely single tuned filter.
[image:4.612.317.544.294.534.2] [image:4.612.76.298.428.559.2] [image:4.612.75.299.592.722.2]Figure 9: Supply current when single tuned passive filter is connected
Figure 10: Frequency spectrum of Supply current with single tuned passive filter
Table 4: Harmonicvalues of the supply current when single tuned passive filter is connected
Fundamental (50 Hz) = 25.38% THD = 4.87%
Harmonic order
% of fundamental
harmonic
Harmonic order
% of fundamental
harmonic
1 100 11 0.44
2 0.26 12 0.05
3 4.79 13 0.32
4 0.36 14 0.04
5 0.21 15 0.04
6 0.13 16 0.03
7 0.28 17 0.25
8 0.08 18 0.03
9 0.07 19 0.19
10 0.06 20 0.00
CONCLUSION
This paper presented the design of single tuned passive filter to mitigate harmonic distortion caused by non
linear loads in a power system by using
MATLAB/Simulink. From the simulation results, it can be concluded that the efficiency results of the designed filter was successfully achieved by mitigating the harmonics at the value of filter Q as 50. Generally, the THD of line current has been successfully decreased from 28.28% to 4.87% for the used non-linear load system, which fulfills the recommended harmonic standard (IEEE 519) i.e. THD less than 5%. Otherwise, the source current amplitude increased from 3.28 A to 25.38 A due to the impedance of the single tuned filter. Comparing the harmonics before and after the developed filter installation cases, the 5th harmonic was decreased from 22.59% to 0.21%, the 7th harmonic was
decreased from 10.83% to 0.28% and 11th harmonic decreased from 8.64% to 0.44%. As a conclusion, the performance of single passive filter is depending on the parameter values such asC, L, and R to mitigate the harmonics.
REFERENCES
Anooja, C. L., & Leena, N (2013). Passive Filter For Harmonic Mitigation Of Power Diode Rectifier And SCR Rectifier Fed Loads. International Journal of Scientific &
Engineering Research, Volume 4, Issue 6.
Buła, D., & Pasko, M. (2010). Hybrid power filter with single tuned passive filter-dynamical properties.
In Nonsinusoidal Currents and Compensation (ISNCC),
2010 International School on (pp. 80-83). IEEE.
Cho, Y. S., & Cha, H. (2011). A single-tuned passive harmonic filter design using transfer function approach for industrial process application. International Journal of
Mechatronics and Automation, 1(2), 90-96.
Das, J. C. (2011). Power system analysis: short-circuit load
flow and harmonics. CRC press.
Dastfan, A., Yassami, H., & Rafiei, M. R. (2014). Optimum Design of Passive Harmonic Filter by Using Game Theory
Concepts. Intelligent Systems in Electrical
Engineering, 4(4).
Dugan, R. C., McGranaghan, M. F., & Beaty, H. W. (1996). Electrical power systems quality. New York, NY: McGraw-Hill, c1996, 1.
F II, I. (1993). IEEE recommended practices and requirements for harmonic control in electrical power systems.
Fujita, H., Yamasaki, T., & Akagi, H. (2000). A hybrid active filter for damping of harmonic resonance in industrial power systems. Power Electronics, IEEE Transactions on, 15(2), 215-222.
Grady, W. M., & Santoso, S. (2001). Understanding power
[image:5.612.70.297.479.721.2]Memon, Z. A., Uquaili, M. A., & Unar, M. A. (2012). Harmonics mitigation of industrial power system using passive filters. Mehran University Research Journal of
Engineering and Technology, 31(2), 355-360.
Singh, B., Al-Haddad, K., & Chandra, A. (1999). A review of active filters for power quality improvement. Industrial
Electronics, IEEE Transactions on, 46(5), 960-971.
Srivastava, K. K., Shakil, S., & Pandey, A. V. (2013). Harmonics & Its Mitigation Technique by Passive Shunt Filter. International Journal of Soft Computing and
Engineering (IJSCE) ISSN, 2231-2307.