BIROn - Birkbeck Institutional Research Online
Kingrani, Suneel Kumar and Levene, Mark and Zhang, Dell (2018) A
meta-evaluation of meta-evaluation methods for diversified search. In: Pasi, G. and
Piwowarski, B. and Azzopardi, L. and Hanbury, A. (eds.)
Advances in
Information Retrieval.
ECIR 2018.
Lecture Notes in Computer Science
10772. Springer, pp. 550-555. ISBN 9783319769400. (In Press)
Downloaded from:
Usage Guidelines:
A Meta-Evaluation of Evaluation Methods for
Diversified Search
Anonymous Authors
Abstract. For the evaluation of diversified search results, a number of different methods have been proposed in the literature. Prior to making use of such evaluation methods, it is important to have a good under-standing of how diversity and relevance contribute to the performance metric of each method. In this paper, we use the statistical technique ANOVA to analyse and compare three representative evaluation meth-ods for diversified search, namelyα-nDCG, MAP-IA, and ERR-IA, on the TREC-2009 Web track dataset. It is shown that the performance scores provided by those evaluation methods can indeed reflect two cru-cial aspects of diversity — richness and evenness — as well as relevance, though to different degrees.
1
Introduction
The same query could be submitted to a search engine by users from different backgrounds and with different information needs. When this occurs, the search engine should present users with relevant and diversified results that can cover multiple aspects or subtopics of the query. For more than a decade, there has been a surge of research in the diversification of search results [3, 13, 17, 19]. The main objective of such research is to deal with the ambiguity of query or the multiplicity of user intent.
To evaluate the performance of diversified search, a variety of metrics have been proposed in recent years, such as α-nDCG [9], MAP-IA [1], and ERR-IA [5] which generalise the corresponding traditional IR metrics [15] to capture both the diversity and therelevance of search results. In this paper, we aim to investigate exactly how the above mentioned three representative performance metrics for diversified search are determined by diversity and relevance, using the Analysis of Variance (ANOVA) [10].
2
Related Work
The widely used IR performance metric nDCG [12] measures the accumulated usefulness (“gain”) of the ranked result list with the gain of each relevant docu-ment discounted at lower positions. Clarke et al. proposed its extended version
the discounted cumulative gain α-DCG[k] normalised by its “ideal” value, and DCG[k] can be calculated as:
α-DCG[k] = k
X
i=1
PN
s=1gi,s(1−α)
Pi−1
j=1gj,s
log2(i+ 1) , (1)
whereN is the total number of distinct subtopics, andgi,s is the human judge-ment for whether subtopicsis present or not in documenti.
Agrawal et al. [1] proposed an approach to generalising traditional IR per-formance metrics for the search results of a query with multiple subtopics (user intents). The idea is to calculate the given performance metric for each subtopic separately, and then aggregate those scores based on the probability distribu-tion of subtopics for the query. Extending the tradidistribu-tional IR performance metrics MAP [15] and ERR [6] in this way, we get their diversified versions:
MAP-IA = N
X
s=1
P(s)·MAPs and ERR-IA = N
X
s=1
P(s)·ERRs, (2)
where N is the total number of distinct subtopics, P(s) is the probability or weight of subtopics, while MAPs and ERRs are the MAP and ERR scores for subtopicsrespectively.
The previous studies most similar to our work are those from Clarke et al. [8] and Chandar et al. [4] which attempt to compare evaluation methods in the context of diversified search. The former assumes simple cascade models of user behaviour, while the latter measures diversity just by the subtopic recall —
s-Recall [18] — which may not reveal the full picture of diversity.
3
Meta-Evaluation
3.1 Factors
To examine the diversity of search results for a query, it is important to consider not only the number of distinct subtopics but also the relative abundance of the subtopics present in the search result set. Drawing an analogy between subtopics and species, we would like to borrow two measures from ecology [2, 14, 16] —
richness andevenness — to describe the above two complementary dimensions of diversity respectively. The measure of richness on its own cannot provide a complete picture of diversity, as it does not account for the varying proportions of different species in a population. For example, intuitively, one wild-flower field with 500 daisies and 500 dandelions should be more diverse than another wild-flower field with 999 daisies and 1 dandelions — although they both have the same richness (two species), evidently the first field has much higher evenness than the second field.
(topic) could be just defined as the amount of distinct subtopics appeared in the set. In order to make the value of richness comparable across queries, we choose to use not the absolute number of distinct subtopics but the relative proportion of distinct subtopics:
richness=R/N , (3)
where R is the number of distinct subtopics covered by the given search result set for a query, whileN is the total number of distinct subtopics relevant to that query. This proportionate version of richness is actually equivalent to thes-Recall
proposed by Zhai et al. [18]. The value of (proportionate) richness is obviously between 0 and 1. The evenness of the search result set for a query (topic) refers to how close in numbers each subtopic in the set is, i.e., it quantifies how evenly the search results are spread over the subtopics. For example, a search result set having 5 results from subtopic uand 5 results from subtopicv should have greater evenness than a search result set having 2 results from subtopicuand 8 results from subtopic v. Mathematically, the value of evenness is calculated as the normalised diversity:
evenness=D/Dmax , (4)
where D is a diversity index, and Dmax is the maximum possible value of D. Here, we use the well-knowninverse Simpson’s diversity index [11]:
D= R
X
s=1
p2s !−1
. (5)
where R is the number of distinct subtopics covered by the search result set, andpsis the proportion of subtopic swithin the search result set. In this case, it can be proved thatDmax is equal toR, which happens when all the subtopics appear in the search result set with equal frequencies 1
R. The value of evenness is greater than 0, and less than or equal to 1.
For the purpose of assessing therelevance of search results, we can simply use the Precision@kmeasure [15], as in [4].
3.2 Data
The dataset used for our experiments comes from TREC-2009 Web track diver-sity task [7] which have also been used in previous studies [4, 8]. This dataset includes 50 topics, each of which consists of a set of subtopics representing dif-ferent user needs.
3.3 Experiments
statistical technique, Analysis of Variance (ANOVA) [10], provides the perfect tool to gain insight into how each of these three factors (richness, evenness, and relevance) contributes to the overall performance measured by an evaluation method.
In our experiments, the dependent variable for the ANOVA would be the performance score given by α-nDCG1, MAP-IA, or ERR-IA. Regarding the in-dependent variables (richness, evenness, and relevance), since the real IR system outputs submitted to the TREC-2009 Web track could not account for all the possible scenarios that we would like to investigate, we generated a number of synthetic search result sets via a simulation process similar to the “Rel+Div” setting in [4]. Given a query (topic) in our dataset, we randomly sampled 10 documents form the fullqrels file [7] to create such artificial document rankings that satisfy one of the 33= 27 different experimental conditions for top-10 search results: low/medium/highrichness, low/medium/highevenness, and low/medi-um/highrelevance, where the category labels low, medium, and high correspond to the value ranges 0.0–0.3, 0.3–0.6, and 0.6–1.0 respectively. The simulation process would continue until for each of the 50 queries (topics) we had gener-ated 10 search result sets (rankings) per experimental condition. Therefore, the ANOVA for each evaluation method would have 50×10×27 = 13500 data points to analyse.
3.4 Results
The statistical significance results of the ANOVA are shown in Table 1. It can be seen that all those performance metrics,α-nDCG, MAP-IA, and ERR-IA, would be influenced heavily by the individual factors — richness, evenness, and rele-vance — with almost zerop-values, but not so much by their interactions. This confirms that the chosen three factors are relatively independent (untangled) aspects of a system’s performance for diversified search.
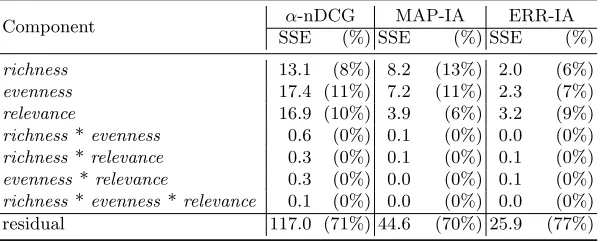
Furthermore, Table 2 shows the variance decomposition results of the ANOVA, where SSE stands for the sum of squared errors. It seems that MAP-IA reflects more richness than the other two performance metrics, as the change of richness accounts for 13% of the total variability in MAP-IA which is substantially higher than 8% inα-nDCG and 6% in ERR-IA. On the other hand, evenness is probably reflected better byα-nDCG or MAP-IA than ERR-IA, as the change of evenness accounts for 11% of the total variability inα-nDCG and MAP-IA but only 7% in ERR-IA. In terms of relevance, α-nDCG looks the most accurate indicator, because 10% of its total variability is attributed to the change of relevance, which is followed by 9% in ERR-IA and 6% in MAP-IA. The “residual” component which comprises everything about the performance metric unexplained by the proposed independent variables (factors) occupies a high proportion of the total variability, which suggests that the difficulty of the query (topic) and also the specific ranking algorithm still play the major roles in determining performance scores.
1
Table 1.The statistical significance results of the ANOVA.
Component α-nDCG MAP-IA ERR-IA
F p-value F p-value F p-value
richness 362.4 0.00 590.9 0.00 253.7 0.00
evenness 480.0 0.00 521.7 0.00 282.7 0.00
relevance 465.7 0.00 285.0 0.00 397.0 0.00
richness *evenness 10.8 0.00 2.9 0.03 0.9 0.46
richness *relevance 3.5 0.01 5.3 0.00 5.8 0.00
evenness *relevance 4.3 0.00 0.3 0.91 3.2 0.01
richness *evenness *relevance 0.8 0.53 1.4 0.24 2.4 0.05
Table 2.The variance decomposition results of the ANOVA.
Component α-nDCG MAP-IA ERR-IA SSE (%) SSE (%) SSE (%)
richness 13.1 (8%) 8.2 (13%) 2.0 (6%)
evenness 17.4 (11%) 7.2 (11%) 2.3 (7%)
relevance 16.9 (10%) 3.9 (6%) 3.2 (9%)
richness *evenness 0.6 (0%) 0.1 (0%) 0.0 (0%)
richness *relevance 0.3 (0%) 0.1 (0%) 0.1 (0%)
evenness *relevance 0.3 (0%) 0.0 (0%) 0.1 (0%)
richness *evenness *relevance 0.1 (0%) 0.0 (0%) 0.0 (0%) residual 117.0 (71%) 44.6 (70%) 25.9 (77%)
4
Conclusion
In this paper, we have shown using the ANOVA that the three representative evaluation methods for diversified search, α-nDCG, MAP-IA and ERR-IA, do reflect two crucial aspects of diversity — richness and evenness — as well as relevance, though to different degrees.
References
1. Agrawal, R., Gollapudi, S., Halverson, A., Ieong, S.: Diversifying search results. In: Proceedings of the 2ndInternational Conference on Web Search and Web Data
Mining (WSDM). pp. 5–14. Barcelona, Spain (2009)
2. Begon, M., Harper, J.L., Townsend, C.R.: Ecology: Individuals, Populations, and Communities. John Wiley & Sons, 3rdedn. (1996)
3. Carbonell, J.G., Goldstein, J.: The use of MMR, diversity-based reranking for re-ordering documents and producing summaries. In: Proceedings of the 21stAnnual International ACM SIGIR Conference on Research and Development in Informa-tion Retrieval (SIGIR). pp. 335–336. Melbourne, Australia (1998)
[image:6.612.157.457.277.398.2]5. Chapelle, O., Ji, S., Liao, C., Velipasaoglu, E., Lai, L., Wu, S.L.: Intent-based diversification of web search results: Metrics and algorithms. Information Retrieval 14(6), 572–592 (2011)
6. Chapelle, O., Metlzer, D., Zhang, Y., Grinspan, P.: Expected reciprocal rank for graded relevance. In: Proceedings of the 18thACM Conference on Information and
Knowledge Management (CIKM). pp. 621–630. Hong Kong, China (2009) 7. Clarke, C.L.A., Craswell, N., Soboroff, I.: Overview of the TREC 2009 web track.
In: Proceedings of The 18th Text REtrieval Conference (TREC). Gaithersburg,
MD, USA (2009)
8. Clarke, C.L.A., Craswell, N., Soboroff, I., Ashkan, A.: A comparative analysis of cascade measures for novelty and diversity. In: Proceedings of the 4thInternational Conference on Web Search and Web Data Mining (WSDM). pp. 75–84. Hong Kong, China (2011)
9. Clarke, C.L.A., Kolla, M., Cormack, G.V., Vechtomova, O., Ashkan, A., Buttcher, S., MacKinnon, I.: Novelty and diversity in information retrieval evaluation. In: Proceedings of the 31stAnnual International ACM SIGIR Conference on Research and Development in Information Retrieval (SIGIR). pp. 659–666. Singapore (2008) 10. Gamst, G., Meyers, L.S., Guarino, A.: Analysis of Variance Designs: A Conceptual and Computational Approach with SPSS and SAS. Cambridge University Press (2008)
11. Hill, M.O.: Diversity and evenness: A unifying notation and its consequences. Ecol-ogy 54(2), 427–432 (1973)
12. J¨arvelin, K., Kek¨al¨ainen, J.: Cumulated gain-based evaluation of IR techniques. ACM Transactions on Information Systems (TOIS) 20(4), 422–446 (2002) 13. Kingrani, S.K., Levene, M., Zhang, D.: Diversity analysis of web search results. In:
Proceedings of the ACM Web Science Conference (WebSci). pp. 43:1–43:2. Oxford, UK (2015)
14. Magurran, A.E.: Ecological Diversity and Its Measurement. Princeton University Press (1988)
15. Manning, C.D., Raghavan, P., Sch¨utze, H.: Introduction to Information Retrieval. Cambridge University Press (2008)
16. Pielou, E.C.: An Introduction to Mathematical Ecology. Wiley-Interscience (1969) 17. Santos, R.L., Macdonald, C., Ounis, I.: Search result diversification. Foundations
and Trends in Information Retrieval 9(1), 1–90 (2015)
18. Zhai, C., Cohen, W.W., Lafferty, J.D.: Beyond independent relevance: Methods and evaluation metrics for subtopic retrieval. In: Proceedings of the 26th Annual International ACM SIGIR Conference on Research and Development in Informa-tion Retrieval (SIGIR). pp. 10–17. Toronto, Canada (2003)
19. Zuccon, G., Azzopardi, L., Zhang, D., Wang, J.: Top-k retrieval using facility lo-cation analysis. In: Proceedings of the 34th European Conference on IR Research