Number 6037
Konkoly Observatory Budapest
26 September 2012
HU ISSN 0374 – 0676
NEW VARIABLE STARS IN THE GLOBULAR CLUSTER NGC 5694
RODRIGUES DE ANDRADE, L.1,2,3; CATELAN, M.1,3; SMITH, H. A.4
1
Departamento de Astronom´ıa y Astrof´ısica, Facultad de F´ısica, Pontif´ıcia Universidad Cat´olica de Chile, Av. Vicu˜na Mackenna 4860, 782-0436 Macul, Santiago, Chile; e-mail: [email protected]
2
Departamento de Astronom´ıa, Universidad de Chile. Santiago, Chile; e-mail: [email protected] 3
The Milky Way Millennium Nucleus, Av. Vicu˜na Mackenna 4860, 782-0436 Macul, Santiago, Chile 4
Dept. of Physics and Astronomy, Michigan State University, East Lansing, MI 48824, USA; e-mail: [email protected]
NGC 5694 (RA 14h39m36s, DEC−26◦32′18′′, J2000) is a metal-poor ([Fe/H] =−1.98)
globular cluster in the outer Galactic halo, at a Galactocentric distance of 29.4 kpc and a distance of 35.0 kpc from the Sun (quantities from Harris 1996, Dec. 2010 update). Ortolani & Gratton (1990) presented deep (V ≃ 24) CCD photometry for NGC 5694 and a (V, B−V) color-magnitude diagram (CMD) that shows an almost nonexistent red horizontal branch (HB) and a well-populated blue HB, which does not extend redward very far into the instability strip. This CMD morphology is confirmed in theHubble Space Telescope snapshot study of Piotto et al. (2002). Hazen (1996) presented a search for variable stars in NGC 5694, using photographic plates, and found no candidates.
Lee et al. (2006) performed a chemical abundance analysis of one RGB star in
NGC 5694, and found that the cluster has a very distinctive elemental abundance pat-tern, similar in some respects to those of nearby dwarf spheroidal (Sph) galaxies. This could mean that NGC 5694 has once been associated with a (currently unidentified) dwarf galaxy. Recent work by Correnti et al. (2011) reported the discovery of an extended stel-lar halo surrounding NGC 5694, based on deep (V ≃ 24.5) wide-field photometry with VIMOS-VLT. They were unable to draw a firm conclusion about the origin of this stellar halo, but suggested that NGC 5694 may indeed be the remnant of a disrupted dwarf satellite.
Given all the evidence for a possible extragalactic origin for NGC 5694, the analysis of this cluster in terms of the Oosterhoff (1939, 1944) argument is potentially relevant (Catelan 2009): is it an Oosterhoff-intermediate cluster, as commonly found in globulars that belong to the Milky Way’s dSph satellites? Or can it instead be classified into an Oosterhoff type I or II, as is typically the case among bona-fide Galactic globulars?
In this note, we present the results of a search for variable stars in NGC 5694, and report on the discovery of 15 variable stars candidates in the cluster, including 3 RR Lyrae stars.
the 1.3m telescope, comprising a total of 41, 43, and 44 images in B, V, and I, respec-tively. The second dataset was obtained in the course of 4 nights, between June 30 and July 23, 2007, with the 0.9m telescope, comprising a total of 5 images per filter. The third dataset was again obtained in the course of 4 nights, between January 10 and 14, 2010, with the 1.0m telescope, comprising a total of 6 images per filter.
[image:2.595.89.499.219.630.2]To search for variability in our data, we used the image subtraction technique with the package ISIS v2.2 (Alard & Lupton 1998; Alard 2000), only on the 1.3m images, since there were not enough images from the other telescopes.
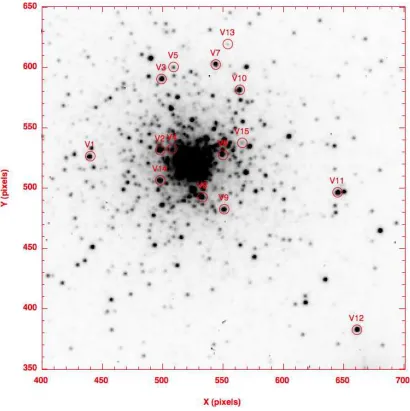
Figure 1. Finding chart for the variable star candidates in NGC 5694. North is up and East is to the right. The plate scale is 0.371 arcsec/pixel.
We also performed PSF photometry on these data, using the DAOPHOT package (Stetson 1987) in IRAF.1 This photometry was used to construct a CMD, generate in-dependent light curves (using the coordinates of the variable stars generated by ISIS),
1
and calibrate the ISIS light curves into standard magnitudes. DAOPHOT also enabled us to incorporate the images obtained with the 0.9m and 1.0m telescopes into our final light curves. We used the Stetson (2000) photometric standard field to perform the pho-tometric calibration of the B and V data. Since there is no standard field available for NGC 5694 in the I filter, we could not calibrate theI-band data. The astrometry of our images was also done using the Stetson standards.
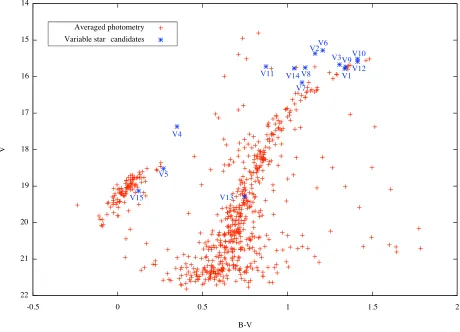
[image:3.595.103.491.330.542.2]In our work, we found 15 variable star candidates, listed in Table 1 with their coordi-nates, intensity-weighted mean B and V magnitudes and possible period and variability type. Their positions in the cluster are shown in Figure 1, and our preliminary CMD with the variable candidates highlighted is given in Figure 2. B- or V-band light curves for all candidates are shown in Figure 3. For V15, the second faintest star in our sample, we were not able to calibrate the ISIS light curves. The star was detected with DAOPHOT on only 3 images, and ISIS only detected its variability in the V-band. For the same reason, the magnitudes and colors of V15 listed in Table 1 are not an average over the whole curve, and its position in the CMD is not very precise.
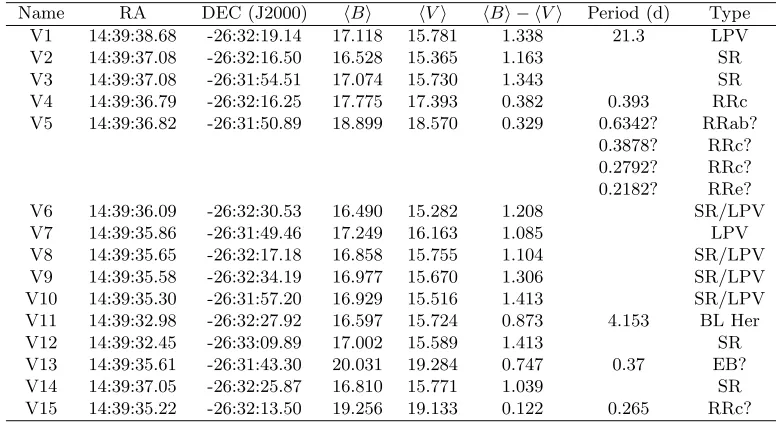
Table 1. Variable star candidates in NGC 5694.
Name RA DEC (J2000) hBi hVi hBi − hVi Period (d) Type V1 14:39:38.68 -26:32:19.14 17.118 15.781 1.338 21.3 LPV V2 14:39:37.08 -26:32:16.50 16.528 15.365 1.163 SR V3 14:39:37.08 -26:31:54.51 17.074 15.730 1.343 SR V4 14:39:36.79 -26:32:16.25 17.775 17.393 0.382 0.393 RRc V5 14:39:36.82 -26:31:50.89 18.899 18.570 0.329 0.6342? RRab?
0.3878? RRc? 0.2792? RRc? 0.2182? RRe? V6 14:39:36.09 -26:32:30.53 16.490 15.282 1.208 SR/LPV V7 14:39:35.86 -26:31:49.46 17.249 16.163 1.085 LPV V8 14:39:35.65 -26:32:17.18 16.858 15.755 1.104 SR/LPV V9 14:39:35.58 -26:32:34.19 16.977 15.670 1.306 SR/LPV V10 14:39:35.30 -26:31:57.20 16.929 15.516 1.413 SR/LPV V11 14:39:32.98 -26:32:27.92 16.597 15.724 0.873 4.153 BL Her V12 14:39:32.45 -26:33:09.89 17.002 15.589 1.413 SR V13 14:39:35.61 -26:31:43.30 20.031 19.284 0.747 0.37 EB? V14 14:39:37.05 -26:32:25.87 16.810 15.771 1.039 SR V15 14:39:35.22 -26:32:13.50 19.256 19.133 0.122 0.265 RRc?
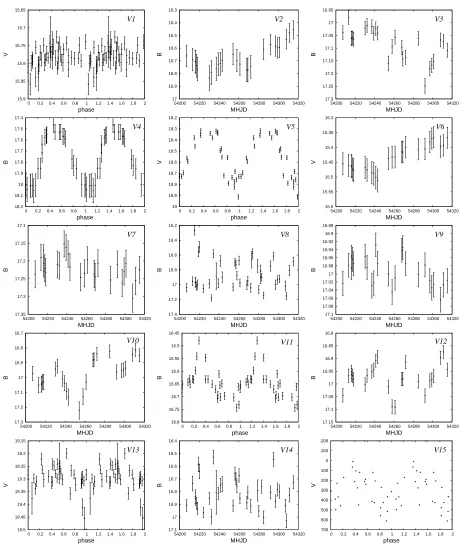
V5 is a particularly interesting star, as we have found at least four periods which may phase the available data, as shown in Table 1. Irrespective of the adopted period, the shape of the light curve seems nearly sinusoidal, which would be more consistent with a c-type RR Lyrae. However, the least noisy light curve is obtained with a period around 0.634 d, which is more typical of ab-type RR Lyrae. The light curve amplitudes can help with the classification. However, while for most of our stars the amplitudes obtained on the basis of DAOPHOT and ISIS are consistent, this is not so in the case of V5, for which we find a smaller amplitude in the B band with ISIS than with DAOPHOT. This may be due to a calibration problem. If the amplitude is really close to 1 mag in B, as ISIS suggests, that might be more consistent with an RRab than an RRc. On the other hand, the smaller DAOPHOT amplitudes in this filter (and also in the V data) suggest an RRc (or even an RRe) instead. Clearly, the photometry and calibration of this star must be revisited in future work, but meanwhile it seems almost certain that the star is indeed an RR Lyrae. The period used to plot its light curve in Figure 3 is 0.3876 d.
this needs confirming because it would be unusually short for a variable near the tip of the red giant branch (RGB).
The presence of a candidate short-period type II Cepheid, V11, is also worth noting. Type II Cepheids are typically found in systems with blue HB morphologies (see §4.2 in Catelan 2009 for a recent review). It is unclear why this star was not detected in previous studies, especially in view of the fact that it is not located near the cluster core (Fig. 1). In this sense, it should be noted that the light curves for the star in the other passbands are significantly noisier than the one in the B band that is shown in Figure 3.
As for V13, it is a possible eclipsing binary (EB) with a 0.37 d period. However, its location in the CMD indicates a star starting to ascend the RGB, and a period of 0.37 d may be a problem for an eclipsing star where at least the brighter member is a red giant. Since the eclipser classification mainly depends on two low points, more and better data will be needed in order to properly classify this star.
[image:4.595.72.532.340.672.2]Unfortunately, NGC 5694 turns out to be an intrinsically very RR Lyrae-poor cluster, and so it is impossible to properly classify the cluster in terms of an Oosterhoff status.
15.65 15.7 15.75 15.8 15.85 15.9
0 0.2 0.4 0.6 0.8 1 1.2 1.4 1.6 1.8 2
V phase V1 16.3 16.4 16.5 16.6 16.7 16.8 16.9 17
54200 54220 54240 54260 54280 54300 54320
B MHJD V2 16.95 17 17.05 17.1 17.15 17.2 17.25 17.3
54200 54220 54240 54260 54280 54300 54320
B MHJD V3 17.4 17.5 17.6 17.7 17.8 17.9 18 18.1 18.2
0 0.2 0.4 0.6 0.8 1 1.2 1.4 1.6 1.8 2
B phase V4 18.2 18.3 18.4 18.5 18.6 18.7 18.8 18.9 19
0 0.2 0.4 0.6 0.8 1 1.2 1.4 1.6 1.8 2
V phase V5 15.3 15.35 15.4 15.45 15.5 15.55 15.6
54200 54220 54240 54260 54280 54300 54320
V MHJD V6 17.1 17.15 17.2 17.25 17.3 17.35
54200 54220 54240 54260 54280 54300 54320
B MHJD V7 16.2 16.4 16.6 16.8 17 17.2 17.4
54200 54220 54240 54260 54280 54300 54320
B MHJD V8 16.88 16.9 16.92 16.94 16.96 16.98 17 17.02 17.04 17.06 17.08 17.1
54200 54220 54240 54260 54280 54300 54320
B MHJD V9 16.7 16.8 16.9 17 17.1 17.2 17.3
54200 54220 54240 54260 54280 54300 54320
B MHJD V10 16.45 16.5 16.55 16.6 16.65 16.7 16.75 16.8
0 0.2 0.4 0.6 0.8 1 1.2 1.4 1.6 1.8 2
B phase V11 16.8 16.85 16.9 16.95 17 17.05 17.1 17.15
54200 54220 54240 54260 54280 54300 54320
B MHJD V12 19.15 19.2 19.25 19.3 19.35 19.4 19.45 19.5
0 0.2 0.4 0.6 0.8 1 1.2 1.4 1.6 1.8 2
V phase V13 16.4 16.5 16.6 16.7 16.8 16.9 17 17.1
54200 54220 54240 54260 54280 54300 54320
B MHJD V14 -200 -100 0 100 200 300 400 500 600 700
0 0.2 0.4 0.6 0.8 1 1.2 1.4 1.6 1.8 2
V
phase
[image:5.595.71.531.133.679.2]V15
Figure 3. B- orV-band light curves of the NGC 5694 variable star candidates V1–V15. For V15, for
Acknowledgments: We thank P. Arriagada, C. Contreras, and P. Amigo for some useful discussions. Support for L.R. and M.C. is provided by the Ministry for the Economy, Development, and Tourism’s Programa Inicativa Cient´ıfica Milenio through grant P07-021-F, awarded to The Milky Way Millennium Nucleus; by Proyecto Basal PFB-06/2007; by Proyecto FONDECYT Regular #1110326; and by Proyecto Anillo ACT-86.
References:
Alard, C. 2000,A&AS,144, 363
Alard, C., & Lupton, R. H. 1998, ApJ, 503, 325
Catelan, M. 2009, Ap&SS, 320, 261
Correnti, M., Bellazzini, M., Dalessandro, E., Mucciarelli, A., Monaco, L., & Catelan, M. 2011, MNRAS, 417, 2411
Harris, W. E. 1996, AJ,112, 1487
Hazen, M. L. 1996,AJ,111, 1184
Lee, J.-W., L´opez-Morales, M., & Carney, B. W. 2006,ApJ,646, L119
Oosterhoff, P. T. 1939, Observatory, 62, 104
Oosterhoff, P. T. 1944, Bull. Astron. Inst. Neth., 10, 55
Ortolani, S., & Gratton, R. 1990, A&AS, 82, 71
Piotto, G., et al. 2002, A&A, 391, 945
Stetson, P. B. 1987, PASP, 99, 191