Regulation
Thesis by
Daniel Jones
In Partial Fulfillment of the Requirements for the Degree of
Doctor of Philosophy
California Institute of Technology Pasadena, California
2014
c
2014
Acknowledgements
All of the work described in this thesis involved colloborations with others, without whom much of this work would not have been possible. Rob Brewster has been an invaluable experimental partner throughout my time at Caltech, and one could not hope for a better companion on the journey from complete bench neophyte to occasional attainment of at least a minimal level of competence. Justin Kinney provided essential guidance on the sort-seq work which is discussed directly in chapter 3 but which also serves as backdrop throughout all the projects described here. Heun Jin Lee’s assistance with microscopy was essential to the work done involving mRNA FISH, and his knowledge of the physiology and regulation of the MscL protein has played a key role in efforts to unravel MscL’s transcriptional regulation. Of course, I want to thank my advisor, Rob Phillips, for asking skeptical questions about experimental measurements, for willingness to consider new ideas and approaches, and above all for creating a supportive and congenial lab environment. It has been an immense pleasure working with Rob and all the members of the Phillips lab.
Abstract
Understanding how transcriptional regulatory sequence maps to regulatory function remains a dif-ficult problem in regulatory biology. Given a particular DNA sequence for a bacterial promoter region, we would like to be able to say which transcription factors bind there, how strongly they bind, and whether they interact with each other and/or RNA polymerase, with the ultimate objec-tive of integrating knowledge of these parameters into a prediction of gene expression levels. The theoretical framework of statistical thermodynamics provides a useful framework for doing so, en-abling us to predict how gene expression levels depend on transcription factor binding energies and concentrations. We used thermodynamic models, coupled with models of the sequence-dependent binding energies of transcription factors and RNAP, to construct a genotype to phenotype map for the level of repression exhibited by thelacpromoter, and tested it experimentally using a set of pro-moter variants from E. coli strains isolated from different natural environments. For this work, we sought to “reverse engineer” naturally occurring promoter sequences to understand how variations in promoter sequence affects gene expression. The natural inverse of this approach is to “forward engineer” promoter sequences to obtain targeted levels of gene expression. We used a high precision model of RNAP-DNA sequence dependent binding energy, coupled with a thermodynamic model relating binding energy to gene expression, to predictively design and verify a suite of syntheticE. coli promoters whose expression varied over nearly three orders of magnitude. However, although thermodynamic models enable predictions of mean levels of gene expression, it has become evident that cell-to-cell variability or “noise” in gene expression can also play a biologically important role. In order to address this aspect of gene regulation, we developed models based on the chemical master equation framework and used them to explore the noise properties of a number of commonE. coli
Contents
Acknowledgements iii
Abstract iv
1 Introduction 6
1.1 The central dogma of molecular biology . . . 6
1.2 Gene regulation . . . 7
1.3 Thermodynamic model of transcriptional regulation . . . 12
1.4 Stochastic chemical kinetics model of transcriptional regulation . . . 19
Bibliography . . . 26
2 Comparison of the theoretical and real-world evolutionary potential of a genetic circuit. 35 2.1 Introduction. . . 35
2.2 Results. . . 36
2.2.1 Quantitative model of the natural parameters that regulate gene expression . 36 2.2.2 Sensitivity of expression to model parameters . . . 40
2.2.3 Mapping from sequence space to level of regulation . . . 40
2.2.4 Promoter sequence variability of natural isolates and available sequenced genomes 43 2.2.5 Does the model account for variability in the natural isolates? . . . 44
2.2.6 Exploring the variability among different species . . . 45
2.3 Discussion . . . 46
2.4 Materials and methods . . . 49
2.4.1 Growth conditions . . . 49
2.4.2 Gene expression measurements . . . 49
2.4.3 Measuringin-vivo lac repressor copy number . . . 50
2.4.4 Constructing thein-vivo lac repressor energy matrix . . . 51
2.5 Supplementary information . . . 51
2.5.2 16S rRNA sequences . . . 51
2.5.3 Model parameters . . . 52
2.5.4 Derivation of the repression level equation . . . 52
2.5.5 Estimating the number of active CRP molecules . . . 54
2.5.6 Estimating the number of available RNAP . . . 55
2.5.7 Estimating CRP’s binding energy . . . 55
2.5.8 Fitting parameters and testing the model . . . 56
2.5.9 Testing the model with different data . . . 56
2.5.10 Error propagation . . . 56
2.5.11 Measuring repression level decouples growth rate effects in translation from effects in transcription . . . 58
2.5.12 Related microbial specieslac operon phylogenetic tree . . . 59
2.5.13 Epistasis analysis . . . 60
Bibliography . . . 63
3 Sort-Seq: High-throughput perturbation and characterization of regulatory DNA 69 3.1 Introduction . . . 69
3.1.1 Materials and methods . . . 70
3.1.1.1 Overview . . . 70
3.1.1.2 Cloning and library construction . . . 70
3.1.1.3 Growth and flow cytometry . . . 72
3.1.1.4 Library preparation . . . 72
3.1.1.5 Sequencing . . . 72
3.1.2 Identifying TF and RNAP binding sites using “information footprints” . . . . 72
3.1.3 Fitting models of protein-DNA interaction . . . 77
3.1.3.1 Estimating mutual information between observed data and model predictions . . . 79
3.1.3.2 Markov Chain Monte Carlo (MCMC) sampling of model parametersθ 81 3.2 Exploring uncharacterized regulatory DNA: themscLpromoter as a case study . . . 85
3.2.1 Introduction . . . 85
3.2.2 Materials and methods. . . 86
3.2.3 Gene expression assays under various environmental conditions. . . 90
3.2.4 Analysis of putative binding sites. . . 92
3.2.5 Testing the energy matrices using designed variants of themscLpromoter. . 100
4 Tuning promoter strength through RNA polymerase binding site design in
Es-cherichia coli 105
4.1 Introduction . . . 105
4.2 Results . . . 107
4.2.1 Thermodynamic model for constitutive expression . . . 109
4.2.2 Constitutive gene expression measurements: mRNA and protein . . . 111
4.2.3 Protein burst size . . . 112
4.2.4 Thermodynamic model for simple repression . . . 113
4.2.5 Gene expression in simple repression . . . 114
4.3 Discussion . . . 116
4.4 Methods . . . 116
4.4.1 Energy matrix . . . 116
4.4.2 Strains . . . 117
4.4.3 Growth . . . 117
4.4.4 LacZ assay . . . 118
4.4.5 Single Cell mRNA FISH . . . 118
4.4.6 FISH data acquisition . . . 119
4.4.7 FISH analysis . . . 119
4.4.7.1 Cell identification and segmentation . . . 119
4.4.7.2 Fluorescence segmentation . . . 119
4.4.7.3 mRNA quantification . . . 120
4.5 Supplementary information . . . 120
4.5.1 Supplementary information text S1 . . . 121
4.5.2 Supplementary information text S2 . . . 123
4.5.3 Supplementary information text S3 . . . 124
4.5.4 Supplementary information text S4 . . . 126
4.5.5 Supplementary information text S5 . . . 127
Bibliography . . . 128
5 Effect of promoter architecture on the cell-to-cell variability in gene expression 132 5.1 Introduction . . . 132
5.2 Methods . . . 135
5.2.1 Promoter noise and variability of mRNA and protein numbers . . . 140
5.2.2 Parameters and assumptions . . . 142
5.2.3 Simulations . . . 143
5.3 Results . . . 144
5.3.2 Promoter with two repressor-binding operators . . . 150
5.3.2.1 Cooperative and independent repression. . . 150
5.3.2.2 Simultaneous binding of one repressor to two operators: DNA looping.152 5.3.3 Simple activation . . . 154
5.3.4 Dual activation: Independent and cooperative activation . . . 157
5.4 Discussion . . . 158
5.4.1 Intrinsic and extrinsic noise . . . 161
5.4.2 Comparison with experimental results . . . 162
5.4.3 Future Directions . . . 164
5.4.4 Shortcomings of the approach . . . 165
5.4.5 Supporting information . . . 167
5.5 Supplementary Information . . . 168
5.6 Bibliography . . . 186
6 Promoter architecture dictates cell-to-cell variability in gene expression 192 6.1 Introduction . . . 192
6.2 Results . . . 194
6.2.1 Transcriptional Variability in Constitutive Expression . . . 194
6.2.2 Transcriptional variability in simple repression . . . 198
6.3 Discussion . . . 200
6.4 Materials and Methods . . . 203
6.4.1 Strains . . . 203
6.4.2 Growth . . . 203
6.4.3 mRNA FISH . . . 204
6.4.3.1 Fixation and labeling . . . 204
6.4.3.2 FISH data acquisition . . . 204
6.4.3.3 FISH analysis . . . 205
6.4.4 Miller LacZ assay . . . 207
6.5 Supplementary text . . . 207
6.5.1 Calibration of mRNA FISH data versus Miller assay . . . 207
6.5.2 Estimation of additional noise sources . . . 208
6.5.2.1 Quantification error in image analysis . . . 208
6.5.2.2 Gene copy number variation . . . 212
6.5.2.3 Extrinsic noise due to repressor copy number fluctuations . . . 214
6.5.2.4 Extrinsic noise due to RNAP copy number fluctuations . . . 215
6.5.2.5 Extrinsic sources of noise: Concluding remarks . . . 217
6.5.4 Copy number variation: Uncorrected figures . . . 219
6.5.5 Testing gene copy number noise by cell size segregation . . . 219
6.5.6 Determination of rate parameter values . . . 220
6.5.7 Supplemental Figures . . . 222
6.5.8 Supplementary Tables . . . 232
Chapter 1
Introduction
1.1
The central dogma of molecular biology
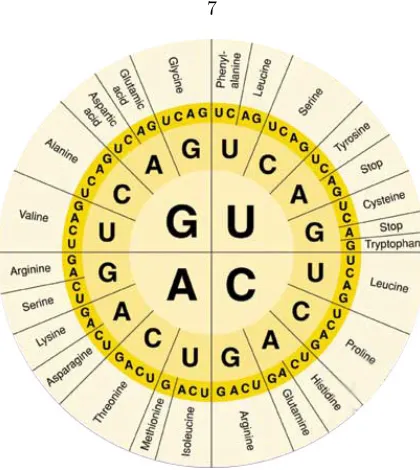
The elucidation of the genetic code is one of the signal accomplishments of the field of molecular biology. It was the culmination of a decades-long search to unravel the mechanism by which genetic information is passed down from generation to generation in living organisms. Key insights along the way include Oswald Avery’s discovery that DNA (and not protein) is the molecule by which genetic information is propagated [1]; Chargaff’s observation that the fraction of As equals the fraction of T’s in a DNA molecule, and likewise for Cs and Gs [2, 3]; and Watson and Crick’s discovery of the structure of DNA, which “immediately suggests a possible copying mechanism for the genetic material,” as Crick put it at the time [4]. Still, the precise mechanism by which a particular DNA sequence mapped to a particular protein remained unknown. In 1961, Crick, Brenner, and coworkers arrived at the now familiar result that a protein coding sequence consists of a series of trinucleotide codons [5], by showing that insertions of three base pairs into the phage T4 rIIB gene yielded a functioning protein (whereas insertions of one, two, or four bp yielded a non-functional protein). Researchers in various laboratories subsequently determined the mapping between codon sequence and amino acid identity; the ultimate result of these efforts was the codon table as seen in Figure 1.1. The actual act of translating from DNA sequence to protein sequence occurs in the ribosomes, where transfer RNAs recognize each codon of the messenger RNA in turn and add the appropriate amino acid to the growing polypeptide chain. This entire process by which genetic information flows from DNA to messenger RNA to protein was termed the “central dogma” of molecular biology by Crick in 1958.
Figure 1.1: Codon table. The mapping between codon sequence and amino acid identity can be read off the table from the inner to outer rings.
coding sequence, it is trivial to predict the exact amino acid sequence of the resulting protein. But predicting the regulatory function of a given sequence of regulatory DNA is more or less completely infeasible except in a limited number of special cases. The principal thrust of this thesis, then, will be to arrive at a more detailed understanding of how DNA sequence maps to regulatory function. “Regulatory function” is an admittedly malleable term, and could be taken to mean the level of expression of a particular gene in terms of absolute numbers of proteins per cell; the degree to which expression of a gene is turned off under certain environmental conditions (“repression”), or the level of cell-to-cell variability or “noise” in expression. Each of these will be considered in detail in this work.
1.2
Gene regulation
10 copies per cell of thelac repressor are sufficient to repress expression of the lac operon by 1000 fold (see Chapter 2 of this work). To state the obvious, a cell with 10 ribosomes and 10,000 lac
repressor molecules would be wholly dysfunctional. Ensuring that global stoichiometries of cellular components are appropriately balanced is thus an important aspect of gene regulation [6, 8].
Another important function of gene regulation is enabling cells to respond appropriately to envi-ronmental conditions. For instance, the canonicallac promoter system “turns on” production of the appropriate enzyme (LacZ) and membrane transporter (LacY) for metabolization of the dissacharide lactose when lactose is present in the environment and glucose is not. Production of these proteins is costly to the cell and thus cells that avoid expression when these conditions do not obtain have a fitness advantage over cells that do [9, 10]. In B. subtilis, an array of transcription factors and sigma factors is responsible for differentiation in times of nutritional stress into a sporulated state characterized by a tough external coating and virtually no energy consumption, allowing the cell to survive until environmental conditions are more favorable [11].
Gene regulation occurs at all the steps along the central dogma. In prokaryotes, transcription is regulated by DNA-binding proteins called transcription factors (TFs) that bind a gene’s promoter region and activate or repress transcription of that gene. Unlike in the eukaryotic setting, where enhancers can be up to tens of kilobases away from the promoter, most prokaryotic transcription factors bind within approximately 100 bp of the gene they regulate (M. Rydenfelt, manuscript in preparation; data from [12]). In eukaryotes, it is well established that transcription is also regulated by the chromatin state, as DNA condensation mediated by nucleosomes can render regions of DNA inaccessible to transcription factors and RNA polymerase [13–16]. Although this mode of regulation is less thoroughly explored in prokaryotes, there is evidence that nucleoid associated proteins like H-NS, HU, Fis, and IHF, which are structurally similar to eukaryotic histone proteins, can also affect gene expression by structural modification of the chromosome [17–20]. Similarly, the supercoiling state of prokaryotic DNA can also play a role in determining gene expression [21, 22].
After transcription, translation is regulated by two principal mechanisms: small RNAs and the sequence of the ribosomal binding site. The ribosomal binding site is located in the 5’ untranslated region (5’ UTR) of an mRNA transcript, and its strength has important implications for how much a particular mRNA transcript is transcribed. Factors involved in ribosome binding strength include the interaction between the ribosome binding site and the 16s rRNA, the spacing between 16s rRNA binding site and the start codon, start codon sequence, and the free energy cost of unfolding any mRNA secondary structures in the RBS region [23, 24]. Small RNAs include both cis and
Such sRNAs can repress translation by blocking the ribosomal binding site or enhancing mRNA degradation; they can also increase translation by disrupting mRNA secondary structures that sequester the ribosomal binding site [25–27]. Finally, the activity of already-produced proteins is often modulated by post-translational modifications such as phosphorylation and dephosphorylation. Given that gene regulation occurs at all steps along the central dogma, what determines the step at which a particular gene is regulated? And what are the relative prevalences of the different forms of gene regulation? Unfortunately, definitive answers are not available for either of these questions, though it is certainly possible to speculate. Possible considerations include speed of response and metabolic efficiency. Post-translational modifications require only a single phosphorylation reaction to take place and thus can operate on a relatively fast timescale. However, this type of regulation requires that the relevant proteins have already been produced. Transcriptional regulation occurs at the very beginning of the path from gene to protein, and thus is more efficient in the sense that cutting off gene expression at the source means that no resources need to be expended on unnecessary gene expression. However, the timescale at which transcriptional regulation can respond to changing environmental conditions is limited by the binding/unbinding kinetics of the relevant transcription factors (often on the order of minutes), the time needed for RNA polymerase to produce an mRNA transcript (tens of seconds), translation (tens of seconds), protein folding (variable; often
<1 second [28]), and, in some cases, protein maturation. Thus it seems reasonable to postulate a tradeoff between speed of response and efficiency between these modes of gene regulation. Another possible consideration is the nature of the response function to environmental stimuli: computational studies have found that small RNA regulation can produce qualitatively different response functions compared with TF-mediated transcriptional regulation [27, 29, 30]. As for the relative prevalence of different forms of regulation, despite the status ofE. coli as a ubiquitous model organism for nearly a century, there is insufficient data to make a definitive pronouncement. For instance, of the roughly 4000 genes in E. coli, roughly half lack any transcriptional regulatory annotation whatsoever. It seems unlikely that all of these genes have no transcriptional regulation; far more likely is that this state of affairs reflects simple ignorance. In a subsequent chapter, we use a high throughput promoter mutagenesis experiment to explore the transcription of one such un-annotated gene, namelymscL
(the mechanosensitive channel of large conductance). We identify three putative transcription factor binding sites. Of course, thisn= 1 observation does not prove anything, but it lends support to the idea that vast swathes ofE. coligene regulation remain uncharacterized, and hence that statements about the relative importance of transcriptional vs. translational vs. post-translational regulation are necessarily speculative in the absence of much-needed data.
250
200
150
100
50
0
50
100
Position relative to TSS
0
20
40
60
80
100
120
140
Overlapping operators
Figure 1.2: Repressor binding site positions. This histogram shows the number of repressor binding sites overlapping each nucleotide position, where nucleotide positions are reported with respect to the transcription start site. The plot was generated using data from the RegulonDB database [12]. The majority of repressor binding sites are within 50 bp of the transcription start site, although some are found as far as 200 bp upstream. Adapted from reference [34], courtesy of M. Rydenfelt.
the genes themselves remain largely the same, differences in their regulation encoded by non-protein-coding regulatory DNA yield the “endless forms most beautiful” remarked upon by Darwin. More closely related to the subject of this thesis, transcriptional regulation is integral to phenomena such as bacterial biofilm formation which depends on transcriptional activation of expression of polysaccharides to form a relatively impregnable extracellular matrix [31]. Various other behaviors related to quorum sensing and collective behavior are transcriptionally regulated as well [32, 33].
Figure 1.3: (a)Type I transcriptional activation. The activator protein (for instance, CRP) inter-acts with the α C-terminal domain of the RNA polymerase holoenzyme; this favorable energetic interaction increases the probability that RNAP binds the promoter. (b) Activation by arbitrary protein-protein contact. The wild-typeα-CTD has been replaced by the CTD of theλcI protein, which binds cooperatively to cI protein bound at an upstream binding site. The presence of cI at the upstream binding site increases transcription by approximately six fold. Adapted from [45].
the binding of an activator. Finally, it is worth noting that repression via steric exclusion can still be mediated by repressor binding sites away from the immediate vicinity of the transcription start site via the formation of DNA loops, as in the cases of thelac andaraC promoters [37–39].
The mechanisms of transcriptional activation are somewhat less straightforward than repression. Activation can be brought about either by stabilizing the formation of the initial closed complex (and thus reducing the dissociation constant of the RNAP holoenzyme-promoter complex), by increasing the isomerization rate from the closed complex to the open complex, or by some combination of both [40–42]. Activation is often divided into two broad classes, namely, Class I and Class II [43, 44]. Class I transcriptional activation involves interactions between the RNAP alpha C terminal domain (α-CTD) and an activator TF bound upstream (10s of bp) of the RNAP binding site. Class II transcriptional activation involves activator TFs bound directly adjacent to or overlapping the promoter -35 region. In class II activation, TFs can (in addition to interactions with the α -CTD) interact with the RNAP at the alpha N terminal domain (α-NTD), or with region 4 of the sigma factor. It has been shown that in the context of Class II activation by CRP, a ubiquitous global TF, interactions between theα-CTD and CRP affect the equilibrium formation of the closed complex, while interactions between theα-NTD and CRP affect the isomerization rate to the open complex [41].
al showed that this interaction did indeed occur and moreover was sufficient to cause transcriptional activation [45]. In addition to activation via such “molecular velcro” type interactions, activation can also be effected by “derepression,” where a protein serves as an effective activator by blocking or inhibiting a repressor molecule. It has been shown that LacI itself, the canonical example of a repressor, can serve as an activator, in the context of the E. coli bgl promoter, by disruption of repression by H-NS [47].
1.3
Thermodynamic model of transcriptional regulation
The preceding discussion touched on many of the most important elements of transcriptional reg-ulation. As physicists and quantitative scientists, we would like to go beyond descriptive cartoons and qualitative descriptions of the effects of various molecular players to construct a more quanti-tative picture. Adding urgency and relevance to this desire is the fact that many assays to measure gene expression yield quantitative results in terms of the number of mRNA and protein molecules produced. To fully engage with and and learn as much as possible from these measurements, we need to be able to make falsifiable quantitative predictions.
One class of models that has been successful in making quantitative predictions about gene regulation is that of thermodynamic or statistical mechanical models. This may seem surprising at first glance since biological systems are perhaps the single most salient example of systems that reside out of equilibrium; or, as the economist John Maynard Keynes put it, “In the long run we are all dead”. Yet although in the long run biological systems are out of equilibrium, the separation of timescales involved in different cellular processes means that a quasi-equilibrium description of certain processes is not inappropriate. As we will see, many studies have used thermodynamic models successfully to quantitatively model gene expression.
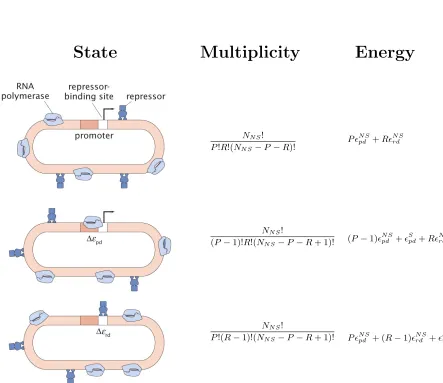
Thermodynamic models of gene regulation take as their foundational assumption the idea that the level of gene expression is proportional to the equilibrium probability that RNA polymerase is bound to the promoter. Later, we will explore the conditions under which a quasiequilibrium view of transcription is accurate, using a simplified model of the kinetics of transcription initiation, but in brief, we expect this assumption to be valid in the limit that RNAP binding and unbinding is fast compared with the rate of transcription initiation. The procedure for constructing a thermodynamic model is straightforward in principle: one enumerates all the possible configurations of the system, and for each configuration computes the multiplicity (i.e.,the number of ways of realizing a particular configuration) and the energy of that configuration. The Boltzmann weight for a particular state is then simply the multiplicity times e raised to the energy of that configuration divided by kBT,
where kB is Boltzmann’s constant. According to the Boltzmann distribution, the probability of
State
Multiplicity
Energy
NN S!
P!R!(NN S−P−R)!
NN S!
(P−1)!R!(NN S−P−R+ 1)!
NN S!
P!(R−1)!(NN S−P−R+ 1)!
P N Spd +R N S rd
(P−1)N Spd + S pd+R
N S rd
P N Spd + (R−1) N S
rd +
[image:18.612.115.558.106.489.2]S rd
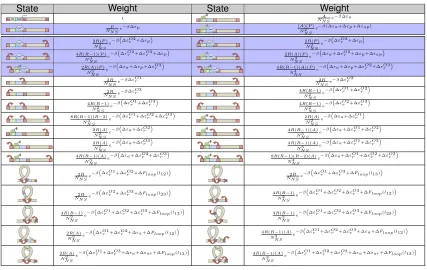
Figure 1.4: States, multiplicities, and energies for simple repression. For the “simple repres-sion” architecture, the promoter can take three possible states (shown top to bottom in the figure): neither repressor nor polymerase bound, polymerase bound, or repressor bound. By assumption, RNAP cannot bind the promoter when the repressor is bound. The multiplicities reflect the number of ways of distributingPpolymerases andRrepressors amongNN Snon-specific binding sites, where NN S is typically taken as the length of the genome. The nonspecific polymerase-DNA binding
en-ergy is given byN S
pd , while the specific polymerase-DNA binding energy of the promoter of interest
is given by Spd. Likewise, the nonspecific repressor-DNA binding energy is N Srd , and the specific repressor-DNA binding energy isSd. The Boltzmann weight of each state is given by Ω×e−E/kBT,
where Ω is the multiplicity of the state,Eis the energy of the state andkB is Boltzmann’s constant.
by the sum of the weights of all configurations (the partition function). The probabilities of all configurations in which RNAP is bound at the promoter are summed, and the overall level of gene expression is assumed to be proportional to this quantity. For instance, for the “simple repression” scenario depicted in Figure 1.4, the probability that RNAP is bound is given by [35]:
pbound=
P NNSexp
−∆pd
kBT
1 + NP
NSexp
−∆pd
kBT
+NR
NSexp
−∆rd
kBT
, (1.1)
where P is the number of polymerases, R is the number of repressors, NN S is the number of
nonspecific protein binding sites (usually taken to the be the length of the genome), ∆pd=Spd−N Spd
is the difference between the specific and nonspecific binding energies for RNAP, and ∆pd=Srd−N Srd
is the difference between specific and nonspecific binding energies for the repressor. More negative values of ∆pd and ∆rd indicate stronger binding.
The constant of proportionality between gene expression andpbounddepends on details such as the rate of transcription initiation while RNAP is in the bound state, the mRNA degradation rate, the translation rate, the protein degradation rate, and the rate of cell division. A convenient way to sidestep the need to know all these parameters is to simply consider the ratios of gene expression levels under different intracellular conditions. For instance, one can define the Repression as the ratio of gene expression in the presence of a repressor TF to gene expression in the absence of the repressor TF. Then (as long as the parameters mentioned above don’t depend on TF concentration), the repression depends only on the ratio ofpboundin the presence of repressor topboundin the absence of repressor, eliminating the possibly unknown constant of proportionality. For the simple repression example in Figure 1.4, the repression is given by
Repression =
1 + NP
NSexp
−∆pd
kBT
1 +NP
NSexp
−∆pd
kBT
+NR
NSexp
−∆rd
kBT
. (1.2)
Thus, even if the exact constant of proportionality is unknown, direct comparisons between theory and experiment can be made by taking the ratio of two gene expression measurements and comparing with Equation 1.2 [35].
and rigorously tested this model in a series of carefully designed experiments [52]. See also [53] and Chapter 2 of this work for an extension of these results. Bintu et al have systematized this overall approach and presented a thermodynamic analysis of 10 common regulatory motifs in prokaryotes [54, 55].
Thermodynamic models have also been applied successfully in the eukaryotic context including yeast promoters [56] and the expression of genes responsible for segmentation inDrosophila develop-ment [57]. In eukaryotes, an additional complication arises from the presence of nucleosomes, which form the basic building block of chromatin and consist of 147 bp of DNA wrapped around a histone protein octamer. DNA that is part of a nucleosome is inaccessible to binding by TFs or RNAP, and hence the presence or absence of nucleosomes in the promoter region has a significant effect on transcription. Like TFs, nucleosomes have distinct sequence preferences and thus nucleosome positioning can be encoded by the DNA sequence of the genome [58, 59]. Nucleosome occupancy is thus an additional molecular species to be accounted for when enumerating the possible states in a thermodynamic model [16]. Proteins similar to eukaryotic histones appear in prokaryotes, including H-NS, HU, and StpA. Although it appears that they too can play a significant role in transcrip-tional regulation, this aspect of prokaryotic regulation has garnered somewhat less attention than in eukaryotes. Later on in this thesis, we will explore the regulation of anE. coli promoter in which H-NS appears to play a role, themscLpromoter.
A commonly used three-step model of transcription initiation comprises the following steps: (1) (reversible) closed complex formation; (2) (irreversible) open complex formation; and (3) (irre-versible) promoter clearance (which itself is comprised of rounds of abortive initiation followed by clearance and RNA chain elongation) [60–62]. We will consider a slightly simplified two-step version of the model in which closed complex formation occurs reversibly with association rate kP
on and
dissociation ratekP
of f, and transcription is initiated from the closed complex at a ratekt. This
sim-plification is appropriate in the limit that the the promoter escape rate is much larger than the open complex formation rate (i.e., in the limit that transcription initiation has open complex formation as a single rate-limiting step, which appears empirically to be the case [40, 61]). Figure 1.5a shows a schematic of this two-step model of transcription initiation. This schematic can be applied directly to the case of constitutive expression, where transcription occurs independently of any transcription factors.
The standard assumption in equilibrium statistical mechanical models of gene expression is that gene expression is proportional to the probability that RNA polymerase is bound at the promoter, given equilibrium between the unbound and bound (i.e., closed complex) states. In the language of rate constants in Figure 1.5a, this probability is given by
pbound=
kP on kP
on+kPof f
kP off kPon
r
γ
RNAP RN
Promoter Prom
Transcription rate: r
RNAP copy # RNAP affinity
O A B C LacI co Repressor o k t Promoter O kP off kPon
r
γ
RNAP
Promoter
Transcription rate: r
RNAP copy # RNAP affinity
O A C kt Promoter O kR off kR on Promoter O LacI
(a) Schematic of the kinetics of transcription for constitutive expression. The polymerase binds the promoter at ratekP
on, forming a closed complex, and unbinds at ratekPoff. Transcripts are produced from the bound
state at rate kt, and the system reverts to the unbound state upon production of an mRNA transcript.
All intermediate steps between formation of the closed complex and production of a transcript (e.g., open complex formation, abortive initiation) are subsumed into the single effective ratekt, which is appropriate as
long as these intermediates have a single rate-limiting step (generally taken to be open complex formation).
kP off kP on
r
γ
RNAP RN Promoter PromTranscription rate: r
RNAP copy # RNAP affinity
O A B C LacI co Repressor o k t Promoter O
kPoff kP on
r
γ
RNAP PromoterTranscription rate: r
RNAP copy # RNAP affinity
O A C k t Promoter O kR off kRon
Promoter O LacI
(b) Schematic of the kinetics of transcription for simple repression. The two states on the right of the schematic (promoter unbound and promoter bound by RNAP) are the same as in part (a); additionally, the promoter can be bound by a repressor such as LacI (leftmost state in schematic). Transcription cannot occur when the repressor is bound. The repressor binds at ratekonR and unbinds at ratekoffR.
The constant of proportionality is given by the transcription ratektdivided by the degradation rate γ, so that the overall predicted level of mean gene expression is given by
hmRNAi=kt
γ
kPon kP
on+kPof f
. (1.4)
With respect to our model of constitutive transcription, under which conditions do we expect this assumption to hold? A moment’s reflection reveals that as long as the initiation rate from the closed complex kt is much less than the dissociation rate of the closed complex kof fP (i.e., kt<< kof fP ) there will be many association and dissociation events for each transcription event, and
the quasiequilibrium description will hold. If kt is comparable to or larger than kPof f, the system
will be continually driven out of equilibrium by irreversible transcription events, and an equilibrium description is not appropriate. In Figure 1.6a, we compare the predictions of the equilibrium model (given in Equation 1.4) with the gene expression levels obtained by performing Gillespie simulations of the scenario shown in Figure 1.5a, for a range of values of kt/kof fP . The Gillespie algorithm is
a well-known algorithm for performing exact stochastic simulations of chemical reaction networks [63]. Briefly, the algorithm entails enumerating all possible reactions the system can undergo (e.g.
production of an mRNA transcript, degradation of a transcript, association and dissociation of RNAP). At each time step of the simulation, the total ratektotfor all possible reactions is calculated
as the sum of the rates of the possible reactions, and the length of time until the next reaction occurs is drawn from an exponential distribution with mean 1/ktot. The particular reaction that occurs is
chosen randomly weighted by the rates of the possible reactions. See Chapter 5.2.3 for additional information.
As expected, the simulations show that the equilibrium model accurately predicts gene expression when kt << kof fP , but diverges when kt ∼ kPof f. There is good (although indirect) experimental
evidence that this condition does hold for E. coli promoters. For instance, Hawley and McClure performed abortive initiation assays in anin vitro transcription reaction, and found that the delay time between addition of RNAP to the reaction and open complex formation was consistent with rapid equilibrium of the closed complex and open complex formation as a single rate-limiting step [61]. In a related assay, the same authors added a repressor TF (λcI) to a similarin vitroreaction and found that the formation of open complexes was immediately (within measurement precision) halted, consistent with a picture in which rapid dissociation of RNAP immediately allows the repressor to bind, while existing open complexes are unaffected [40]. To date, the rates of closed complex formation and dissociation have not been directly measuredin vivo.
10
-310
-210
-110
010
1k
t
/k
P
off
2
0
2
4
6
8
10
Mean mRNA expresion
Equilibrium model,
k
P on=100
Equilibrium model,
k
P on=10
Simulation,
k
P on=100
Simulation,
k
P on=10
(a) Equilibrium thermodynamics vs. exact stochastic treatment for constitutive expression.
konP = 100, kt= 10, γ= 1.
10
-310
-210
-110
010
1k
t
/k
P
off
0
2
4
6
8
10
Mean mRNA expresion
Equilibrium model,
k
Ron
=
k
offR=100
Equilibrium model,
k
Ron
=
k
offR=1
Simulation,
k
Ron
=
k
offR=100
Simulation,
k
Ron
=
k
offR=1
(b) Equilibrium thermodynamics vs. exact stochastic treatment for simple repression.
[image:23.612.171.477.77.306.2]konP = 100, kt= 10, γ= 1,konR andkRof f as indicated in legend.
Figure 1.6: Gillespie simulations of scenarios depicted in Figure 1.5. For both constitutive expression and simple repression, the thermodynamic model accurately predicts expression when
kt << konP but diverges when kt ∼ kPon. The fact that the thermodynamic model overestimates
of the promoter is slightly more complex in this case and given by (compare with Equation 1.1)
pbound=
kPon kP
of f
1 + kPon
kP of f
+ kRon
kR of f
, (1.5)
yielding a predicted gene expression level of
hmRNAi=kt
γ
kPon kP
of f
1 + kPon
kP of f
+ kRon
kR of f
. (1.6)
As in the previous example, we can perform Gillespie simulations to exactly simulate the stochas-tic reactions schematized in Figure 1.5b, and compare the results of these exact simulations with the equilibrium binding prediction of Equation 1.6. We do so for two sets of values of the repres-sor association and dissociation rates, one set exhibiting kinetics on the same timescale as RNAP binding/unbinding, and one set exhibiting slower kinetics than RNAP binding/unbinding. In Fig-ure 1.6b, we see that again, it is the ratio of the RNAP dissociation ratekP
of f to the transcription
initiation rate that determines the accuracy of the equilibrium description. Interestingly, the relative magnitude of the transcription factor kinetics does not play a role - the equilibrium thermodynamics description accurately predicts mean gene expression even for TF kinetics substantially slower than RNAP kinetics. Thus, it is not necessary to postulate that all relevant timescales in the system be faster than transcription initiation kinetics - only that the RNAP unbinding rate be faster thankt.
Of course, the conclusions drawn from these models are only valid insofar as the schematics in Figure 1.5 are an accurate depiction of reality. Nonetheless, it seems reasonable to conclude that equilibrium statistical mechanics descriptions of gene regulation are likely to be applicable in a broad range of situations. Of particular noteworthiness is the fact that the applicability of equilibrium assumptions is determined only by the relative rates of RNAP dissociation (kP
of f) and transcription
initiation from the closed complex (kt), and not by the rates of transcription factor kinetics. This is
a good thing since the timescales of transcription factor association and dissociation are frequently on the order of minutes, whereas transcription events can occur on the timescale of seconds. Thus it would be unpromising indeed for the general applicability of thermodynamic models if TF kinetics were required to occur on faster timescales than transcription.
1.4
Stochastic chemical kinetics model of transcriptional
reg-ulation
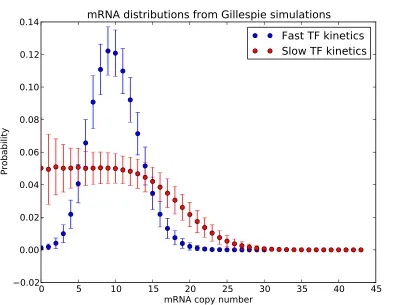
statement is correct, but somewhat incomplete. The reason why it is incomplete is immediately evident upon inspection of the full probability distribution functions for mRNA expression for each of the two cases considered (slow and fast TF kinetics). As seen in Figure 1.7, while it is true that both distributions have the same mean, the distribution corresponding to slow TF kinetics is much broader than the distribution corresponding to fast TF kinetics. In fact, in the limit that TF kinetics are much slower than mRNA degradation, the distribution will be bimodal. For fast TF kinetics, the distribution is reasonably well-characterized by the mean value: the distribution is unimodal and centered on the mean value. For slow TF kinetics, the mean value does a poor job of characterizing the distribution: the distribution is not centered on the mean, and is very broad. Although the thermodynamic model correctly predicts the mean expression for slow TF kinetics, this prediction is arguably not a particularly useful or relevant characterization of gene expression from the promoter. We are thus motivated to consider models of gene expression that allow us to make predictions about higher moments of the probability distribution function for gene expression. The fundamental theoretical tool for characterizing stochastic gene expression is the master equation. The master equation is essentially a way of keeping track of the transitions between states for a Markov process, and can be applied to any Markov process. A Markov process is a stochastic process with no memory, for which the state of the system at time t3 depends only on the state at time t2, and not on any previous history of the system. In its most general form, the master equation is written
dPn dt =
X
n0
(Wn0npn0−Wnn0pn), (1.7)
transla-0
5
10
15
20
25
30
35
40
45
mRNA copy number
0.02
0.00
0.02
0.04
0.06
0.08
0.10
0.12
0.14
Probability
[image:26.612.121.536.202.507.2]mRNA distributions from Gillespie simulations
Fast TF kinetics
Slow TF kinetics
Figure 1.7: mRNA copy number distributions for fast and slow repressor kinetics. Gille-spie simulations were performed of the scenario depicted in Figure 1.5b, and the resulting steady-state mRNA distributions were computed from the results of the simulations. For slow TF kinetics,
kR
on = kRof f = 1; for fast kinetics, konR = kRof f = 100; γ = 1. Both distributions have the same
r
r
γ
γ
RNAP RNAP
LacI
Promoter Promoter Promoter
Transcription rate: r
RNAP copy # RNAP affinity
O O
O
A
B
C
LacI copy #
Repressor on rate: kRon kRoff
LacI affinity
Repressor off rate:
k
Ronk
RoffFigure 1.8: Constitutive expression schematic. This schematic is a simplified version of Figure 1.5 in which the kinetics of RNAP binding, unbinding, and transcript initiation are subsumed into a single effect transcription rateras described in Equation 1.8. mRNA transcripts are degraded with probabilityγ per unit time per transcript.
tion. But at a molecular level, each individual mRNA is simply diffusing around until it encounters the appropriate enzyme or transporter to effect each of these reactions. From the perspective of an individual mRNA, the time that has passed since transcription is irrelevant to the probability of encountering the spliceosome in the next instantdt.
Equation 1.7 gives the most general form of the master equation. While dealing with gene expression, we will generally be working with a particular class of Markov processes called “birth and death processes” [64]. For this class of processes, the state of the system can only increase in increments of one: i.e., Wij = 0 if|i−j| >1. For instance, if nrefers to the number of mRNA
transcripts present in the cell, n, can increase by one via a transcription event, or can decrease by one via a degradation event. In Figure 1.8, we show a schematic of a simple birth and death model of constitutive (unregulated) transcription. mRNA transcripts are produced with constant probability per unit time at rate r, and are degraded with constant probability per mRNA per unit time at rateγ. Note that in Figure 1.8 we are no longer explicitly considering the transitions between the states in which RNAP is bound and unbound. As long as these transition rates (kP
of f andk P on) are
fast compared to the initiation rate from the closed complex kt, these pre-initiation dynamics can
be modeled without loss of accuracy using a single effective transcription rater, which is related to
kP
of f, konP andktby the following expression:
r= k
P on kP
on+kPof f
kt. (1.8)
This expression forrcan be interpreted as the fraction of time for which the promoter is bound by RNAP times the transcription ratektfrom the closed complex.
The master equation corresponding to Figure 1.8 can be written:
dp(m, t)
The first two terms of the master equation have positive signs and are concerned with transitions to the state of havingm mRNA: one could start withm−1 mRNA, and produce one (first term), or one could start withm+ 1 mRNA, and degrade one (second term). The third and fourth terms deal with transitions away fromm mRNA and hence have negative signs: one could start with m
mRNA and produce one (third term), or start with m mRNA and degrade one (fourth term). In this work we will principally be concerned with the steady state probability distribution. It can be shown (by setting the left hand side of Equation 1.9 to zero and directly substituting the following expression) that the steady-state solution to Equation 1.9 is a Poisson distribution with meanr/γ:
p(m) = (r/γ)
m m! e
−r/γ. (1.10)
For more complicated scenarios involving regulation by transcription factors, a closed form solution to the master equation will not in general be available. However, we can still make progress by calculating the various moments of the distribution analytically. For instance, to compute the steady-state mean of Equation 1.9, we set the left hand side to zero, multiply bym, and sum from
m= 0 to infinity:
0 =r
∞
X
m=0
mp(m−1) +γ
∞
X
m=0
m(m+ 1)p(m+ 1)−r
∞
X
m=0
mp(m)−γ
∞
X
m=0
m2p(m), (1.11)
0 =r
∞
X
m=0
(m+ 1)p(m) +γ
∞
X
m=0
m(m−1)p(m)− −r
∞
X
m=0
mp(m)−γ
∞
X
m=0
m2p(m), (1.12)
0 =rhmi+r+γhm2i −γhmi −γhm2i, (1.13)
γhmi=r, (1.14)
hmi= r
γ, (1.15)
where we have invoked the normalization condition that P∞
m=0p(m) = 1. A similar procedure can be carried out for all moments of the distribution. This means that, although we may not be able to obtain analytic solutions for the full probability distribution function for more complicated regulatory scenarios, we can still analytically compute useful properties of the distribution such as the noise strength (standard deviation divided by mean) and Fano factor (variance divided by mean).
“Extrinsic” variability refers to the variability resulting from the fact that each of the molecular rates depicted in Figure 1.5b is itself subject to variation due to e.g. fluctuations in repressor or RNA polymerase copy numbers. Notably, the mathematical breakdown of intrinsic vs extrinsic noise given in reference [68] relies on the assumption that extrinsic fluctuations are slower than intrinsic fluctuations which is probably true at the level of mRNA expression, but not necessarily at the protein expression level [69]. Other noteworthy experimental investigations of variability in gene expression include a 2005 experiment by Ido Golding and coworkers, in which the MS2 mRNA tagging system was used to monitor the production of mRNA molecules in essentially “real time,” allowing the authors to observe the distribution of waiting times between mRNA production events [70]. One of the more surprising results to emerge from these experiments was the observation that even in the fully induced state, the promoter still exhibited pronounced periods of inactivity, even though in principle the repressor TF should have been inactivated by the presence of the inducer molecule IPTG.
More recently, a series of publications have advanced the hypothesis that noise is “universal” in prokaryotes in the sense that the level of variability is dictated solely by the mean level of gene expression and not by the specific molecular details of promoter architecture such as transcription factor binding site locations and strengths. This hypothesis was advanced most explicitly in a 2011 paper by So et al, in which the authors measured the level of variability in mRNA copy number for a variety of E. coli promoters under a variety of induction conditions [71]. Similar results were obtained in a study by Taniguchiet al of transcription from a library of some 2000 genes inE. coli[72]. This observation of universality was extended to other microorganisms in a work by Salman
et al [73]. These experimental observations, combined with the observation from reference [70] of “burst-like” mRNA production even in the fully induced case, have led to speculation that some as-yet uncharacterized mechanism universally causesE. colipromoters to exhibit periods of activity and inactivity, regardless of transcription factor binding. One possible mechanism is derived from the fact that transcriptional silencing by nucleosomes is a well-known phenomenon in eukaryotes, and thus it seems plausible that nucleoid-associated prokaryotic proteins homologous to eukaryotic histones could be playing a similar role in prokaryotes. Later in this thesis, this question of universality will be addressed directly; I will briefly note here that our experimental results argue rather strongly against universality.
of environmental fluctuations include shifts from well-mixed to stagnant liquid growth conditions, or changes in the availability of sugars to metabolize [78, 79]. The idea is that if a small subpopu-lation of an overall popusubpopu-lation adopts a phenotype suitable for a different environmental condition, if the environment changes rapidly the subpopulation will be poised to rapidly succeed in the new environment. A key element of the bet-hedging concept is incomplete information about the envi-ronment. With perfect knowledge of environmental conditions, bet-hedging would be suboptimal, as the best strategy would be to deterministically adopt the the phenotype most suited to environ-mental conditions. However, if conditions change unpredictably, or if acquiring information about the environment is too costly, then bet-hedging can make sense.
As discussed above, theoretical efforts to characterize stochasticity in gene expression have cen-tered around solving the chemical master equation. The majority of this work has been done starting around the year 2000, reflecting the fact that it is only relatively recently that single-cell techniques have allowed noise in gene expression to be characterized at the experimental level. In the early 2000s, theorists calculated the gene expression probability distributions resulting from “bursty” gene expression [80, 81]. This corresponds to the scenario illustrated in Figure 1.5b in the limit that the periods of active gene expression are short compared to the lifetime of an mRNA. In that case, it is appropriate to model the transcripts as being produced essentially all at once. The resulting distribution is a gamma distribution (or equivalently its discrete counterpart, the negative binomial distribution), and is characterized by having a longer tail in the positive direction than a Poisson distribution. Later, Raj and coworkers found an analytic expression for the resulting probability distribution for the general case (i.e., the length of active period is not necessarily short compared with the mRNA lifetime) [82, 83]. In work published in 2008, and also in Chapter 5 of this thesis (published in 2010 in PLoS Computational Biology), Sanchezet al systematized and extended these efforts to compute the variability for a variety of promoter architectures, much as Bintu et al had previously done for mean gene expression using thermodynamic models [36, 54]. Notably, these the-oretical efforts yield predictions for relationships between noise and mean expression that distinctly depend on the details of promoter architecture, in contrast with some experimental results described above.
in gene expression for information processing and signal transduction. The basic idea here is that the concentration(s) of various transcription factor(s) encode some information about the environment. In the process of converting from transcription factor concentrations (the input) to gene expression level (the output), some information is inevitably lost due to noise in gene expression. These efforts have sought to characterize how information is integrated and transduced by regulatory DNA, and to examine the flow of information through genetic regulatory networks [89–92]. Finally, the effect of the partitioning of proteins between daughter cells at cell division on cell-to-cell variability in protein copy numbers has been examined. The authors concluded that in many cases, the variability due to cell partitioning can be as important or more than the variability due to transcription [93], highlighting the need to exercise caution in interpreting the results of gene expression variability measurements.
The remainder of this thesis can be briefly summarized as follows. InChapter 1, we employ the thermodynamic modeling framework in the regulatory context of the wild-typelac operon. We use models of the sequence-dependent binding energies of the relevant proteins (CRP, LacI, and RNAP) to directly construct a genotype to phenotype map for the level of repression exhibited by the lac
promoter. In Chapter 2, we examine how a model of the sequence-dependent binding energy of RNAP can be used in conjunction with a thermodynamic model of gene expression to design pro-moter to yield targeted levels of gene expression, in the regulatory contexts of constitutive expression and simple repression.InChapter 3, we introduce a high-throughput promoter mutagenesis assay called Sort-Seq and use it to explore the transcriptional regulation of the mechanosensitive chan-nel of large conductance, whose transcriptional regulation had previously been almost completely uncharacterized. InChapter 4, we introduce a theoretical modeling framework for predicting the level of cell-to-cell variability in gene expression as a function of the promoter architecture, and use this framework to explore the noise properties of a number of common E. coli regulatory motifs. Finally, inChapter 5, we use mRNA FISH to test these theoretical predictions, and find that the noise does distinctly depend on the promoter architectures in play.
Bibliography
[1] Oswald T. Avery, Colin M. MacLeod, and Maclyn McCarty. Studies on the chemical nature of the substance inducing transformation of pneumococcal types: Induction of transformation by a desoxyribonucleic acid fraction isolated from pneumococcus type iii. The Journal of Experimental Medicine, 79(2):137–158, 1944.
[3] D. Elson and E. Chargaff. On the desoxyribonucleic acid content of sea urchin gametes. Expe-rientia, 8(4):143–145, 1952.
[4] J. D. Watson and F. H. C. Crick. Molecular structure of nucleic acids. Nature, 171:737–738, 1953.
[5] F. H. C. Crick, Leslie Barnett, S. Brenner, and R. J. Watts-Tobin. General nature of the genetic code for proteins. Nature, 192(4809):1227–1232, Dec 1961.
[6] H. Bremer and P. P. Dennis. Modulation of chemical composition and other parameters of the cell by growth rate. In Frederick C. Neidhardt et al., editors,Escherichia coli and Salmonella: Cellular and Molecular Biology, pages 1553–1569. ASM Press, Washington DC, 1996.
[7] Brian J. Paul, Wilma Ross, Tamas Gaal, and Richard L. Gourse. rRNA transcription in
Escherichia coli. Annual Review of Genetics, 38(1):749–770, 2004. PMID: 15568992.
[8] Matthew Scott, Eduard M Mateescu, Zhongge Zhang, and Terence Hwa. Interdependence of cell growth and gene expression: Origins and consequences. Science, 330(November), 2010. [9] L Perfeito, S Ghozzi, Johannes Berg, Karin Schnetz, and M L¨assig. Nonlinear fitness landscape
of a molecular pathway. PLoS genetics, 7(7):1–10, 2011.
[10] E. Dekel and U. Alon. Optimality and evolutionary tuning of the expression level of a protein.
Nature, 436(7050):588–92, 2005.
[11] Jeffery Errington. Bacillus subtilis sporulation: Regulation of gene expression and control of morphogenesis. Microbiological Reviews, 57(1), March 1993.
[12] Heladia Salgado, Martin Peralta-Gil, Socorro Gama-Castro, Alberto Santos-Zavaleta, Luis Muiz-Rascado, Jair S. Garca-Sotelo, Verena Weiss, Hilda Solano-Lira, Irma Martnez-Flores, Alejandra Medina-Rivera, Gerardo Salgado-Osorio, Shirley Alquicira-Hernndez, Kevin Alquicira-Hernndez, Alejandra Lpez-Fuentes, Liliana Porrn-Sotelo, Araceli M. Huerta, Csar Bonavides-Martnez, Yalbi I. Balderas-Martnez, Lucia Pannier, Maricela Olvera, Aurora Labastida, Vernica Jimnez-Jacinto, Leticia Vega-Alvarado, Victor del Moral-Chvez, Alfredo Hernndez-Alvarez, Enrique Morett, and Julio Collado-Vides. Regulondb v8.0: Omics data sets, evolutionary conservation, regulatory phrases, cross-validated gold standards and more.Nucleic Acids Research, 41(D1):D203–D213, 2013.
[14] Guo-Cheng Yuan, Yuen-Jong Liu, Michael F. Dion, Michael D. Slack, Lani F. Wu, Steven J. Altschuler, and Oliver J. Rando. Genome-scale identification of nucleosome positions in S. cerevisiae. Science, 309(5734):626–630, 2005.
[15] Felix H. Lam, David J. Steger, and Erin K. O/’Shea. Chromatin decouples promoter threshold from dynamic range. Nature, 453(7192):246–250, May 2008.
[16] E. Segal and J. Widom. From DNA sequence to transcriptional behaviour: A quantitative approach. Nat Rev Genet, 10(7):443–56, 2009.
[17] M. S. Luijsterburg, M. C. Noom, G. J. Wuite, and R. T. Dame. The architectural role of nucleoid-associated proteins in the organization of bacterial chromatin: A molecular perspective.
J Struct Biol, 2006.
[18] Wenqin Wang, Gene-Wei Li, Chongyi Chen, X. Sunney Xie, and Xiaowei Zhuang. Chromosome organization by a nucleoid-associated protein in live bacteria. Science, 333(6048):1445–1449, 2011.
[19] Charles J Dorman. H-NS: A universal regulator for a dynamic genome. Nature Reviews Micro-biology, 2(5):391–400, 2004.
[20] Ferric C Fang and Sylvie Rimsky. New insights into transcriptional regulation by h-ns.Current Opinion in Microbiology, 11(2):113 – 120, 2008. Cell Regulation.
[21] H. M. Lim, D. E. Lewis, H. J. Lee, M. Liu, and S. Adhya. Effect of varying the supercoiling of DNA on transcription and its regulation. Biochemistry, 42(36):10718–25, 2003.
[22] A. Travers and G. Muskhelishvili. DNA supercoiling - a global transcriptional regulator for enterobacterial growth? Nat Rev Microbiol, 3(2):157–69, 2005.
[23] H. M. Salis, E. A. Mirsky, and C. A. Voigt. Automated design of synthetic ribosome binding sites to control protein expression. Nat Biotechnol, 27(10):946–50, 2009.
[24] I. Chen and D. Dubnau. DNA uptake during bacterial transformation. Nat Rev Microbiol, 2(3):241–9, 2004.
[25] Susan Gottesman and Gisela Storz. Bacterial small RNA regulators: Versatile roles and rapidly evolving variations. Cold Spring Harbor Perspectives in Biology, 3(12):a003798, 2011.
[26] Susan Gottesman. The small rna regulators ofEscherichia coli: roles and mechanisms. Annu. Rev. Microbiol., 58:303–328, 2004.
[28] Karen L. Maxwell, David Wildes, Arash Zarrine-Afsar, Miguel A. De Los Rios, Andrew G. Brown, Claire T. Friel, Linda Hedberg, Jia-Cherng Horng, Diane Bona, Erik J. Miller, Alexis Valle-Blisle, Ewan R.G. Main, Francesco Bemporad, Linlin Qiu, Kaare Teilum, Ngoc-Diep Vu, Aled M. Edwards, Ingo Ruczinski, Flemming M. Poulsen, Birthe B. Kragelund, Stephen W. Michnick, Fabrizio Chiti, Yawen Bai, Stephen J. Hagen, Luis Serrano, Mikael Oliveberg, Daniel P. Raleigh, Pernilla Wittung-Stafshede, Sheena E. Radford, Sophie E. Jackson, Tobin R. Sosnick, Susan Marqusee, Alan R. Davidson, and Kevin W. Plaxco. Protein folding: Defining a standard set of experimental conditions and a preliminary kinetic data set of two-state proteins.
Protein Science, 14(3):602–616, 2005.
[29] E. Levine, Z. Zhang, T. Kuhlman, and T. Hwa. Quantitative characteristics of gene regulation by small RNA. PLoS Biol, 5(9):e229, 2007.
[30] Yishai Shimoni, Gilgi Friedlander, Guy Hetzroni, Gali Niv, Shoshy Altuvia, Ofer Biham, and Hanah Margalit. Regulation of gene expression by small non-coding RNAs: A quantitative view. Molecular systems biology, 3(138):138, January 2007.
[31] M R Parsek and E P Greenberg. Acyl-homoserine lactone quorum sensing in gram-negative bacteria: A signaling mechanism involved in associations with higher organisms. Proceedings of the National Academy of Sciences of the United States of America, 97(16):8789–93, August 2000.
[32] Michael E Hibbing, Clay Fuqua, Matthew R Parsek, and S Brook Peterson. Bacterial competi-tion: surviving and thriving in the microbial jungle. Nature Reviews Microbiology, 8(1):15–25, January 2010.
[33] Marcus Miethke and Mohamed a Marahiel. Siderophore-based iron acquisition and pathogen control. Microbiology and Molecular Biology Reviews, 71(3):413–51, September 2007.
[34] Mattias Rydenfelt. The Combinatorics of Transcriptional Regulation. PhD thesis, California Institute of Technology, 2014.
[35] H. G. Garcia, A. Sanchez, T. Kuhlman, J. Kondev, and R. Phillips. Transcription by the numbers redux: Experiments and calculations that surprise. Trends Cell Biol, 2010.
[36] A. Sanchez, H. G. Garcia, D. Jones, R. Phillips, and J. Kondev. Effect of promoter architecture on the cell-to-cell variability in gene expression. PLoS Computational Biology, 7(3):e1001100, 2011.
[38] Axel Cournac and Jacqueline Plumbridge. DNA looping in prokaryotes: Experimental and theoretical approaches. Journal of Bacteriology, 195(6):1109–1119, 2013.
[39] RB Lobell and RF Schleif. DNA looping and unlooping by AraC protein. Science, 250(4980):528–532, 1990.
[40] D. K. Hawley and W. R. McClure. Mechanism of activation of transcription initiation from the lambda PRM promoter. J Mol Biol, 157(3):493–525, 1982.
[41] Virgil A Rhodius, David M West, Christine L Webster, Stephen J W Busby, and Nigel J Savery. Transcription activation at Class II CRP-dependent promoters : The role of different activating regions. Nucleic Acids Research, 25(2):326–332, 1997.
[42] W Niu, Y Kim, G Tau, T Heyduk, and R H Ebright. Transcription activation at class II CAP-dependent promoters: Two interactions between CAP and RNA polymerase. Cell, 87(6):1123– 34, December 1996.
[43] D. F. Browning and S. J. Busby. The regulation of bacterial transcription initiation. Nat Rev Microbiol, 2(1):57–65, 2004.
[44] T. H. Lee and N. Maheshri. A regulatory role for repeated decoy transcription factor binding sites in target gene expression. Mol. Syst. Biol., 8:576, 2012.
[45] S. L. Dove and A. Hochschild. Use of artificial activators to define a role for protein-protein and protein-DNA contacts in transcriptional activation. Cold Spring Harb Symp Quant Biol, 63:173–80, 1998.
[46] SL Dove and Ann Hochschild. Conversion of theω subunit of Escherichia coli RNA polymerase into a transcriptional activator or an activation target. Genes & development, pages 745–754, 1998.
[47] Angela Caramel and Karin Schnetz. Lac andλrepressors relieve silencing of the Escherichia coli bgl promoter. activation by alteration of a repressing nucleoprotein complex. Journal of molecular biology, 284(4):875–883, 1998.
[48] Rob Phillips, Jane Kondev, Julie Theriot, and Hernan Garcia. Physical Biology of the Cell. Garland Science, New York, 2 edition, 2012. Illustrated by Nigel Orme; with problems, solutions, and editorial assistance of Hernan G. Garcia.
[49] G. K. Ackers, A. D. Johnson, and M. A. Shea. Quantitative model for gene regulation by lambda phage repressor. Proc Natl Acad Sci U S A, 79(4):1129–33, 1982.
[51] G. R. Bellomy, M. C. Mossing, and M. T. Record, Jr. Physical properties of DNA in vivo as probed by the length dependence of the lac operator looping process.Biochemistry, 27(11):3900– 6, 1988.
[52] T. Kuhlman, Z. Zhang, Jr. Saier, M. H., and T. Hwa. Combinatorial transcriptional control of the lactose operon ofEscherichia coli. Proceedings of the National Academy of Sciences of the United States of America, 104(14):6043–8, 2007.
[53] M Razo-Mejia, J Q Boedicker, D Jones, A DeLuna, J B Kinney, and R Phillips. Comparison of the theoretical and real-world evolutionary potential of a genetic circuit. Physical Biology, 11(2):026005, 2014.
[54] L. Bintu, N. E. Buchler, H. G. Garcia, U. Gerland, T. Hwa, J. Kondev, and R. Phillips. Transcriptional regulation by the numbers: Models.Curr Opin Genet Dev, 15(2):116–24, 2005. [55] L. Bintu, N. E. Buchler, H. G. Garcia, U. Gerland, T. Hwa, J. Kondev, T. Kuhlman, and R. Phillips. Transcriptional regulation by the numbers: Applications. Current Opinion in Genetics and Development, 15(2):125–35, 2005.
[56] J. Gertz, E. D. Siggia, and B. A. Cohen. Analysis of combinatorial cis-regulation in synthetic and genomic promoters. Nature, 457(7226):215–8, 2009.
[57] E. Segal, T. Raveh-Sadka, M. Schroeder, U. Unnerstall, and U. Gaul. Predicting expression patterns from regulatory sequence in Drosophila segmentation.Nature, 451(7178):535–40, 2008. [58] Eran Segal, Yvonne Fondufe-Mittendorf, Lingyi Chen, AnnChristine Thastrom, Yair Field, Irene K. Moore, Ji-Ping Z. Wang, and Jonathan Widom. A genomic code for nucleosome positioning. Nature, 442(7104):772–778, Aug 2006.
[59] Ilya P. Ioshikhes, Istvan Albert, Sara J. Zanton, and B. Franklin Pugh. Nucleosome positions predicted through comparative genomics. Nat Genet, 38(10):1210–1215, Oct 2006.
[60] M. Thomas Record Jr., William S. Reznikoff, Maria L. Craig, Kristi L. McQuade, and Paula J. Schlax. Escherichia coli RNA polymerase (Eσ70), promoters, and the kinetics of the steps of transcription initiation. In Frederick C. Neidhardt et al., editors, Escherichia coli and Salmonella: Cellular and Molecular Biology, pages 1553–1569. ASM Press, Washington DC, 1996.
[61] W R McClure. Rate-limiting steps in RNA chain initiation.Proceedings of the National Academy of Sciences of the United States of America, 77(10):5634–8, October 1980.
[63] D.T. Gillespie. Exact stochastic simulation of coupled chemical reactions. Journal of Physical Chemistry, 81:2340–2361, 1977.
[64] Nicolaas Godfried Van Kampen. Stochastic Processes in Physics and Chemistry, volume 1. Elsevier, 1992.
[65] J. L. Spudich and Jr. Koshland, D. E. Non-genetic individuality: chance in the single cell.
Nature, 262(5568):467–71, 1976.
[66] Harley H McAdams and Adam Arkin. Stochastic mechanisms in gene expression. Proceedings of the National Academy of Sciences, 94(3):814–819, 1997.
[67] M. B. Elowitz, A. J. Levine, E. D. Siggia, and P. S. Swain. Stochastic gene expression in a single cell. Science, 297(5584):1183–6, 2002.
[68] P.S. Swain, M.B. Elowitz, and E.D. Siggia. Intrinsic and extrinsic contributions to stochasticity in gene expression. Proceedings of the National Academy of Sciences of the United States of America, 99:12795., 2002.
[69] Andreas Hilfinger and Johan Paulsson. Separating intrinsic from extrinsic fluctuations in dy-namic biological systems.Proceedings of the National Academy of Sciences of the United States of America, 108(29):12167–72, July 2011.
[70] I. Golding, J. Paulsson, S. M. Zawilski, and E. C. Cox. Real-time kinetics of gene activity in individual bacteria. Cell, 123(6):1025–36, 2005.
[71] L. H. So, A. Ghosh, C. Zong, L. A. Sepulveda, R. Segev, and I. Golding. General properties of transcriptional time series inEscherichia coli. Nature Genetics, 43(6):554–60, 2011.
[72] Yuichi Taniguchi, Paul J. Choi, Gene-Wei Li, Huiyi Chen, Mohan Babu, Jeremy Hearn, Andrew Emili, and X. Sunney Xie. QuantifyingE. coli proteome and transcriptome with single-molecule sensitivity in single cells. Science, 329:533, 2010.
[73] Hanna Salman, Naama Brenner, Chih-kuan Tung, Noa Elyahu, Elad Stolovicki, Lindsay Moore, Albert Libchaber, and Erez Braun. Universal protein fluctuations in populations of microor-ganisms. Physical Review Letters, 108:238105, Jun 2012.
[74] A. Eldar and M. B. Elowitz. Functional roles for noise in genetic circuits.Nature, 467(7312):167– 73, 2010.
[75] D Cohen. Optimizing reproduction in a randomly varying environment. Journal of Theoretical Biology, 12(1):119–&, 1966.
[77] BN Danforth. Emergence dynamics and bet hedging in a desert bee, Perdita portalis. Proceed-ings of the Royal Society B: Biological Sciences, 266(1432):1985–1994, OCT 7 1999.
[78] Hubertus J. E. Beaumont, Jenna Gallie, Christian Kost, Gayle C. Ferguson, and Paul B. Rainey. Experimental evolution of bet hedging. Nature, 462(7269):90–93, Nov 2009.
[79] P. J. Choi, L. Cai, K. Frieda, and X. S. Xie. A stochastic single-molecule event triggers pheno-type switching of a bacterial cell. Science, 322(5900):442–6, 2008.
[80] J Paulsson and M Ehrenberg. Random signal fluctuations can reduce random fluctuations in regulated components of chemical regulatory networks. Physical Review Letters, 84(23):5447– 50, June 2000.
[81] N. Friedman, L. Cai, and X. S. Xie. Linking stochastic dynamics to population distribution: An analytical framework of gene expression. Physical Review Letters, 97(16):–, 2006.
[82] A. Raj, C. S. Peskin, D. Tranchina, D. Y. Vargas, and S. Tyagi. Stochastic mRNA synthesis in mammalian cells. PLoS Biology, 4(10):e309, 2006.
[83] V. Shahrezaei and P. S. Swain. Analytical distributions for stochastic gene expression. Proc Natl Acad Sci U S A, 105(45):17256–61, 2008.
[84] J. M. Pedraza and A. van Oudenaarden. Noise propagation in gene networks. Science, 307(5717):1965–9, 2005.
[85] I. Lestas, G. Vinnicombe, and J. Paulsson. Fundamental limits on the suppression of molecular fluctuations. Nature, 467(7312):174–8, 2010.
[86] A Gr¨onlund, P L¨otstedt, and Johan Elf. Transcription factor binding kinetics constrain noise suppression via negative feedback. Nature Communications, (May):1–5, 2013.
[87] R. S. Cox III, M. G. Surette, and M. B. Elowitz. Programming gene expression with combina-torial promoters. Mol Syst Biol, 3:145, 2007.
[88] B. Munsky, B. Trinh, and M. Khammash. Listening to the noise: Random fluctuations reveal gene network parameters. Mol Syst Biol, 5:318, 2009.
[89] Samuel F Taylor, Naftali Tishby, and William Bialek. Information and Fitness. 2007.
[90] Gaˇsper Tkaˇcik, Curtis Callan, and William Bialek. Information capacity of genetic regulatory elements. Physical Review E, 78(1):1–17, July 2008.
[92] Aleksandra M. Walczak, Gaˇsper Tkaˇcik, and William Bialek. Optimizing information flow in small genetic networks. II. Feed-forward interactions.Physical Review E, 81(4):1–16, April 2010. [93] Dann Huh and Johan Paulsson. Non-genetic heterogeneity from stochastic partitioning at cell
Chapter 2
Comparison of the theoretical and
real-world evolutionary potential of