© 2018, IRJET | Impact Factor value: 6.171 | ISO 9001:2008 Certified Journal | Page 2517
Lung Cancer Detection using Image Processing Techniques
1
Ayushi Shukla,
2Chinmay Parab,
3Pratik Patil,
4Prof. Savita Sangam
1,2,3
Students, Department of Computer Engineering, SSJCOE Dombivli, Maharashtra, India
4Prof. Savita Sangam, Department of Computer Engineering, SSJCOE Dombivli, Maharashtra, India
---***---Abstract -
Lung tumour is by all accounts the basic reason for death among individuals all through the world. Early discovery of lung cancer can expand the possibility of survival among individuals. The survival rate for lung cancer patients increments from 14 to 49% if the illness is recognized in time. Despite the fact that Computed Tomography (CT) can be more productive than X-rays, issue appeared to converge because of time imperative in recognizing the presence of lung malignancy with respect to the few diagnosing strategy utilized. Consequently, a lung tumor identification framework utilizing image handling is utilized to arrange the presence of lung cancer in a CT images. In this investigation, MATLAB have been utilized through each technique made. In our project process like image pre-processing, segmentation, feature extraction and image classification has been examined in detail. We are planning to get the more exact outcomes by making a new system.Key Words
:
Segmentation, OTSU Thresholding, Watershed,SVM, CT Scan Image.
1. INTRODUCTION
The death rate of lung disease is the most noteworthy among every other kind of growth. Lung tumour is a standout amongst the most genuine cancers on the planet, with minimal survival rate after the analysis, with a progressive increment in the number of deceased people. Individuals do have a higher shot of survival if the disease can be detected in the early stages. Lung cancer can be divided into two fundamental groups, non-small cell lung cancer and small cell lung cancer. These groups have been classified with respect to their cellular characteristics. With respect to the stages, there are four phases of lung cancer; I to IV. Arranging depends on tumour size and tumour lymph node location. CT scan is said to be more compelling than plain chest x-rays in identifying and diagnosing the lung cancer. Earlier the detection, more is the survival rate of the patient. About 85% male and 75% females are suffering from lung cancer due to cigarette smoking. The general survival rate of people suffering from lung cancer is 63%. In spite of the fact that surgery, radiation treatment, and chemotherapy have been utilized as a part of the treatment of lung tumour, the five-year survival rate for all stages consolidated is just 14%. This has not changed in the previous three decades. The motivation behind this paper is to locate the beginning phase of lung cancer with high precision.
2. LITERATURE SURVEY
2.1 Image Pre-processing
Image pre-processing is done to enhance some image features important for further processing and remove noise factor if present in image. Filtering is an important step in image pre-processing. Various filtering techniques are averaging filters, median filtering and Morphological filtering.
2.2 Image Segmentation
Image segmentation is the process in which a digital image is divided into multiple segments. Image segmentation process involve operations like thresholding, edge detection, watershed transform.
2.2.1 Thresholding
In image Thresholding, an image is separated into a foreground and background. It is mainly done to convert images into binary images. Thresholding can be global thresholding or local thresholding. In global thresholding same threshold value is used for all regions while in local thresholding different threshold values are used for different region in an image. Various thresholding techniques are Histogram Thresholding, Otsu thresholding, Fast marching method.
2.2.2 Edge Detection
Edge detection is an image processing technique to find the boundaries of objects within images. It works by detecting discontinuities in brightness. Edge detection is used for image segmentation in various fields such as image processing, computer vision, and machine vision. Common edge detection algorithms include Sobel, Canny, Prewitt, Roberts, and fuzzy logic methods
2.3 Feature Extraction
© 2018, IRJET | Impact Factor value: 6.171 | ISO 9001:2008 Certified Journal | Page 2518 2.5 Classification
Various techniques for classification of tumor are Decision tree, Support Vector Machine etc.
[image:2.595.85.238.155.367.2]3. METHODOLOGY
Fig – 1 : Flow Chart
3.1 Pre-processing
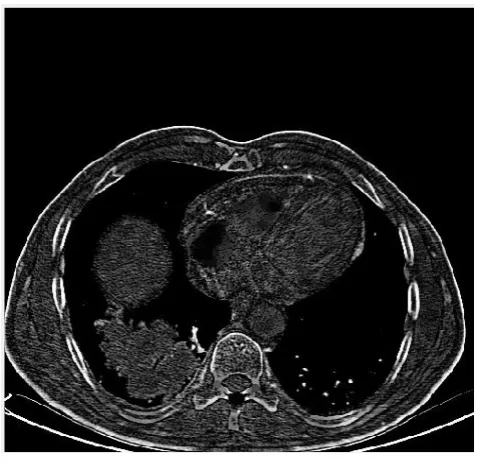
In pre-processing, the input CT image is being processed to improve the quality of image. In this some operations are performed on image in which certain details and data of image is enhanced. This enhanced version will contribute in further steps of any robotized system. So, it is beneficial to do some operations of pre-processing.
Fig – 2 : CT Scan Input Image
3.1.1 Filtering
Tophat transform is filtering technique in morphology and image processing. In Tophat transform operation small details and elements are extracted from image according to requirements. Tophat filtering works by computing morphological openings of image and then subtracting the result from original image.
imtophat() function present in MATLAB can be used for filtering.
Syntax:
se = strel('disk',r)
J=imtophat(I,SE)
[image:2.595.315.556.311.545.2]Filtered image J is returned where SE is structuring element object returned by strel function.
Fig – 3 : Filtered Image
3.2 Image Segmentation
Image segmentation is the process in which a digital image is partitioned into multiple segments.in case of images segments corresponds to pixels or super pixels. Segmentation is done is to make the representation of an image into more simplified way or something that is more meaningful and easier to analyze.
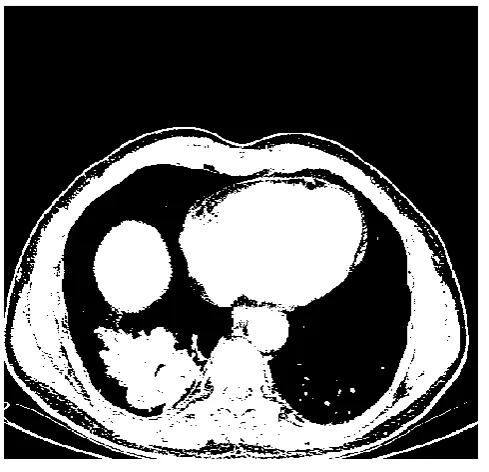
3.2.1 Thresholding
[image:2.595.36.289.491.739.2]© 2018, IRJET | Impact Factor value: 6.171 | ISO 9001:2008 Certified Journal | Page 2519 computes the optimum threshold value which separates the
two classes. It works by storing intensities of pixels in array. Total mean and variances used to calculate threshold value.
In MATLAB, graythresh() function is used to perform Otsu Thresholding.
Syntax :
level = graythresh(K);
Above line will create a threshold value which is stored in level.
img = im2bw(I,level);
[image:3.595.309.551.267.492.2]level is passed to im2bw() function which converts the image into binary.
Fig 4 :
Thresholding
3.2.2 Edge Detection
Sobel filter is used for calculating gradient for edge detection. In MATLAB fspecial(‘Sobel’)is used for sobel filtering.
Syntax :
H=fspecial(‘Sobel’)
This function returns a 3-by-3 filter h that highlights horizontal edges using the smoothing effect by approximating a vertical gradient value. To highlight vertical edges, the filter h' is transposed.
[ 1 2 1
0 0 0
-1 -2 -1 ]
3.2.3 Watershed Transform
Watershed is a transformation defined on a grayscale or binary image. The watershed transform works by finding the "catchment basins" or "watershed ridge lines" in an image. It treats it as a surface where light pixels correspond high elevations and dark pixels correspond low elevations.
Syntax:
L = watershed(A);
[image:3.595.34.279.287.523.2]This function returns a label matrix L that defines the watershed regions of the input matrix A passed to it.
Fig - 5 : Watershed Transformed Image
3.3 Feature Extraction
The features that are considered to be extracted in project are as follows: -
1) Perimeter: It is a scalar value that gives the actual number of the outline of the nodule pixel. It is obtained by the summation of the interconnected outline of the registered pixel in the binary image.
2) Area: It is a scalar value that gives the actual number of overall nodule pixel. It is obtained by the summation of areas of pixel in the image that is registered as 1 in the binary image obtained.
© 2018, IRJET | Impact Factor value: 6.171 | ISO 9001:2008 Certified Journal | Page 2520 3.3.1 Grey-Level Co-Occurrence Matrix
A statistical mathematical method of examining feature texture that considers the spatial relationship of pixels in an image is the grey-level co-occurrence matrix (GLCM), also known as the grey-level spatial dependence matrix. The GLCM functions works by finding the texture of an specific image by calculating how frequently pairs of pixel with specific intensity values and in a specified spatial relationship occur in an image, creating a GLCM, and then extracting statistical information from this matrix.
Graycomatrix is a function used in MATLAB for feature extraction.
Syntax:
glcms = graycomatrix(I,Name,Value,...)
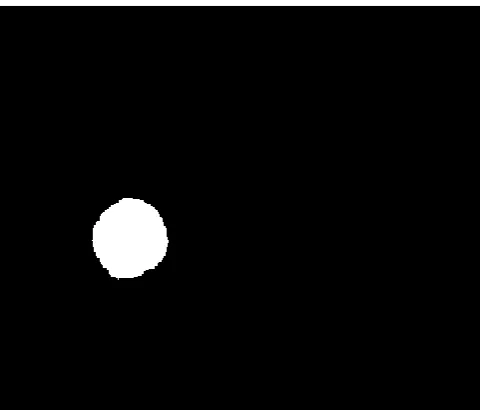
[image:4.595.36.279.324.529.2]Above function creates a gray-level co-occurrence matrix (GLCM) from image I.
Fig – 6 : Extracted Image
3.4 Classification
SVM stands for Support Vector Machine which is an advanced supervised machine learning algorithm which can be used for both regression challenges and classification purposes. In most of the cases it is used in problems were classification is needed. In this machine learning algorithm, data items are plot as a point in m-dimensional space (where m is number of different features you have) were the value of each feature being the value of a particular coordinate axes. Then, once we find the hyper plane that differentiate the two classes very well then we can easily perform classification using the hyper-plane.
Syntax:
SVMStruct = svmtrain(Training,Group)
svmtrain(Training,Group) returns a structure that is stored and further used to classify, SVMStruct, containing information about the trained support vector machine (SVM) classifier. Here training is a Matrix of training data, where each of the rows corresponds to a perticular observation or replicate, and each column corresponds to one of the various feature or variable. Svmtrain is a function that treats NaNs or empty character vectors in Training as missing values and ignores the corresponding rows of Group and Group is Grouping variable, which can be a logical, numeric, or categorical vector. character vectors forming an array cell, or a character matrix were each row representing a class label.
Group = svmclassify(SVMStruct,Sample)
This function classifies each row of the data in Sample, a matrix of data, using the information stored in a support vector machine classifier structure SVMStruct, this is the same information gathered by the svmtrain function in the earlier stage. Same as the training data used to create SVMStruct, Sample is a matrix where each row corresponds to one of the many observation or replicate, and each column corresponds to a perticular feature or variable. Therefore, the number of column and number of training data in the Sample is same. we can say this because the number of feature is equal to number of columns. Group in this situation indicates particular group to which each row of the Sample needs to been assigned.
4. CONCLUSION
Cancer is potentially fatal disease. Detecting cancer is still challenging for the doctors in the field of medicine. Even now the actual reason and complete cure of cancer is not invented. Detection of cancer in earlier stage is curable. In this work we have developed a system called image processing-based cancer prediction system. The main aim of this model is to provide the earlier warning to the users and it is also cost and time saving benefit to the user.
© 2018, IRJET | Impact Factor value: 6.171 | ISO 9001:2008 Certified Journal | Page 2521
ACKNOWLEDGMENT
No projects are completed without the guidance of experts, who have already traded this field before and hence have become the masters of it and as a result, our leaders. So, we would like to take this opportunity to take all those individuals in to account who have helped us in visualizing this project.
We express our deepest gratitude to our project guide Prof. Savita Sangam for providing timely assistance to our queries.
We also extend our sincere appreciation to all our professors from SHIVAJIRAO S. JONDHALE. COLLEGE OF ENGINEERING for their valuable insights and suggestions during the designing of the project. Their contribution have been valuable in many ways that we find it difficult to acknowledge them all.
We also are grateful to our principal Dr. J.W. BAKAL and our HOD Prof. P.R. RODGE for extending their help directly and indirectly through various channels during our project work.
REFERENCES
[1] Nisar Ahmed Memon, Anwar Majid Mirza, and S.A.M. Gilani, “Segmentation of Lungs from CT Scan Images for Early Diagnosis of Lung Cancer”, World Academy of Science, Engineering and Technology 20 2006
[2] M.Gomathi, Dr.P.Thangaraj, “A Computer Aided Diagnosis System For Detection Of Lung Cancer Nodules Using Extreme Learning Machine”, International Journal of Engineering Science and Technology Vol. 2(10), 2010
[3] Binsheng Zhao, Gordon Gamsu, Michelle S. Ginsberg, Li Jiang,Lawrence H. Schwartz, “Automatic detection of small lung nodules on CT utilizing a local density maximum algorithm”, Journal of Applied Clinical Medical Physics, Volume 4, NUMBER 3, Summer 2003
[4] Disha Sharma, Gagandeep Jindal, “Computer Aided Diagnosis System for Detection of Lung Cancer in CT Scan Images”, International Journal of Computer and Electrical Engineering, Vol. 3, No. 5, October 2011
[5] P. Bountris, E. Farantatos, and N. Apostolou, “Advanced Image Analysis Tools Development for the Early Stage Bronchial Cancer Detection”, World Academy of Science, Engineering and Technology 9 2005
[6] Zhi-Hua Zhou, Yuan Jiang, Yu-Bin Yang, Shi-Fu Chen, “Lung Cancer Cell Identification Based on Artificial Neural Network Ensembles”, Artificial Ingelligence in Medicine, 2002, vol.24, no.1, pp.25-36.