HIGH PERFORMANCE GAMELAN ANALYZER USING
ADAPTIVE WAVEFORM PATTERN MATCHING
1
YOYON K. SUPRAPTO, 2VINCENTIUS E. PRADHANA
1,2.
Electrical Engineering Department, Institut Teknologi Sepuluh Nopember, Surabaya, Indonesia.
E-mail: [email protected] , [email protected]
ABSTRACT
Exploration of the eastern music such as gamelan is very rare, so its development is far lagged to western music. Estimation of fundamental frequencies and estimation of the envelope are needed to determine the performance of traditional music instrument. We applied Waveform Adaptive Pattern Matching (WAPM) to estimate fundamental frequency which is detected with limited frequency band.The fundamental frequency is estimated by very short recorded gamelan music signal of 45 ms, with accuracy of 0.25 Hz. Besides the fundamental frequency estimation, the invention is useful gamelan tuning the signal envelope.
This method is implemented in Android applications to analyze a signal gamelan, thus enhance the portability of the application.
Keywords: Gamelan Music, Fundamental Frequency, Waveform Adaptive Pattern Matching, Minimum Absolute Error, Android.
1. INTRODUCTION
[image:1.595.331.480.430.546.2]Gamelan music instrument as a traditional music of Indonesia is a music instrument that is need to be preserved in its existence as one of the national’s heritage. Fundamental frequency estimation of a sound signal, can be done by using tuner, or well-known as an electronic tuner. Gamelan music instrument are using pelog (hexatonic) and slendro (pentatonic) scales [1]. There is no electronic tuner that is based on those two music scale. Some researchers are trying to find the similarities of pelog-slendro scales and diatonic scales as listed in Table 1 and Table 2 [2].
TABLE 1 Similarity Of Pelog And Diatonic Scales
Pelog Scale
Frequency (Hz)
Diatonic Scale
1 599 D#-23
2 638 E-20
3 698 F+10
4 798 G+16
5 830 G#+35
6 924 A'+44
7 1008 B'+24
The development of gamelan music is very rarely done by researchers and musician. This lack of development has left gamelan music behind with western music. By doing development in the field of gamelan music will hopefully catch up gamelan
music with western music. Furthermore, the development is done to restore the greatness of gamelan music as in his era (17-18th century) [3].
TABLE 2 SIMILARITY OF SLENDRO AND DIATONIC SCALES
Slendro Scale
Frequency (Hz)
Diatonic Scale
1 530 C+4
2 608 D#-7
3 698 F-20
5 804 G+11
6 924 A#'-4
1' 1056 C'+5
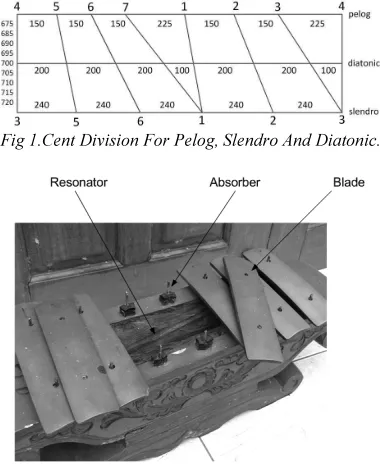
Sindusawarno, an expertise in gamelan, had also conducting research about similarity of Pelog-Slendro scales and Diatonic scale. Furthermore, he was also conducting research about cents division of gamelan [1], as shown in Fig. 1. This cents division can also be applied as standardization reference in manufacturing gamelan.
The construction of a gamelan equipment can be seen in Fig. 2. When the blades hit it will produce a sound source, the absorber is applied as silencers and resonator acts as echo maker.
[image:1.595.116.261.545.678.2]Fig 1.Cent Division For Pelog, Slendro And Diatonic.
Fig 2. Construction Of A Gamelan Equipment.
The characteristic of gamelan is that one instrument in a gamelan instrument represents one octave. Octave that is located below or above the instrument is possessed by the other. Example: Saron instrument has its own specific frequency characteristics. One octave above Saron, contained in the Peking instrument, while an octave below the Saron contained in the Demung instrument.
Each gamelan is made with various manufacturing method, depending on the manufacturer. Gamelan is manufactured manually, which is worked by a craftsman. A gamelan, from one craftsman to another craftman can be very different. It is because there is no standardization in manufacturing gamelan instrument. Craftsmen, in manufacturing gamelan, is greatly rely on the hearing sensitivity of gamelan’s craftsmen themselves, while the hearing sensitivity of each gamelan craftsmen may different from one to another.
The minimum, maximum and average fundamental frequency can be seen on Table 3 and Table 4, they can be seen that from 25 on the different set of gamelan, suggesting that the characteristics of gamelan on the market can be very different from one gamelan to another.
Hence, we introduce a Waveform Adaptive Pattern Matching method. This method is to perform cross production on the observe signal and the reference signal. Observe signal in the form of a sound signal, and then compared the similarity with the reference signal. Reference signal is a signal
generated automatically with parameters, such as frequency, amplitude, phase and the length signal. Those reference signal parameters are varied so that the shape is similar to the input signal.
Table 3 Maximum, Minimum And Average Value Of The Pelog Fundamental Frequency On Several Gamelan
Instruments Demung, Saron And Peking
Table 4 Maximum, Minimum And Average Value Of The Slendro Fundamental Frequency On Several Gamelan
Instruments Demung, Saron And Peking
By using only a few numbers of samples, we can estimate the fundamental frequency. By using
Instrument Fundamental Frequency (Hz)
Name Pelog Notation
1 2 3 4 5 6
Demung AVG 299 321 349 410 440 470
MIN 294 316 344 404 435 464
MAX 300 323 352 412 442 472
Saron AVG 597 646 697 822 887 944
MIN 590 637 688 815 867 935
MAX 608 655 706 827 908 953
Peking AVG 1205 1301 1411 1645 1774 1899
MIN 1189 1276 1390 1595 1739 1868
MAX 1224 1320 1431 1658 1839 1951
Instrument Fundamental Frequency (Hz)
Name Slendro Notation
1 2 3 5 6
Demung AVG 268 307 354 406 465
MIN 264 303 352 403 463
MAX 271 311 356 410 467
Saron AVG 534 610 704 805 925
MIN 515 589 681 775 897
MAX 544 621 716 820 943
Peking AVG 1065 1219 1397 1618 1863
MIN 1038 1195 1363 1594 1851
Saron Slendro, for resolution of 1 Hz, samples of 45 ms (2000 samples) are required. For resolution of 0.25 Hz, samples of 204 ms (9000 samples) are required.
The proposed Waveform Adaptive Pattern Matching is implemented in software that can be operated in Android. The program can be used to analyse the gamelan sound signals, for the purpose of tuning for the manufacture of gamelan music instrument itself. By implementing on Android, we could invent a portable electric tuner for gamelan. Besides the fundamental frequency estimation, the invention is useful gamelan tuning the signal envelope. It is very usefull for gamelan craftments to create better gamelan.
The paper is organized as follows. Part II discusses the related works Fourier Transform. Section III discusses the proposed method, including the algorithm of the proposed method. Section IV discusses an experiment conducted to determine the performance of the proposed method, including the comparison between the estimated fundamental frequency Fourier Transform method and the proposed method. Section V concludes the paper.
2. RELATEDWORKS
2.1 Fourier Transform
In simple terms, Fourier Transform changing waves (sound, images, etc.) from the time domain to the frequency domain. The results of this method, forms the Fourier Transform frequency spectrum. The results of the Fourier Transform can be restored to the original signals by the reversal process (inverse) [4-7].
DFT, also known as the Discrete Fourier [7], the Fourier Transform is performed on a discrete signal. DFT signal processing series of discrete values, then each discrete signal is calculated using the Fourier Transform to produce real and imaginary components. DFT itself can be formulated as shown in Eq. (1) and (2)
DFT Equation :
(1)
The is formulated as Eq. (2) :
(2)
Where is length of the window, : value of sequence position
In order to speed up the process of calculating the DFT, the algorithm in FFT (Fast Fourier Transform) is introduced. One commonly used FFT algorithm, introduced by Cooley and Tukey. Cooley-Tukey algorithm for the FFT is done by decomposing Fourier Transform or breaks the process down into smaller, then combine them into a total transformation [6].
The method used in popular electronic tuner is the FFT[4]. Another method that can be used is the FFT by combining with BPF created with Hamming Window, to eliminate noise [5]. However FFT has disadvantages in terms of frequency resolution and the number of samples of the signal.
Frequency resolution, is the resolution of fundamental frequency estimation. Suppose that the system has a frequency resolution of 2 Hz, the system can discriminate the signal between 4 and 6 Hz, but can not discriminate signal between 4 and 5 Hz [3]. Rf can be calculated by the Eq. (3).
(3)
where is the sampling frequency and is the sample length.
It may be said, to get a high resolution of frequency estimation by using the FFT [6,7], the high number of samples are needed as well. This is the weakness of FFT methods. To overcome the weakness of the FFT method that requires considerable amount of sample to obtain a high resolution.
2.2 Short-Time Fourier Transform (Stft)
STFT is an enhancement of Fourier Transform to detect signals that are not stationary (change of frequenct at any given time). In STFT, the signal is divided into parts (segments) is very small, where the segment is assumed to be stationary signals. The width of this segment of the specified window function used [8]. Window can be an Hanning or Gaussian [9] window. This window is then shifted from the starting point to the end point signal signal. Then the Fourier Transform is applied to the signal inside the window.
STFT is formulated as shown in Eq. (4)
Where is result of STFT, is signal that is going to be processed, is the shifted STFT window by controlling , is the Fourier Transform process to convert to the frequency domain.
The window of time w (t), which is a limitation of the STFT fixed that caused the results of time-frequency resolution remains as well. Therefore, if the window is used narrowly, the time resolution will be better, but the frequency resolution would be bad. If the window that is used is narrowed down, then the frequency resolution will be better, but the time resolution would be bad. Therefore, the results of the STFT will depend of the size of the window is used.
3. PROPOSEDMETHOD.
The block diagram of this proposed method can be shown in Fig. 3. Gamelan sound is recorded as analog signal. Therefore, in order to be further processed, it needs to be converted into a digital signal. The analog signal is sampled with a sampling frequency of 44100 Hz. The process of sampling by the Analog to Digital Converter (ADC) is controlled by a processor.
Signal is obtained, then made to estimate of the fundamental frequency and its envelope. It is necessary to compare the reference signal with the signal at the fundamental frequency estimation and shape the envelope.
Fig. 3 General schematic of Research Methodology
Reference signal as comparator against observed signal is required, either in frequency estimation or in envelope estimation.
3.1 Reference Signal Building
This sub-chapter will explain about construction of comparison envelope, which will be used in the developed application. This envelope is used to
analyze the damping characteristic of Balungan instruments (Demung, Saron, Peking)
Signal envelope depicting the outline of a signal. In other words, envelope is an imaginary line of signal waveform [11]. The envelope is constructed by absoluting signal, and then we create the border line of the signal. Envelope can also be made by sampling a few part of signal, for example by sampling the maximum value of the signal by using Eq. (5) from each N absoluted signal sample, which will produce envelope waveform on Eq. (6).
(5)
where xn is normalized signal x.
(6)
where env is envelope of the signal
This comparison envelope is constructed by observing the damping characteristic of 25 sets of gamelan. From this observation, we will get the damping model of each instrument.
The construction of comparison envelope is carried out by averaging each normalized envelope sample, n shows the instrument number of Demung, Saron and Peking and q shows set number of gamelan. Comparison envelope generation for each n instrument can be seen on Eq. (7).
(7)
where G is number of set of gamelan for each gamelan instrument, n, Demung, Saron or Peking.
After we obtain the envelope series of each instrument, then exponential regression is applied to obtain the damping model of for each n instrument of Demung, Saron and Peking. This exponential regression will produce the and that can be determined with Eq. (8) and (9)
(9)
where K is the sample length of from exponensial regression. Then, we can obtain the damping model (comparison envelope), which is shown on Eq. (10) , (11) and (12).
i. Demung :
(10)
ii. Saron :
iii.
(11)
iv.
Peking :
v.
(12)
From previous damping model, the reference signal that is used on AWPM, reference signal can be shown in Eq. (13), (14) and (15). i. Demung:
(13)
ii. Saron:
(14) ii. Peking:
(15)
where srd, srs, srp are reference signals of Demung,
Saron and Peking, is phase , f is fundamental frequency of reference signal
3.3 Onset Detection
The initial step is detecting onset. The function of detecting onset is to determine the beginning of the sound signal. Furthermore, by obtaining the
onset position, we can omit the unnecessaretection is done by detecting each value of dr record data, starts from the beginning, that is dr(i) in which i=0
until the sample length, where i is the sampled signal number. From the iteration process, if the value of dr(i), where dr(i) more than threshold thr,
this onset value is used and applied to cut the recording data.
Onset detection performed to remove portion of the signal which does not contain the sound of the gamelan. In simple terms, onset detection is done by looking at the sequence values from the initial position to the end. If magnitude of ≥ 0.03 is found, then the value of is considered as the onset (see Fig. 2). We are assuming that magnitude of below 0.03 does not contain the real signal. Signal sequence before will not be used, because they do not contain the sound of gamelan.
3.3.1 Frequency Estimation, using Adaptive Waveform Pattern Matching
The next process is to create the reference signal to estimate the frequency. The diagram of reference signal generation can be seen on Fig. 5. Reference signal (sr) as the comparator between input signal (dr) is the recorded data. This data is then compared with reference signal whose parameter is varied. The parameters that are used : frequency, phase and amplitude. For each parameter changing, the Minimum Absolute Error (MAE) will be calculated, against input signal.
A combination of reference signal that give the smallest MAE value, will be considered as parameter combination that is similar to input signal parameters. Therefore, we can said that the frequency parameter of signal input is similar to frequency parameter of signal reference. The diagram of MAE calculation can be seen on Fig. 5.
3.3.2MEAN ABSOLUTE ERROR
As the name implied, MAE is the average value of absolute error of two different datas.
On AWPM, MAE is used to measure the resemblance of observed signal dr(n) against reference signal sr(n). MAE on AWPM is shown on Eq. (16), as follows :
Signal length of dr(n) and sr(n) have to be the same. If one of the signal, either dr(n) or sr(n), have different length, then one signal have to be cut until we obtain the same length for each signal.
MAE calculation is started by determining the length (ps) of recorded signal dr. Then we will calculate the difference (h) between dr and sr. the MAE value is obtained from the division of h and
ps. After we obtain the MAE value, the system then saves the parameters that create the value of MAE. On the next iteration, if smaller MAE is produced, the existing MAE value and saved parameter is replaced with the new one. Otherwise, there are no replacement of the saved data.
4. EXPERIMENT
The experiments were conducted in two phases. The first phase, is estimating the frequency using the FFT frequency parameters. The second phase, is estimating the frequency parameter using the proposed method. Input signal is in the form of WAVE files (*. wav). Each file WAVE file has a sampling frequency of 44100 Hz. The sound of gamelan instruments used in this test are Saron Slendro, Demung Slendro and Peking Pelog. To abbreviate, using name of SaronSl , DemungSl and PekingPl.
The fundamental frequency of each WAVE file will be first estimated using FFT. FFT window length of 44100 is used to match the sampling frequency which is used in WAVE file. This is done to get the value of the frequency with an accuracy of 1 Hz, 0.5 Hz and 0.25 Hz. The results of these estimated frequencies using FFT method, is the benchmark (target) for testing frequency estimation using the proposed method.
Then we could perform the frequency estimation by using the proposed method. The experiment was conducted to determine the optimal value of the length of sample that can be used to estimate the parameters of the sound signal with a specific frequency. First, we developed an Android application (*.apk) using Android SDK (API 15), by implementing the proposed method. Then we use the application to estimate the fundamental frequency.
Gamelan sound file which we have obtained before is played through the loudspeaker. The sound that comes out from loudspeakers then recorded and analyzed to obtain the parameters. The position where the graph is relatively stable is called first minimum sample.
4.1 ADAPTIVE WAVEFORM PATTERN
MATCHING
The next process is to create the reference signal to estimate the frequency. The diagram of reference signal generation can be seen on Fig. 5. Reference signal (sr) as the comparator between input signal (dr) is the recorded data. This data is then compared with reference signal whose parameter is varied. The parameters that are used : frequency, phase and amplitude. For each parameter changing, the Minimum Absolute Error (MAE) will be calculated, against input signal.
A combination of reference signal that give the smallest MAE value, will be considered as parameter combination that is similar to input signal parameters. Therefore, we can said that the frequency parameter of signal input is similar to frequency parameter of signal reference. The diagram of MAE calculation can be seen on Fig. 5.
4.2 Mean Absolute Error
As the name implied, MAE is the average value of absolute error of two different datas.
On AWPM, MAE is used to measure the resemblance of observed signal dr(n) against reference signal sr(n). MAE on AWPM is shown on Eq. (16), as follows :
(16) where l is the sample length of dr(n) and sr(n).
Signal length of dr(n) and sr(n) have to be the same. If one of the signal, either dr(n) or sr(n), have different length, then one signal have to be cut until we obtain the same length for each signal.
MAE calculation is started by determining the length (ps) of recorded signal dr. Then we will calculate the difference (h) between dr and sr. the MAE value is obtained from the division of h and
ps. After we obtain the MAE value, the system then saves the parameters that create the value of MAE. On the next iteration, if smaller MAE is produced, the existing MAE value and saved parameter is replaced with the new one. Otherwise, there are no replacement of the saved data.
5. EXPERIMENT
proposed method. Input signal is in the form of WAVE files (*. wav). Each file WAVE file has a sampling frequency of 44100 Hz. The sound of gamelan instruments used in this test are Saron Slendro, Demung Slendro and Peking Pelog. To abbreviate, using name of SaronSl , DemungSl and PekingPl.
Fig. 5. Schematic Detail of frequency estimation
The fundamental frequency of each WAVE file will be first estimated using FFT. FFT window length of 44100 is used to match the sampling frequency which is used in WAVE file. This is done to get the value of the frequency with an accuracy of 1 Hz, 0.5 Hz and 0.25 Hz. The results of these estimated frequencies using FFT method, is the benchmark (target) for testing frequency estimation using the proposed method.
Then we could perform the frequency estimation by using the proposed method. The experiment was
conducted to determine the optimal value of the length of sample that can be used to estimate the parameters of the sound signal with a specific frequency. First, we developed an Android application (*.apk) using Android SDK (API 15), by implementing the proposed method. Then we use the application to estimate the fundamental frequency.
Gamelan sound file which we have obtained before is played through the loudspeaker. The sound that comes out from loudspeakers then recorded and analyzed to obtain the parameters. The position where the graph is relatively stable is called first minimum sample.
5.1Adaptive Waveform Pattern Matching
[image:7.595.309.490.419.539.2]AWPM method is done by comparing the recorded signal and the reference signal. Signal is formed by varying the parameters, such as : frequency, phase and amplitude. Frequency changes is done according to the type of instrument listed in Table 3 and 4. Then we determine the minimum frequency at which the MAE occurred, as shown in Fig. 6.
Fig. 6. Changes of MAE against fundamental frequency of reference signal.
[image:7.595.317.490.579.695.2]Fig. 8 Adaptive Changes in amplitude of signal reference to find a minimum of MAE.
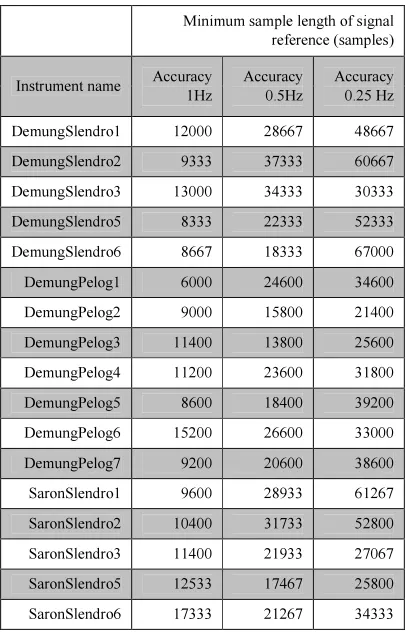
TABLE 5. MINIMUM SAMPLE LENGTH OF REFERENCE SIGNAL FOR EACH INSTRUMENT
Minimum sample length of signal reference (samples)
Instrument name Accuracy 1Hz
Accuracy 0.5Hz
Accuracy 0.25 Hz
DemungSlendro1 12000 28667 48667
DemungSlendro2 9333 37333 60667
DemungSlendro3 13000 34333 30333
DemungSlendro5 8333 22333 52333
DemungSlendro6 8667 18333 67000
DemungPelog1 6000 24600 34600
DemungPelog2 9000 15800 21400
DemungPelog3 11400 13800 25600
DemungPelog4 11200 23600 31800
DemungPelog5 8600 18400 39200
DemungPelog6 15200 26600 33000
DemungPelog7 9200 20600 38600
SaronSlendro1 9600 28933 61267
SaronSlendro2 10400 31733 52800
SaronSlendro3 11400 21933 27067
SaronSlendro5 12533 17467 25800
SaronSlendro6 17333 21267 34333
Sample length of reference signal in estimating frequency using AWPM is the minimum sample length of reference signal, so that the system can estimate range frequency parameter correctly. Minimum Sample length of each instrument can be seen on Table 5 for each resolution. If the sample length is too short, the system will unable to estimate the frequency parameter. If the sample length is too long, the system will take some time to estimate the frequency.
Fig. 9 adaptive Changes in length of reference signal to find to a minimum MAE
We are comparing 3 methods of estimating frequency, using FFT, AWPM and using gString. gString is an application to tune the musical instrument. Comparison of those methods, in accuracy of 1 Hz can be seen on Table 6.
From Table 5, it can be seen that the stable condition of estimating frequency, ranged from 2000 up to 7000. Not only stable, but also the system can estimate the frequency correctly. This condition, where the system is stable and able to estimate the frequency correctly, is called minimum sample length. This minimum sample length is different according to the accuracy and estimated frequency
To report an optimal frequency to be achieved, the system will display the results of frequency estimation through AWPM method, along with the average value of the frequency range for each instrument (Table 3 and Table 4). If the frequency value is lower / higher than the frequency range should be, then it would be recommended to thicken or thin the blade (if made of bronze), and bend or straighten the blades (if made of iron).
5.2 Envelope Analysis
To analyze the echo of the sound of gamelan instruments that are used, the envelope analysis is carried out. Envelope is made by getting maximum value out of every N sample of the absolute input signal values. Envelope result of recording process will be compared with the envelope comparison for each musical instrument. Th5.2ere will be two plots envelope images in one screen.
Algorithm:
1. Absolution the input signal value
2. Obtain the maximum signal value of N first sample
[image:8.595.88.291.293.609.2]4. Repeat step 2-3 for second N sample until last N sample.
Table 6. Comparation Among Fundamental Frequency
Fundamental frequency (Hz) with Accuracy 1Hz
Blade name
GStrings FFT AWPM
SaronSlendro1 533 533 533
SaronSlendro2 612 612 612
SaronSlendro3 700 699 699
SaronSlendro5 800 801 801
SaronSlendro6 930 930 930
DemungSlendro1 136 267 266
DemungSlendro2 307 306 306
DemungSlendro3 348 348 348
DemungSlendro5 403 403 404
DemungSlendro6 462 462 462
PekingSlendro1 1079 1079 1079
PekingSlendro2 1239 1239 1239
PekingSlendro3 1420 1420 1419
PekingSlendro5 1651 1651 1651
PekingSlendro6 1930 1931 1930
DemungPelog1 298 298 298
DemungPelog2 321 321 321
DemungPelog3 347 347 347
DemungPelog4 404 404 403
DemungPelog5 432 433 432
DemungPelog6 463 463 463
DemungPelog7 512 511 511
SaronPelog1 599 601 599
SaronPelog2 640 640 640
SaronPelog3 691 690 689
SaronPelog4 800 800 800
SaronPelog5 866 866 866
SaronPelog6 926 926 925
SaronPelog7 1010 1010 1010
PekingPelog1 1221 1223 1222
PekingPelog2 1297 1298 1299
PekingPelog3 1404 1405 1404
PekingPelog4 1653 1654 1653
PekingPelog5 85 1777 1778
PekingPelog6 1932 1932 1932
PekingPelog7 2109 2109 2109
Figure 10 is the envelope result of Demung Slendro 1 and comparison envelope. The black plot is the comparison envelope, while the gray plot is the envelope result of recorded sound.
The more sample value is being used, the smoother and shorter the envelope will be. In contrary, lesser sample value that is being used, the rougher and longer the envelope will be. In other words, higher sample value means more information loss. In this case, the number of information of signal sample which become neglected is higher. Therefore, we need to set an appropriate number of sample value in enveloping process, so that the information in a signal won’t lose too much.
[image:9.595.104.275.178.756.2]\
Fig. 10. Result Of Envelope Plot Of Demung Slendro 1 And Comparison Envelope
[image:9.595.323.488.348.613.2]method. The smallest SSE value is indicating that the predicted mathematical model is similar to real model (envelope). SSE is calculated by using Eq. (17).
(17)
Where is the predicted model of envelope,
l is the sample length of and .
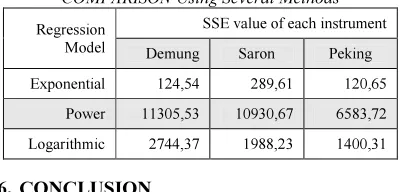
[image:10.595.89.290.335.431.2]Exponential regression is chosen because it produces smallest SSE compared to another regression model. Table 7 shows the SSE value for each different regression method. Smaller SSE indicating that the predicted mathematical model is similar to real model (envelope).
Table 7. Frequency Estimation RESULTS COMPARISON Using Several Methods
Regression Model
SSE value of each instrument
Demung Saron Peking
Exponential 124,54 289,61 120,65
Power 11305,53 10930,67 6583,72
Logarithmic 2744,37 1988,23 1400,31
6, CONCLUSION
By implementing this method, we can do the parameters estimation of the signal, simply by using a shorter sample. For example: to estimate the fundamental frequency of Saron Slendro 1, the FFT requires the sample length of 44100 (according to the WAV files used). By using proposed method, it requires only 2000 samples (+/-45 ms) for resolution of 1 Hz, and 9000 samples (+/- 204 ms) for resolution of 0.25 Hz. Moreover, this method does not need to observe the signal at the possibility of signal frequency. This method uses only a certain range, it is not necessary to observe all possible signal frequency.
The comparison envelopes for Demung, Saron and Peking, in form of exponential regression, are
as follows: Demung , Saron
: , Peking :
REFERENCES
[1] Sumarsam, “Cultural Interaction and Musical Development in Central Java,” The University
of Chicago Press, ISBN 0-226-78011-2,
1992-1995
[2] Dimas Bayu Berlianto Wibowo, ” Perancangan Kembali Taman Krida Budaya Sebagai Pusat Kreativitas Seni dan Budaya Di Kota Malang.”, Undergraduate Thesis, UIN Maulana Malik Ibrahim, 2010.
[3] Yoyon K. Suprapto, M. Hariadi and M.H. Purnomo,” Traditional Music Sound Extraction Based on Spectral Density Model using Adaptive Cross-correlation for Automatic Transcription.” IAENG International Journal of Computer Science,
38:2, IJCS_38_2_01, May 2011.
[4] Alan V. Oppenheim, Ronald W. Schafer and John R. Buck, Discrete-Time Signal
Processing, Prentice Hall, Upper Saddle
River, New Jersey, 1999.
[5] Mary Lourde R. and Anjali Kuppayil Saji, “A Digital Guitar Tuner”, (IJCSIS) International Journal of Computer Science and Information Security, Vol. 6, No. 2, 2009, pp 82-88.
[6] Lonnie C. Ludeman, Fundamentals of Digital
Signal Processing, John Wiley&Sons,
Canada, 1986.
[7] David Havelock, Sonoko Kuwano, Michael Vorlander, “Handbook of Signal Processing in Acoustics,” Springer New York, 2008.
[8] W.Wu, “Extracting Signal frequency information in time/frequency domain by means of continuous wavelet transform”,
International Conference on Control,
Automation and Systems, 2007.
[9] Douglas Eck, A Tutorial on Fourier Analysis,