International Journal of Emerging Technology and Advanced Engineering
Website: www.ijetae.com (ISSN 2250-2459, ISO 9001:2008 Certified Journal, Volume 9, Issue 11, November 2019)
27
De-Noising ECG Signals with Power Line Interference Using
Dual Tree Wavelet and Hybrid Filter
Rohan Dubey
1, Deepa Gianchandani
21Scholar, 2Professor, Department of ECE, SISTec, Bhopal, India
Abstract:-Removal of noise from Electrocardiogram is one of the recent trends in research. Electrocardiogram (ECG) is an essential biomedical tool for the diagnosis of heart related disease and disorders. This workproposesa kernel adaptive filtering techniques with DT-CWT to remove the noise from the ECG signal. The simulation of the proposed work is done using the well known simulation tool MATLAB-2012 and the analysis of the research work is done by using different performance measures such as MSE, PSNR and PRD etc. After analyzing the performance of the work it shows that our work is more efficient than existing methodology.
Keywords:-ECG; noise removal; filter. I. INTRODUCTION
The electrocardiogram formally known as ECG signal is generated by the rhythmic contractions of the heart. It corresponds to the electrical activity of the heart muscles, and is usually measured by the electrodes placed on body surface. Clinical data show that ECG signal is very effective to detect heart disease.Nowadays, cardiovascular diseases (CVDs) are the leading causes of death and disability in the world. Heart failure occurs when heart's pumping power is weaker than normal and hence movement of blood becomes slow and increases the pressure. Among several measuring devices, ECG is considered as best measuring tool for measuring arrhythmia by placing electrodes in patient’s body. ECG is the process of recording the electrical activity of the heart [1].
Development of telemedicine now allows for remote electrocardiogram (ECG) monitoring and provides information for the diagnosis and treatment of cardiovascular diseases. Specifically, remote ECG monitoring systems can improve early diagnosis accuracy of coronary disease states. Telemedicine practices have recently expanded to include qualitative and quantitative analysis of arrhythmia and evaluation of rest enosis in patients who have suffered a myocardial infarction.The ECG signal is measured by surface electrodes placed on the skin of patients. However, the signal is often corrupted by large amounts of noise from muscle artifacts (MA), electrode motion (EM), and baseline wander (BW). These noise signals may be confused with the ectopic ECG signals [2].
Hence, noisy ECG signals should be enhanced by removing the noise components for further processing such as feature extraction and pattern recognition.
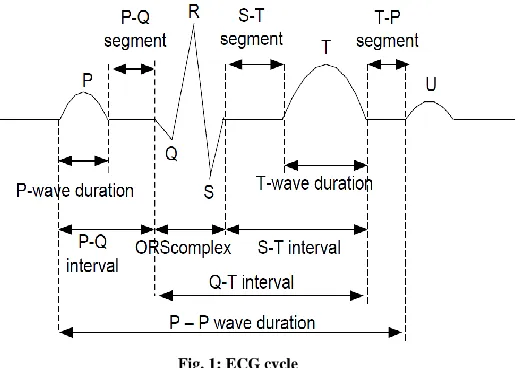
[image:1.612.325.584.285.469.2]The characterization of ECG signal is six peaks and valleys. Fig.1 shows the sample of ECG signal.
Fig. 1: ECG cycle
The atrial depolarization of electrical potential is represented by P wave. Atrial depolarization spreads from the Sino-Atrial node towards the Atrio-Ventricular node, and from the right atrium to the left atrium. Q wave result due to the ventricular depolarization to initial negative deflection and first positive deflection resulting is R wave. The first negative deflection of the ventricular depolarization is S wave that follows the first positive deflection. T-wave is generated by ventricular re-polarization. T wave is the longer duration than the QRS complex.
International Journal of Emerging Technology and Advanced Engineering
Website: www.ijetae.com (ISSN 2250-2459, ISO 9001:2008 Certified Journal, Volume 9, Issue 11, November 2019)
28
II. RELATED WORK
For elimination the noise from the ECG different author/ researchers developed different methodology among from that in this section of the paper discusses some of methods and transformations proposed previously in literature for extracting feature from ECG.
In year 2016, Vijayakumariet. Al. [1] presented noise removal method using Symlet wavelet in ECG signals. First the noise signals are added to ECG signal, and then the noisy ECG signal is decomposed using symlet wavelet. By decomposing, the detail and approximation coefficients are obtained. Then detailed coefficient is applied to different types of thresholding technique, to obtain threshold signal. Finally denoise the threshold signal and SNR values are calculated for both realistic noises and color noise. For removing noise from thenoisy signal different types of thresholding such asuniversal, minimax and heursure methods are applied. They used six recorded ECG signals are taken from the MIT-BIH arrhythmia database and calculate the SNR improvement values and analysis which thresholding gives the high SNR values. Compare to other thresholding method the heursure method gives the better results.
In year 2016, Xionget. Al. [2] proposed a method that enhance ECG signal using DAE (denoising auto-encoder) and it is a capable to denoising ECG signals containing noise from baseline wander, electrode contact noises, and motion artifacts.The DAE method is sufficient for denoising signals contaminated with electrode contact noise and motion artifacts, but less so for removing baseline wander owing to limited notes within the layers. To resolved this they supplementing the utilized DAE with a WT method. The WT with scale adaptive thresholding method could filter most of the noise, which is separated from the ECG signal to some degree after wavelet decomposition when the wavelet coefficient of the noise signal was lower than the set threshold. Experimental results for the removal of MA and EM noise indicated that the proposed method provided an improvement over the other methods. Results showed that the proposed method outperforms the conventional algorithms such as S-Transform, with improvement in the SNR and RMSE.
Salvatore Cuomo et al [3] recommended a schemefor denoising ECG Signals based on Recursive Filtering. The proposed scheme is based on the suitable Kernel function in the Fourier domain. The approach involves signal processing on Real Time Health Monitoring which is strictly applicable for efficient outcomes.
The results show that the algorithm is superior in performance than the contemporaries, while at the same time reducing the computation cost and coding, yet maintaining a high level of accuracy. The algorithm is fast and requires less time and memory for execution.
WissamJenkal et al. [4] proposed an enhanced method for ECG signal denoising using the adaptive dual threshold filter and the discrete wavelet transform. It is applied to deal with the EMG noises, the power line interferences and the high frequency noises that could perturb the ECG signal. This process permits to decrease successively the noises in the ECG signal. This algorithm is based on three steps of denoising, namely, the DWT decomposition, the ADTF step and the highest peaks correction step.. Step one deal with elimination of basic noise due to the similarity of the db6 with different morphologies of the ECG signal using DWT composition. In step two application of the ADTF used to correct the signal of first step. The aim of the last step of this method is to include a correcting stage of the highest peaks in the ECG signal. Three simulated noises have been tested, namely, the power line interferences, the EMG noises and the synthetic interferences using MATLAB. The results presented in this paper allow observing that the proposed method offers high performances.
Marco V. Gualsaqu´ı M. et. Al [5] proposes the KPCA method for establishinga high performance ECG signal denoising process. The Kernel Principal Component Analysis (KPCA) method, usually used in image denoising, for minimizing the noise presented in ECG signals for better performance. According to the algorithm used, first preprocessing stage the PLI and BW interference was minimized. In the second stage, different noise types are added to the ECG signals. The next stage is the heartbeat segmentation, then the selected methods were applied, and finally, the final metric is evaluated. The KPCA method has shown the best performance to remove noise both qualitatively and quantitatively.
International Journal of Emerging Technology and Advanced Engineering
Website: www.ijetae.com (ISSN 2250-2459, ISO 9001:2008 Certified Journal, Volume 9, Issue 11, November 2019)
29
Subband coding can beimplemented using iterated filter banks: each filter bank splitsin half the interested bandwidth using a low pass filter and ahigh pass filter. In this way two bands are obtained and the sameoperation can be repeated on the lowpass band. Presented algorithm uses 3 levels of sub bandcoding, splitting the signal bandwidth in four bands. The lowerband contains the approximated signal and is called“approximation level”, while the other three bands contain thesignal details and are called “detail levels”. Denoising isperformed by applying hard thresholding on the three detaillevels. After thresholding, the four levels are added and theDenoised Vector Magnitude is obtained.
Omkar Singh and Rakesh Kumar Sunkaria [7] proposed new methods for power-line interferencecancellation and baseline wander correction in ECGsignals based on Empirical wavelet transform. In clinicalenvironment during data acquisition, the ECG signals areoften corrupted by power-line interference from the recordinginstruments and baseline wander due to movement ofpatients. EWT is a new technique for extracting the differentmodes embedded in a signal and works similar toEMD. When EWT is applied on the noisysignal, the estimate of power-line interference is providedby the last mode whereas the baseline is estimated by thefirst mode. Thus separating these modes from the noisyECG signal provides the noise free ECG. Performanceevaluation reveals that, compared to standard filters andEMD based algorithms, the proposed methods provide considerableimprovement in output signal-to-noise ratio andshows higher correlation between the original ECG and thedenoised ECG signal.
H. Hao et al. [8] developed a multi-lead model-based ECG signal denoising that used guided filter to reduce noise of ECG signals. In this patient-specific statistical model used by individuals to generate sparseautoencoder (SAE) that preserve signal features. In orderto filter out highly correlated predicted signals, the method calculates the cross-correlation between the predicted signal and the noisy signal. Afterward guided signal is obtained by the weighted average of those highly correlated predicted signals. The simplicity and flexibility of the model ensure that the guided signal can contain richer morphological features. At last, a guided filter based ECG denoising technique is applied to eliminate noise, while keeping the diagnostic and detail characteristic of the original ECG signal. The best part of this scheme is use of multi-lead that uses different sparse autoencoder to get better feature of signal and guided filter is used for removal of MA and white Gaussian noise. The selection of sparse autoencoder is based on the signal quality.
S.K. Yadav et al. [9] proposed a novel ECG denoising method which exploits localas well as nonlocal similarity in the signal using nonlocal wavelet transform (NLWT). Similar blocks of samples are estimated in a collaborative manner to reduce the signal noise. The denoising is accomplished by the shrinkage of the two-dimensional (2D) DWT coefficients of the matrix formed with these similar blocks. This process is repeated for each of the overlapping blocks resulting in several estimates for a sample. The final estimate is found by averaging these estimates. Nonlocal wavelet transform (NLWT) involves three sequential steps: the SDM extraction, the transform coefficients shrinkage, and the aggregation.This NLWT method is a combination of the wavelet coefficients shrinkage based denoising method and the NLM algorithm. This algorithm is able to preserve the diagnosticfeatures in the signal much better than the existing algorithms.
MMH Mishu et al. [10] presented a ECG denoising scheme with use of dual tree complex wavelet transform. The dual tree complex wavelet transform (DTCWT) used to reduce the noise of ECG signal via generating complex coefficient to obtain real and imaginary part of signal. The DTCWT consists two trees of real filter where one for the real part and the other for the complex part of the wavelet transform. Here the coefficients for the filters are real so complex arithmetic is not required. The inverse for the dual tree complex wavelet transform is also very easy, both real and imaginary filters are inverted separately and averaging these final reconstructed outputs can be obtained [11]. ECG signal denoising technique using dual tree complex wavelet transform showed improved performance for all type of noise as the SNR is increased after denoising the signal.
III. TYPES OF NOISE IN ECG
An ECG is fashioned by determining the electrical potential between several points of the body using leads. The conventional ECG wave is composed of:
1. The P wave 2. QRS complex 3. ST segment 4. The T wave 5. U wave
P wave
International Journal of Emerging Technology and Advanced Engineering
Website: www.ijetae.com (ISSN 2250-2459, ISO 9001:2008 Certified Journal, Volume 9, Issue 11, November 2019)
30
Throughout standard atrial lessening the main electrical vector travels from the Sinoatrial (SA) node towards the Atrio-ventricular (AV) node and spreads from the right atrium to the left atrium. This turns accustomed to the P wave on the ECG. The shape and period of the P waves may designate atrial enlargement. The short-lived period after the P wave signifies the time in which the instinct is travelling within the AV node. In the AV node the speediness of the electric signal is expressively concentrated. The period of time onset of the P wave to the commencing of the QRS complex is labelled the P-R interval. The customarily is 0.12 to 0.2 second period. P-R interval is the time between the retrenchment of the atria and the retrenchment of the ventricles. If the P-R interval is more that 0.2 of second this designates serious complications with the heart.
QRS complex
The QRS resembles to the blowout of the electrical impulse over the muscle of the ventricles. The QRS complex is an organization on the ECG that is analogous to the depolarization of the ventricles. The muscles of the ventricles are greater than the muscles of the atria: this reasons QRS complex is larger than the P wave. The QRS complex is commonly between 0.06 and 0.1 second; this is a very diminutive period of time and illustrates that Ventricular depolarization happens very quickly. The period and amplitude of the QRS complex is advantageous in diagnosing cardiac problems and other disease states. An inconsistent duration (0.1 seconds) can point to a blockage in the ventricle. Anomalous amplitude can recognize coronary disease, emphysema and fatness privileged the QRS wave is a reduced wave. This wave is the workout of the atrium; it looks like an inverse P wave. It is tremendously lesser in magnitude than the QRS and is so concealed by it.
ST segment
This ST segment is duration of zero voltage that tracks the QRS complex. This is the time duration in between retrenchment of the ventricles. For convinced diseases the ST segment can become disheartened or preeminent.
T wave
The T wave signifies the relaxation of the ventricles. The T wave is scrutinized for its (A) direction, (B) shape and (C) height. A customary T wave is marginally round and irregular. A pointed wave is cause of anxiety. A Tall T wave is a convinced indicator of convinced heart disease.
U wave
Occasionally an insignificant positive U wave may be seen to track the T wave; this is due to the final relaxation of the ventricles. An inverted U wave of a protruding cans fundamental pathology.
Q-T interval
The Q-T interval signifies the whole time taken for ventricles to contract and relax. This period can range from 0.2 to 0.4 of a second.
IV. PROPOSED METHODOLOGY
In this section presents a methodology to remove the noise from the electrocardiogram signal. We use the dual tree- complex wavelet transform by applying kernel adaptive filtering technique which is linear adaptive filters in reproducing kernel Hilbert space.
To remove noise from amplitude signals, increasing quality of an ECG filtering operations are performed here with different pre specified kernels to get these effects are used and padding of zeros while calculating the value of border pixel is done. Kernel padding comprises of extending a signal (or spectrum) with zeros to outspread its time (or frequency band) limits. It maps a length signal to a length M>N signal, but requisite not be an integer multiple of N. To unify the time-domain and frequency-domain definitions of zero-padding, it is obligatory to esteem the original time axis [0,1……N-1] as indexing positive-time samples from 0 to N/2 -1 (for N even), and negative times in the interlude.
[ ⁄ ] [ ⁄ ]
Additionally, we involve ( ⁄ ) ( ⁄ ) when N is even, while odd N requires no such restriction.
KERNEL_PAD { | | ⁄
Where , with ⁄ for M odd, and M/2 -1 for M
International Journal of Emerging Technology and Advanced Engineering
Website: www.ijetae.com (ISSN 2250-2459, ISO 9001:2008 Certified Journal, Volume 9, Issue 11, November 2019)
31
DT-CWTDual-tree Complex wavelet transform [13], [14] and [15] is complex valued extension of the standard wavelet. Complex transform utilize complex valued filtering that partitioned the image into real and imaginary fraction in transform domain. The real and imaginary coefficients are used to compute magnitude and phase information. The key impetus for producing the dual-tree complex wavelet transform was shift invariance. Here, the common wavelet decomposition small shifts of the input signal are able to move energy between output sub-bands. Shift invariance can also be achieved in DWT by doubling the sampling rate. This is achieved in the DT-CWT by removing the down sampling by 2 after first level filter. Two fully decimated trees are then produced by down sampling, effected by considering first even and then odd samples after the first level of filters. To get consistent intervals between the two trees samples, the subsequent filters need half a sample different delay in one tree.
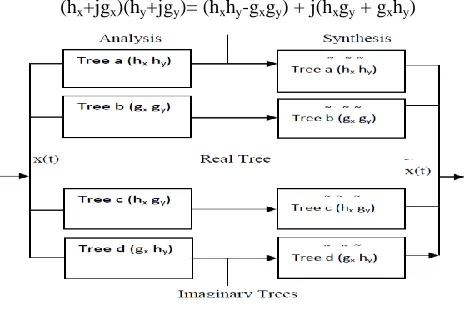
The tangible 2-D dual-tree DWT of an image x is instigated using two critically-sampled separable 2-D DWTs in parallel. Then for every couple of sub-bands we take the sum and difference. The complex 2-D DT-DWT also provides rise to wavelets in six divergent directions. The complex 2-D dual-tree is instigated as four critically-sampled separable 2-D DWTs operating in parallel as depicted in figure 2, 2-D structure needs four trees for analysis and synthesis. The couple of conjugate filters applied to two dimensional images (x, y) can be expressed as:
[image:5.612.328.558.116.296.2](hx+jgx)(hy+jgy)= (hxhy-gxgy) + j(hxgy + gxhy)
Fig. 2: Filter bank structure for 2-D DT-DWT
[image:5.612.49.281.487.644.2]The complex wavelets are capable to differentiate between positive and negative the diagonal sub-bands can be distinguished and horizontal and vertical sub-bands are divided giving six distinct sub-bands in each scale at orientations ±150, ±450, ±750. The oriented and scale dependent sub-bands are visualized spatially in figure 3.
Fig. 3: Complex Wavelet Transform Scale Orientation labelled sub-bands
The DWT have three sub-bands in 00, 450 and 900 directions only but DT-CWT having six sub-bands in ±150, ±450 and ±750, therefore DT-CWT improves the directional selectivity which is the prime concern in the application like image fusion. Steps involve of propose work for extracting the noise from the ECG signals.
Steps:
1. Call MIT-BIH ECG file X=imread([104.atr, 104.dat, 104.hea] ………..) //imread will call separately 2. Feature extraction of (X) and make a dataset with .mat
extension for an individual data file
3. Define value of F[], A[], N then apply remz() basic filter process // N = max sample length (taken 1024) 4. Apply DWT transformation in selected ecgdata*.mat
processed file.
5. Precede it for analyzing visualization level of the basis of the LL band of DWT process.
6. Since the ECG sample mydata is signed as well as unsigned 8-bit mixed type (the most common situation), values vary from 0 to 255 to each containing cell.
7. To pertain decompositions on the basis of signal quality, noise level then precedes it.
8. Normalized the data value if not predicted with unsigned bit value.
9. To pertain intensity transfer method as per determined intensity of the decomposed ECG’s and stored it as SMTn_out.
10. On SMTn_out, apply kernel function to filter an ECG layers after weighted map and smoothening (SMTn_out).
International Journal of Emerging Technology and Advanced Engineering
Website: www.ijetae.com (ISSN 2250-2459, ISO 9001:2008 Certified Journal, Volume 9, Issue 11, November 2019)
32
W1 = edge(LH,'canny'); W2 = edge(HL,'canny'); W3 = edge(HH,'canny');
12. Process all decomposed and layered ECG’s for fusion rule to compose all resultant as single noise free improved ECG and stored it as ECG_NF.
F = W1*LH + (1-W1)*(W2*HL+ (1-W2)*HH);
13. IDWT out=idwt2(F,LH,HL,HH,'haar'); 14. Output measurement: MSE, PSNR, PRD
V. EXPERIMENTAL RESULTS
This section shows the experimental results of our proposed work. The implementation of the proposed work is done using MATLAB and wavelet toolbox. The comparison of the work is done among different performance metrics like PSNR, MSE and PRD.
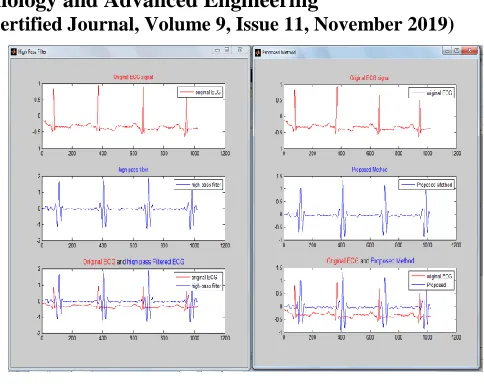
5.1 GUI Window Environments
MATLAB provide the reach library for creating GUI environment. Where with the help of its environment can make easily user friendly design environment within short time duration. Here figure 4 and 5 shows that the enhanced quality of 100.dat ECG data.
[image:6.612.322.564.111.303.2]Fig.4: Main window of for 100.dat
Fig. 5: Enhanced ECG of 100.dat
5.2 Simulation Results
The result analysis of noise filter and reduction three methods compared with proposed method. The table 1, 2 and 3 shows that the detailed analysis of all method. Where table 1 shows that the MSE, table 2 shows that the PSNR and table 3 shows that the PRD comparison of all methods.
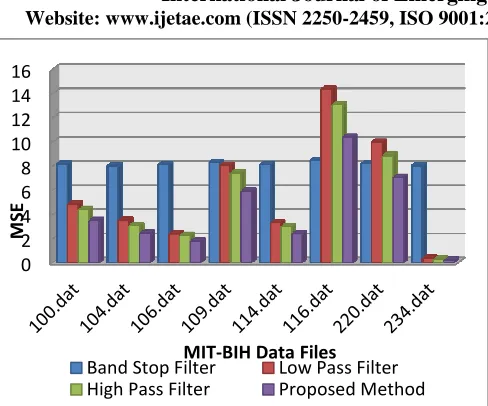
Table1:
MSE Comparison of Existing methods with Proposed Method
DataFile/ Method
Band Stop Filter
Low Pass Filter
High Pass Filter
Proposed Method 100.dat 8.14266 4.83684 4.38233 3.4911 104.dat 8.01766 3.52147 3.05725 2.43243 106.dat 8.11859 2.3815 2.24183 1.7851 109.dat 8.30172 8.06264 7.42155 5.91985 114.dat 8.105 3.30033 3.00076 2.39056 116.dat 8.46703 14.3446 13.049 10.3945 220.dat 8.17484 9.97797 8.86095 7.05561 234.dat 8.0075 0.35783
9
International Journal of Emerging Technology and Advanced Engineering
Website: www.ijetae.com (ISSN 2250-2459, ISO 9001:2008 Certified Journal, Volume 9, Issue 11, November 2019)
[image:7.612.50.294.114.317.2]33
[image:7.612.318.565.118.312.2]Fig.6: MSE Comparison of Existing methods with Proposed Method
Table 2:
PSNR Comparison of Existing methods with Proposed Method
DataFil e/Meth od
Band Stop Filter
Low Pass Filter
High Pass Filter
Proposed Method
100.dat 26.5932 38.7914 41.2456 45.128 104.dat 32.851 41.4882 44.373 48.563 106.dat 27.1465 44.8857 47.0676 51.5046 109.dat 24.3496 34.2931 36.6698 40.1076 114.dat 27.5111 42.0515 44.535 48.7281 116.dat 23.0411 29.2889 31.7681 34.7556 220.dat 25.9838 32.4418 35.13 38.439 234.dat 35.4154 61.3489 64.8377 70.9753
[image:7.612.319.570.362.572.2]Fig. 7: PSNR Comparison of Existing methods with Proposed Method
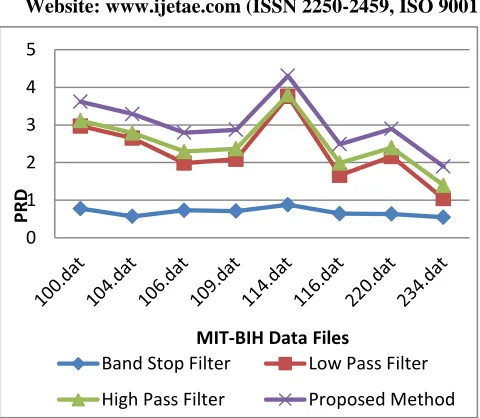
Table 3:
PRD Comparison of Existing methods with Proposed Method
DataFile/ Method
Band Stop Filter
Low Pass Filter
High Pass Filter
Proposed Method
100.dat 0.775836 2.96973 3.1141 3.61706 104.dat 0.56975 2.64711 2.78658 3.28787 106.dat 0.732877 1.98415 2.29445 2.79636 109.dat 0.708295 2.08995 2.36723 2.87076 114.dat 0.878565 3.76083 3.80434 4.3079 116.dat 0.641782 1.66365 1.98689 2.4889 220.dat 0.632701 2.16032 2.39511 2.89706 234.dat 0.546152 1.03957 1.39492 1.89535
0 2 4 6 8 10 12 14 16
M
SE
MIT-BIH Data Files
Band Stop Filter Low Pass Filter High Pass Filter Proposed Method
0 10 20 30 40 50 60 70 80
100.dat 104.dat 106.dat 109.dat 114.dat 116.dat 220.dat 234.dat
PSN
R
(
d
b
)
MIT-BIH Data Files
Band Stop Filter Low Pass Filter
[image:7.612.52.287.368.564.2]International Journal of Emerging Technology and Advanced Engineering
Website: www.ijetae.com (ISSN 2250-2459, ISO 9001:2008 Certified Journal, Volume 9, Issue 11, November 2019)
[image:8.612.50.290.120.329.2]34
Fig. 8: PRD Comparison of Existing methods with Proposed Method
VI. CONCLUSION
The appraisal of the electrocardiogram (ECG) has been methodically used for diagnosing many cardiac diseases. In this paper DT-CWT by applying kernel filtering are uses for eliminating the noise from ECG with high accuracy and high frequency. This paper also presents an overview of various types of noise occur on ECG. The experimental result of propose work on comparing with existing methods, it gives enhance simulation results after analysing with performance metrics PDR, PSNR and MSE. In future work mainly focus on to develop such techniques or algorithm which is less complex and earliest de-noising the ECG with more accuracy. To make appropriate medical diagnosis, doctors often need to compare the ECG signal with the patient’s own individual record. Therefore modeling the ECG signal for each patient becomes very important in clinic practice. In addition, ECG signal is often corrupted with noise which makes an accurate diagnosis very difficult. ECG noise elimination is convoluted because of the time-varying nature of ECG signals. The customary schemes to eliminate high frequency noise from ECG signal are to employ a low-pass filter.
REFERENCES
[1] Vijayakumari, B., J. Ganga Devi, and M. IndhuMathi. "Analysis of noise removal in ECG signal using symlet wavelet." In Computing Technologies and Intelligent Data Engineering (ICCTIDE), International Conference on, pp. 1-6. IEEE, 2016.
[2] Xiong, Peng, Hongrui Wang, Ming Liu, Suiping Zhou, ZengguangHou, and Xiuling Liu. "ECG signal enhancement based on improved denoising auto-encoder." Engineering Applications of Artificial Intelligence 52 (2016): 194-202.
[3] Cuomo, Salvatore, Giuseppe De Pietro, Raffaele Farina, ArdelioGalletti, and Giovanna Sannino. "A revised scheme for real time ecg signal denoising based on recursive filtering." Biomedical Signal Processing and Control 27 (2016): 134-144.
[4] Jenkal, Wissam, RachidLatif, Ahmed Toumanari, AzzedineDliou, Oussama El B’charri, and Fadel MR Maoulainine. "An efficient algorithm of ECG signal denoising using the adaptive dual threshold filter and the discrete wavelet transform." Biocybernetics and Biomedical Engineering 36, no. 3 (2016): 499-508.
[5] Gualsaquí, M. Marco V., E. Ivan P. Vizcaíno, Marco J. Flores-Calero, and Enrique V. Carrera. "ECG signal denoising through kernel principal components." In Electronics, Electrical Engineering and Computing (INTERCON), 2017 IEEE XXIV International Conference on, pp. 1-4. IEEE, 2017.
[6] Giorgio, Agostino, and CataldoGuaragnella. "ECG Signal Denoising using Wavelet for the VLP effective detection on FPGA." In 2018 AEIT International Annual Conference, pp. 1-5. IEEE, 2018. [7] Singh, Omkar, and Ramesh Kumar Sunkaria. "ECG signal denoising
via empirical wavelet transform." Australasian physical & engineering sciences in medicine 40, no. 1 (2017): 219-229. [8] Hao, Huaqing, Ming Liu, PengXiong, Haiman Du, Hong Zhang,
Feng Lin, ZengguangHou, and Xiuling Liu. "Multi-lead model-based ECG signal denoising by guided filter." Engineering Applications of Artificial Intelligence 79 (2019): 34-44.
[9] Yadav, Santosh Kumar, Rohit Sinha, and Prabin Kumar Bora. "Electrocardiogram signal denoising using non-local wavelet transform domain filtering." IET Signal Processing 9, no. 1 (2015): 88-96.
[10] Mishu, MdMotahar Hossain, ABM Aowlad Hossain, and MdEhsan Ahmed Emon. "Denoising of ECG signals using dual tree complex wavelet transform." In Computer and Information Technology (ICCIT), 2014 17th International Conference on, pp. 379-382. IEEE, 2014.
[11] N. G. Kingsbury, “Complex wavelets for shift invariant analysis and filtering of signals,” Applied and Computational Harmonic Analysis, vol. 10, no. 3, pp. 234–253, 2001.
[12] J. Kivinen, A. Smola and R. C. Williamson. Online learning with kernels, IEEE Transactions on Signal Processing, volume 52, issue 8, pages 2165-2176, 2004.
[13] N. G. Kingsbury, “The dual-tree complex wavelet transform with improved orthogonality and symmetry properties”, IEEE international Conference on Image processing, pages 375-378, September 2000.
[14] N. G. Kingsbury, “The dual-tree complex wavelet transform: a new technique for shift invariance and directional filters, IEEE Digital Signal Processing Workshop, 1998.
[15] Kingsbury, N.G.(2000) “A dual-tree complex wavelet transform with improved orthogonality and symmetry properties. Proc. IEEE Conf. on Image Processing, Vancouver, September 11-13, 2000, (paper 1429).
0 1 2 3 4 5
PRD
MIT-BIH Data Files
Band Stop Filter Low Pass Filter