International Journal of Emerging Technology and Advanced Engineering
Website: www.ijetae.com (ISSN 2250-2459,ISO 9001:2008 Certified Journal, Volume 5, Issue 6, June 2015)
378
Enhanced Trilateration Localization Using Fuzzy Logic for
WSN
Basant R. El Samadony
1, Rabie A. Ramadan
2, Nevin M. Darwish
31,2,3
Computer Engineering Department, Faculty of Engineering, Cairo University
Abstract— One of the most widely used techniques for solving the famous localization problem in wireless sensor networks (WSNs) is the Trilateration. This paper introduces an enhanced version of the Trilateration algorithm entitled Fuzzy Based Trilateration (FBT). The main objective is to estimate the position of sensor nodes in WSNs accurately with a cheap, low power and simple technique. FBT achieves its objective not only by using Fuzzy Logic similar to previous attempts but also by adding a new dimension parameter to distance estimation. Through a set of simulation experiments, a comparison has been made between the regular Trilateration and the FBT. The simulation results are promising where the best enhancement FBT has made with respect to pure Trilateration is 33% with a linear complexity of O (n) where n is the number of nodes.
Keywords—Wireless Sensor Networks (WSN), Localization, Trilateration, Received Signal Strength Indicator (RSSI), Link Quality Indicator (LQI), Power Level (PL), Fuzzy Logic (FL).
I. INTRODUCTION
A wireless sensor network consists of spatially distributed autonomous sensor nodes designed to monitor physical or environmental conditions, such as temperature, sound, pressure, etc. Sensor nodes send their sensed data through the network to a centralized location named ―Sink node‖. WSNs were initially designed to facilitate military operations but their application has been extended to health, traffic, search, disaster relief, target tracking and also a number of duties in smart environments [22]. In some applications, nodes may be deployed from an airplane and the precise location of most sensors may be unknown [10].
A large body of literature have been found for WSNs due to their applicability for many applications. The area of deployment, for instance, has attracted some of the researchers in which different types of deployment purpose are introduced. For instance point coverage is introduced in [25] while linear coverage deployment is proposed in [17]. Deployment for coverage and connectivity purposes is also given in [27] and [26]. Deployment of mobile sensors is also considered in [2] and [23].
In fact, mobile networks became one of the important networks and many researches consider the mobile devices as a benefit to the utilized applications [8].
Some other research focus on the WSNs security due to the criticality of the sensors information such as health information; for instance, the authors in [3] and [18] have considered the problem of key management in WSNs while the authors in [12] discussed the implementation of security during deployment. At the same time, the authors in [5] [14] considered the issue of security during the sensors clustering. Other research articles focus on the sensor networks intrusion detection and the new attacks that appeared in recent years [6].
More research in the field of WSNs focus on the applications. For example, sensors are used in military services in which sensors can monitor country borders [9]. Sensors are also used to monitor the forests where animals can be observed 24/7 for the benefit of studying their behaviour. Sensors are also used in oil fields as well as water monitoring where sensors can detect any leakages in the pipes.
Looking at such applications and research articles, sensors' localization represents the common process that is required by all of them. Sensors’ location is essential for a node to report its position along with the sensed data. If data sent by a node carries no or incorrect position information, they would be meaningless or even harmful. Therefore, nodes’ location must be associated along with each sensed event.
International Journal of Emerging Technology and Advanced Engineering
Website: www.ijetae.com (ISSN 2250-2459,ISO 9001:2008 Certified Journal, Volume 5, Issue 6, June 2015)
379
This paper introduces a modified localization technique that is inspired from the current trilateration localization algorithm. The proposed technique is based on Fuzzy Logic. The technique differs from previous attempts in that it adds a new dimension to the parameters used to estimate the distance between anchors and nodes which is Power Level (PL) along with Received Signal Strength (RSS) and Link Quality Indicator (LQI). In addition to such parameters, their usage as input to a fuzzy logic controller is expected to overcome the uncertainty in their readings. Therefore our contribution in this paper is introducing a new Trilateration Localization Based Fuzzy Logic (FBT) algorithm along with considering new parameters during the localization process; the algorithm is examined in a simulated WSNs environment for estimating its performance.The rest of this paper is organized as follows; Section 2 describes the related work, background and fundamental terms/definitions/algorithms essential for understanding the proposed algorithm. In Section 3, the proposed algorithm is described in details. In section 4, simulation results are given to show the performance of the proposed method. Finally, the conclusion is drawn in Section 5.
II. BACKGROUND
This section reviews the concepts behind the Trilateration algorithm, fuzzy logic controller followed by the definition of the proposed parameters to be used for localization. Finally, it surveys the state of the art of the current intelligent localization algorithms.
A. Trilateration
Trilateration [21] is a method for calculating the objects' positions using the geometry of triangles by the knowledge of the location of two or more reference points, and the measured distance between the object and each reference point. Trilateration needs at least three non-collinear reference points on a 2D plane and four non-collinear reference points on 3D plane. Trilateration is a distributed, range-based, anchor-based localization algorithm. As trilateration is a range based algorithm it uses distance estimation to compute the position of nodes in a network with the help of a feature of the communicating signal from the sender node to the receiving node.
Considering the general sphere (1):
𝑑2 =𝑥2 +𝑦2 +𝑧2 (1)
For a sphere centred at point (xa, ya, za), (1) is simplified
as in (2):
𝑑2 = (𝑥−𝑥𝑎) 2 + (𝑦−𝑦𝑎) 2 + (𝑧−𝑧𝑎) 2 (2)
Consider three anchor nodes (a, b and c) that have distances (da, db, dc) to a blind node respectively as in
[image:2.612.326.567.196.318.2]Figure 1
Figure 1: Intersection of three spheres in 2D [21]
The formulae for the three spheres are given by the following equations:
Sphere A: 𝑑 (𝑥 𝑥 ) (𝑦 𝑦 ) (3)
Sphere B: 𝑑 (𝑥 𝑥 ) (𝑦 𝑦 ) (4)
Sphere C: 𝑑 (𝑥 𝑥 ) (𝑦 𝑦) (5)
Using equations (3-5), one can get the positions x and y.
B. Fuzzy Logic Controllers (FLC)
As depicted by Figure 2, any fuzzy system has four main components; a fuzzifier (given input data), a knowledge base (Rules), an inference engine (decision making unit), and a defuzzifier (required output data).
Figure. 2: Fuzzy logic system
[image:2.612.335.554.507.618.2]International Journal of Emerging Technology and Advanced Engineering
Website: www.ijetae.com (ISSN 2250-2459,ISO 9001:2008 Certified Journal, Volume 5, Issue 6, June 2015)
380
Next, the inference is made based on a set of rules. The inference process is used to map the fuzzy inputs to fuzzy output through a list of if-then conditional statements which are called rules. In addition, the aggregation process is done where the output of each rule is combined into a single fuzzy set. Aggregation occurs just for each output variable before the last step which is defuzzification. In the aggregation step, the input is the list of truncated output functions returned by the inference method for every rule while the output is one fuzzy set for each output variable. The defuzzification process is done to transform the fuzzy output generated from the aggregation process to a crisp output which is used as the decision of the fuzzy system. Defuzzification is also performed according to a membership function of the output variable.C. Localization Parameters
In this section, the proposed localization parameters to be used with Trilateration algorithm are introduced namely the Received Signal Strength (RSSI), Link Quality Indicator (LQI), and the Power Level (PL) following definitions in [13].
1. Received Signal Strength Indicator (RSSI)
:
RSSI is an indicator measure to the power of the signal at the receiver node. It is calculated assuming the transmitted power can be measured. Based on the transmitted power amount, the effective propagation loss can be calculated and thence, by using theoretical and empirical models, this loss is translated into distance estimation. Recent research [13] shows that RSSI is a good distance estimator. In free space, RSS varies as the inverse square of the distance between the sender and the receiver. According to Friis' free space transmission equation, the received signal strength decreases with the increase in distance between transmitter and receiver as per (6) :( ) (6)
Where PT is transmission power of transmitter, PR is
power received at the receiver, GT is gain of transmitter
antenna, GR is gain of receiver antenna, d is distance
between transmitter and receiver, and λ is the wave length of RF signal.
In case of IEEE 802.15.4/ZigBee based Sensor Nodes (SNs) [13], the received signal power is usually converted to Received Signal Strength Indicator (RSSI), which is defined as the ratio of received power to the reference power (Pref). Reference power is taken as 1mw and RSSI is given by:
RSSI= 10. Log
(7)
Where PREF=1mW
2. Link Quality Indicator (LQI): LQI is a measure of the quality of a link between two nodes based on the average value over successive transmissions [13]. LQI decreases as the distance between transmitter and receiver increases. According to IEEE 802.15.4 standards, LQI has a value between 0 and 255 [13] .
3. Power Level (PL): PL is the quantity of power needed at the transmitter to enable it to send packets to the receiver. As the distance between transmitter and receiver increases, the PL increases. Power transmitted is calculated as (8):
( λd) (8)
Where λ is the carrier signal wave length, is the gain of the transmitter antenna, is the gain of the receiver antenna, and is the received power.
D. Intelligent Localization
In [13] the authors use a RSSI based Trilateration localization algorithm to accurately localize the nodes. The authors in [21] also investigate the possibility of implementing node positioning in the ZigBee wireless sensor network by using a readily available Received Signal Strength Indicator (RSSI) infrastructure provided by the physical layer of 802.15.4 networks. In this study, the RSSI is converted to the distance providing the basis for using the Trilateration methods for location estimation. In [16] Trilateration using weighted centroid has been utilized. The paper proposes a fuzzy based algorithm to solve the trilateration problem (i.e. when the node is in the overlapping region of circles) in WSNs and suggests the use of an additional parameter for distance estimation.
To best of our knowledge no study uses the PL parameter to estimate the distance between two nodes. However, the sensornodes power level has been studied in many of the recent research articles other than the localization such as in [11] and [19]. In [11] the authors try to optimize the transmitter power level in sensor nodes while in [19] the authors use the sensors' power level and signal strength to estimate the radio power costs. Therefore, it can be considered during the localization process as well.
III. FUZZY BASED TRILATERATION (FBT)
International Journal of Emerging Technology and Advanced Engineering
Website: www.ijetae.com (ISSN 2250-2459,ISO 9001:2008 Certified Journal, Volume 5, Issue 6, June 2015)
381
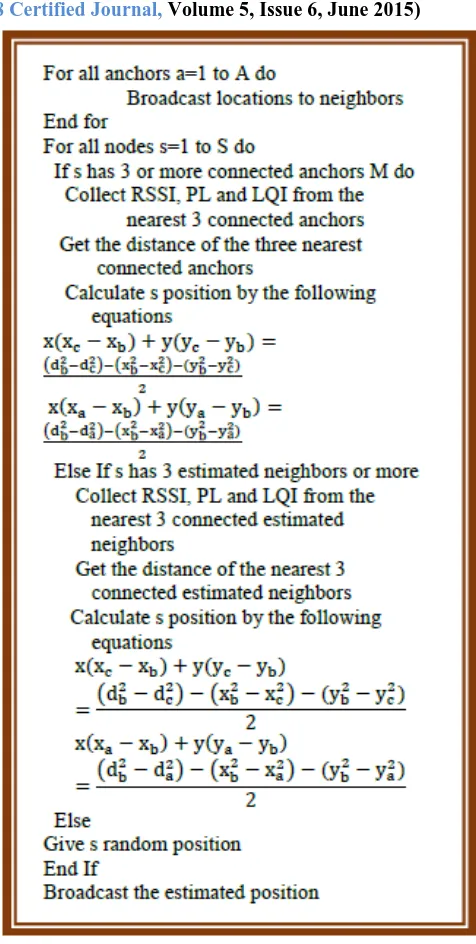
The idea behind FBT is the consideration of uncertainty in the input readings. In addition, the proposed method considers PL as a new parameter that was not utilized before for the same reason or used separately along with RSSI and LQI. We believe that utilizing all of these parameters together enhances the performance of the Trilateration. FBT contains two types of sensor nodes, anchor nodes which know their positions and blind or normal nodes which don't know their positions and it is required to localize them. FBT uses RSS, LQI, and PL as input parameters to estimate the distance between anchors and nodes. FBT uses three fuzzy values (Low, Medium, and High) for each input parameter and five output fuzzy values (VeryLow, Low, Medium, High, VeryHigh) as indicated in Figures 4a and 4b, respectively. In addition, 27 different fuzzy rules are used as shown in Table I. Triangular membership function for input and output is utilized. The FBT pseudo code is given in Figure 3 and the steps follow:Step 1: Each node collects RSSI, LQI and PL values from the connected anchors and the connected neighbours.
Step 2: Each collected crisp value for RSSI, LQI and PL is mapped to get the corresponding fuzzy values according to the input membership in Figure 4a
Step 3: The three fuzzy values are used to calculate the fuzzy distance according to Table I.
Step 4: The distance fuzzy value is transferred to a crisp value according to the output membership function as Figure 4b
Step 5: All anchors broadcast their position
Step 6: If a node hears from at least 3 anchors, then it estimates its position by trilateration equations and broadcast its estimated position else go to step 7.
[image:4.612.325.563.120.592.2]Step 7: If a node has at least 3 estimated neighbours then it estimates its position by trilateration with the nearest estimated 3 neighbours as anchors.
International Journal of Emerging Technology and Advanced Engineering
Website: www.ijetae.com (ISSN 2250-2459,ISO 9001:2008 Certified Journal, Volume 5, Issue 6, June 2015)
382
(a) (b) [image:5.612.55.273.129.240.2]Figure 4: (a) input membership function, (b) output membership
TABLE I FBT Fuzzy Rules
RSSI PL LQI Distance
Low High Low VeryHigh
Low High Medium High
Low High High High
Low Medium Low High
Low Medium Medium Medium
Low Medium High Medium
Low Low Low High
Low Low Medium Medium
Low Low High Low
Medium High Low High
Medium High Medium Medium
Medium High High Medium
Medium Medium Low Medium
Medium Medium Medium Medium
Medium Medium High Medium
Medium Low Low Medium
Medium Low Medium Medium
Medium Low High Low
High High Low High
High High Medium Medium
High High High Low
High Medium Low Medium
High Medium Medium Medium
High Medium High Low
High Low Low Low
High Low Medium Low
High Low High VeryLow
IV. SIMULATION RESULTS
In this section, different sets of experiments are performed in order to examine the performance of the proposed enhanced algorithm FBT. Here, the experiments are designed to test the performance of some possible parameters combination versus the combination proposed by FBT named: 1) Trilateration using RSSI only (TR), 2) Trilateration using RSSI and LQI (TRL) and Trilateration using RSSI, LQI and PL (FBT). FBT algorithm is tested for different 1) anchor density, 2) number of sensors, 3) different topologies and 4) different communication ranges. Performance measure in this section is the average results over different network topologies as well as different network settings. The utilized simulator is the one described in [1]. The network simulation area is 600*600 in 2D region. The following equations are used to simulate the used parameters according to the references [19] [23] [15]:
RSSI = −10*np*log10 (d) + α (9)
Where, np is the path loss factor, which may take different values and may be affected by different environments, here np=2 which is the path loss factor in open air. α is constant, and it is the RSSI value of the sensor node that is located at 1meter distance of anchor node, so α is considered to be -70 dB for this implementation. d is the distance between two nodes where it is calculated as in (10):
𝑑 √(𝑥 𝑥) (𝑦 𝑦) (10)
LQI is calculated as in (11) according to the description in [23]:
{
𝑑 ( (( ) ) ) 𝑑
𝑑
(11
)
Where
Rc: is the communication range
PL is calculated by (12) as described in [15]:
PL= =
( )
(12)
[image:5.612.58.278.269.682.2]International Journal of Emerging Technology and Advanced Engineering
Website: www.ijetae.com (ISSN 2250-2459,ISO 9001:2008 Certified Journal, Volume 5, Issue 6, June 2015)
383
The error is calculated by (13):Error =
∑
(13)
Where N is number of nodes
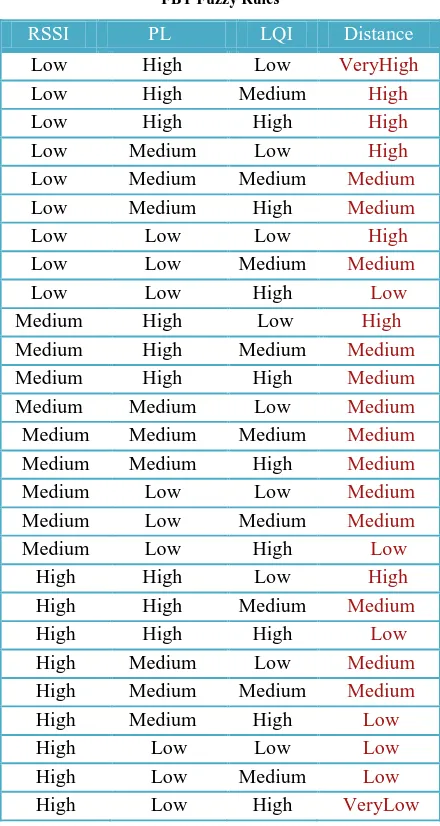
A. FBT Performance with Different Node Densities This set of experiments examines the trilateration when number of nodes increases in the deployed area. The number of sensors in these experiments are set to 20, 50, 100, 150 and 200 sensors deployed in the monitored field. The anchor nodes are assumed to be 8 anchors. At the same time, nodes are assumed to have homogenous communication range which is 250 units. The antenna type of the homogeneous nodes and their beam width are considered to be directed and 45 respectively.
[image:6.612.325.585.386.576.2]The average results of these experiments are elaborated in Figure 5. As can be seen, the number of nodes increased while the error percentage slightly decreases. However, it has been noticed that there is an enhancement in the localization accuracy when LQI is used as well as the combination of the RSSI, LQI, and PL. For instance, the error for 200 sensor nodes deployed in the region is minimum when using the three parameters combined using fuzzy logic as it was 0.9 m. Another example shows the low error of the combination of the three parameters is the one given when 20 nodes are deployed in the monitored field. At this point, the combination of three parameters gives 1, while the combination of the RSSI and LQI gives 1.1 m; however, using RSSI only, the error percentage was 1.25 m. The best enhancement here is at no. of nodes 20, where FBT enhances the error from TR and TRL by 18% and 9% respectively.
Figure 5: FBT Node Density versus Error
B. FBT Performance with Different Anchor Densities
This set of experiments examines the performance when changing the number of anchors in the deployment area with the same number of nodes. The configuration of this experiment assumes 200 sensors are deployed in the monitored field. The percentages of the anchor nodes are assumed to be 0.025% and 0.04% from the overall number of nodes in different experiments. All nodes have homogenous communication range which is 250 units. The average results of these experiments are elaborated in Figure 6. As can be seen, the error percentage of FBT is much better than the other methods. This confirms that mixing all of the parameters enhances the localization performance. At the same time, the figure illustrates that as the number of anchors increase, the error percentage becomes low. This is due to density of node since the chance for each node to have 3 anchors or more increases which helps them in locating themselves accurately. Here the best enhancement happens at anchor density 0.04, where FBT enhances the error from TR and TRL by 7% and 3% respectively.
Figure 6: FBT Anchor Density versus Error
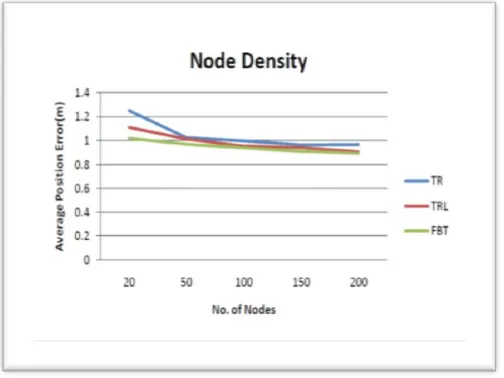
C. FBT Performance with Different Communication Ranges
[image:6.612.53.305.515.704.2]International Journal of Emerging Technology and Advanced Engineering
Website: www.ijetae.com (ISSN 2250-2459,ISO 9001:2008 Certified Journal, Volume 5, Issue 6, June 2015)
[image:7.612.326.585.138.312.2]384
The error decreases while increasing the ranges as the chance of hearing from anchors increases so that each sensor can estimate its position accurately.Figure 7: FBT Communication Range versus Error
D. 4.4 FBT Performance with Different Topologies
[image:7.612.53.302.173.401.2]This experiment examines the algorithms with different anchors deployment topology. The configuration of this experiment assumes 200 sensors with 8 anchors are deployed in the monitored field. The anchors are deployed at random and grid topology in the different experiments. All nodes are assumed to have communication range which is 250 units. The average results of these experiments are elaborated in Figure 8. The figure illustrates that FBT gives the best results at different deployments. The best enhancement happens at grid topology with respect to TR by 10%.
Figure 8: FBT Topology versus Error
V. CONCLUSION
International Journal of Emerging Technology and Advanced Engineering
Website: www.ijetae.com (ISSN 2250-2459,ISO 9001:2008 Certified Journal, Volume 5, Issue 6, June 2015)
385
REFERENCES[1] Abdelhady Naguib, 14 Jul 2011, Wireless Sensor Network Localization Simulator v1.1 [online]available: http://www.codeproject.com/Articles/225536/Wireless-Sensor-Network-Localization-Simulator-v1
[2] Ahmed, E. and Rabie, R. (2013) Efficient Mixed Mode Summary for Mobile Networks. International Journal of Wireless & Mobile Networks (IJWMN). 5 (4).
[3] Ahmed, E., Rabie, R. and Magda, F. (2013) VEGK: Virtual ECC Group Key for Wireless Sensor Networks. at International Conference on Computing, Networking and Communications (ICNC 1013) .
[4] Amina A. (2012) Intelligent and Distributed Localization of Nodes in Wireless Sensor Networks. Msc. Thesis, Faculty of Engineering, Islamic University – Gaza, Palestine.
[5] Bhasker, L. (2014) Genetically derived secure cluster-based data aggregation in wireless sensor networks. Information Security, IET . 8 (1). p. 1-7.
[6] Butun, I., Morgera, D., and Sankar, R. (2014) A Survey of Intrusion Detection Systems in Wireless Sensor Networks,’ IEEE Communications Surveys & Tutorials.16 (1). p.266-282.
[7] Cadger, F., Curran , K., Santos, J., and Moffett S. (2013) A Survey of Geographical Routing in Wireless Ad-Hoc Networks. IEEE Communications Surveys & Tutorials. 15 (2). p.621- 653.
[8] Chowdhuri, S., Dey, N., Azar, AT., Chaudhury, SS., and Banerjee. P. (2014) Recent Research on Multi Input Multi Output (MIMO) based Mobile ad hoc Network: A Review. International Journal of Service Science, Management, Engineering, and Technology (IJSSMET), 5(3). p. 54-65.
[9] Durisic, P., Tafa, Z., Dimic, G., and Milutinovic, V. (2012) A survey of military applications of wireless sensor networks. Mediterranean Conference on Embedded Computing (MECO). 196 (199). p.19-21. [10] Fadi, A., Hossam, H. , and Mohamed, I. (2013) Efficient deployment
of wireless sensor networks targeting environment monitoring applications. Computer Communications. 36 (2). p. 135–148. [11] F. Lavratti, A. Ceratti, D. Prestes, ,A Transmission Power
Self-Optimization Technique for Wireless Sensor Networks, ISRN Communications and Networking, vol. 2012.
[12] Garcia, M., Bri, D., Sendra, S., and Lloret J. (2010) Practical deployments of wireless sensor networks: a survey. Journal on Advances in Networks and Service. 3. p. 1–16.
[13] Hakan Koyuncu and Shuang Hua Yang, A study of indoor positioning by using trigonometric and weight centroid localization techniques, International Journal of Computer Engineering Research Vol. 2(4), pp. 60-67, October 2011.
[14] Hongxia, W., and Bangxu, Y. (2013) Perceptual Hashing-Based Robust Image Authentication Scheme for Wireless Multimedia Sensor Networks. International Journal of Distributed Sensor Networks. 2013. p. 1–9.
[15] J. Xu, W. Liu, F. Lang, Y. Zhang and C. Wang, Distance Measurement Model Based on RSSI in WSN, Wireless Sensor Network, Vol. 2 No. 8, 2010, pp. 606-611.
[16] Jyoti, Rekha Yadav, Neha Singh ,Localization in WSN Using Modified Trilateration Based on Fuzzy Optimization, International Journal of Advanced Research in Computer Science and Software Engineering Volume 3, Issue 7, July 2013 ISSN: 2277 128X [17] Kumar, S. and Lobiyal, D. (2013) Linear order sensor network
deployment for coverage analysis based on TBM theory. IEEE 3rd International Conference on Advance Computing (IACC). p.404 – 407.
[18] Kumar, DS, Nagarajan, N, and Azar , AT (2014) An Improved key management scheme with high security in wireless sensor networks. In: A.E. Hassanien, T.H. Kim, J. Kacprzyk, A.I. Awad (eds.), Bio-inspiring Cyber Security and Cloud Services: Trends and Innovations, Intelligent Systems Reference Library, Springer-Verlag GmbH Berlin/Heidelberg. 70. p. 249-264
[19] Mallinson M.; Drane P.; Hussain S., ,Discrete Radio Power Level Consumption Model in Wireless Sensor Networks, Mobile Adhoc and Sensor Systems, 2007. MASS 2007. IEEE International Conference on , vol., no., pp.1,6, 8-11 Oct. 2007
[20] Mao, G.Q.; Fidan, B.; Anderson, B.D.O. ,Wireless sensor network localization techniques,. Comput. Netw. 2007, 51, 2529–2533. [21] Oguejiofor O.S, Aniedu A.N, Ejiofor H.C, Okolibe A.U
,Trilateration Based localization Algorithm for Wireless Sensor Network , International Journal of Science and Modern Engineering (IJISME) ISSN: 2319-6386, Volume-1, Issue-10, September 2013 [22] Rampatzis, T., Lygeros, J., and Manesis, S. (2005). A Survey of
Applications of Wireless Sensors and Wireless Sensor Networks. Mediterrean Conference on Control and Automation. 719 (724). p. 27-29.
[23] R. Behnke, D. Timmermann ,AWCL: Adaptive Weighted Centroid Localization as an Efficient Improvement of Coarse Grained Localization, In Positioning, Navigation and Communication, 2008. WPNC 2008. 5th Workshop
[24] Salah, R. and Rabie, R. (2010) Efficient Deployment Algorithms for Mobile Sensor Networks. International Conference on Autonomous and Intelligent Systems, AIS.
[25] Shuhui, Y., Fei, D., Cardei, M., and Jie, W. (2005) On multiple point coverage in wireless sensor networks. IEEE International Conference on Mobile Adhoc and Sensor Systems.
[26] Tapan, J., Davinder, S., and Sunil, B. (2014) Cluster Head Selection in a Homogeneous Wireless Sensor Network Ensuring Full Connectivity with Minimum Isolated Nodes. Journal of Sensors. 2014. p. 1–8.
![Figure 1: Intersection of three spheres in 2D [21]](https://thumb-us.123doks.com/thumbv2/123dok_us/8699635.879229/2.612.335.554.507.618/figure-intersection-spheres-d.webp)