Stress-strain properties and micro-structural change in
metal deformed at strain rates of upto 10^5 per second.
HAQUE, Md. Mohafizul.
Available from Sheffield Hallam University Research Archive (SHURA) at:
http://shura.shu.ac.uk/19752/
This document is the author deposited version. You are advised to consult the
publisher's version if you wish to cite from it.
Published version
HAQUE, Md. Mohafizul. (1983). Stress-strain properties and micro-structural change
in metal deformed at strain rates of upto 10^5 per second. Doctoral, Sheffield Hallam
University (United Kingdom)..
Copyright and re-use policy
See
http://shura.shu.ac.uk/information.html
Sheffield Hallam University Research Archive
POLYTECHNIC LIBRARY P O N D STREET SHEFFIELD SI 1 W B
I
Sheffield City Polytechnic Library
ProQuest Number: 10697054
All rights reserved INFORMATION TO ALL USERS
The quality of this reproduction is dependent upon the quality of the copy submitted. In the unlikely event that the author did not send a com plete manuscript and there are missing pages, these will be noted. Also, if material had to be removed,
a note will indicate the deletion.
uest
ProQuest 10697054
Published by ProQuest LLC(2017). Copyright of the Dissertation is held by the Author. All rights reserved.
This work is protected against unauthorized copying under Title 17, United States C ode Microform Edition © ProQuest LLC.
ProQuest LLC.
789 East Eisenhower Parkway P.O. Box 1346
STRESS-STRAIN PROPERTIES AND MICRO-STRUCTURAL CHANGE IN
METAL DEFORMED AT STRAIN RATES OP IJPTO T O 5 PER SECONDBy
MD. MOHAFIZUL HAQUE, M. Sc
A Thesis submitted to the COUNCIL FOR NATIONAL ACADEMIC AWARDS in partial
fulfilment for the degree of DOCTOR OF PHILOSOPHY
SPONSORING ESTABLISHMENT:
Department of Mechanical and Production Engineering Sheffield City Polytechnic
Sheffield, U.K.
COLLABORATING ESTABLISHMENT: British Steel Corporation Sheffield Laboratories
^WfiCHilic
DECLARATION
All the work reported in this thesis was carried out by the candidate at Sheffield City Polytechnic during the period of October 1980 to December 1983.
The candidate has not been a registered student for any other CNAA award or for any University degree, during the period of registration for the CNAA degree of Ph.D.
To the best of his knowledge, the results presented in the thesis originated from the present study, except where references have been made. No part of this thesis
has been submitted for a degree at any other institution.
Signature of Candidate:
CMD. MOHAFIZUL HAQUE)
' 'ACKNOWLEDGEMENTS
The author wishes to express his sincere gratitude to Dr. M S J Hashmi, Principal Lecturer, for his
supervision and guidance and to Dr. E B Pickering, Reader in Metallurgy, for his constructive suggestions and
comments during the course of this project.
The author is indebted to Mr. 0 Bardsley, the former Head of the Department of Mechanical and Production
Engineering for his kind support and to the Authority of Sheffield City Polytechnic for the approval to carry out
this work.
Sincere thanks are also extended to Messrs.
R Wilkinson, P Fisher and D McKay and other technical staff for their support at various stages of this work.
Finally, a word of thanks to my wife for her patience and support towards completion of my work, sometimes at the expense of her own pleasure.
STRESS-STRAIN PROPERTIES AND MICRO-STRUCTURAL CHANGE IN
METAL DEFORMED AT STRAIN RATES OF UPTO 105 PER SECONDM. M. Haque
ABSTRACT
A ballistic test equipment has been designed, constructed and commissioned to facilitate firing of cylindrical
projectiles at speeds varying from 30 to 300 m/s on to small cylindrical test specimen placed on to a rigid
anvil. Compressed air was used to propel the projectile the speed of which before impact was measured using laser-beam interruption device. An IMACON high speed camera was used to continuously record the deformation-time history of the specimen and these records were then used to obtain the prevailing force, strain, stress and strain rate histories during the entire deformation process. The stress-strain curves over large strain ranges were obtained from tests carried out on specimen statically pre-strained to different levels. The effect of strain rate history on the pre-strained specimen was found to be negligibly small and hence ignored. The temperature rise during highspeed deformation and material inertia were assumed to have mutually cancelling effect on the deduced stress values. The effect of friction was found to be significant and appropriate corrections were introduced to account for this effect.
Following the above procedure, the stress-strain
characteristics of structural steel (En-8) at strain rates of up to 105 per second at -30°C, room temperature
and at 235°C have been established. The structural steel has shown a strong strain rate sensitivity within the strain rate range of about 103 to about 105 per
second. Comparative studies showed that copper was more strain rate sensitive than aluminium and steel used in the present investigation.
.There were no marked differences observed in the micro structures of the structural steel specimen deformed quasi-statically and dynamically at -30°C, room
temperature and at 235 C. There was also no distinguish able micro-structural change observed in the structure of aluminium specimen deformed at low and high strain rates but mechanical twinning was observed in the micro structure of copper specimens deformed at high strain rates.
CONTENTS
Page N o .
DECLARATION (i)
ACKNOWLEDGEMENT (i i)
ABSTRACT (iii)
CHAPTER 1
INTRODUCTION 1
1.1 Importance of Stress-Strain Data at High
Strain Rates 1
1.1.1 Blast load resistance and
demolition of structures 1
1.1.2 Forming of metals 3
1.1.3 Dynamic compaction of metal
powders 4
1.2 Review of Previous Works and
Deficiencies 5
1.3 Selection of Test Materials 8
1.4 Aim and Plan of the Present Project 9
CHAPTER 2
DESIGN, DEVELOPMENT AND COMMISSIONING OF THE
EXPERIMENTAL RIG 11
2.1 Introduction 11
2.2 Load Cell and Anvil Unit 11
2.3 Barrel and Loading Throat Unit 12
2.4 2-Way Ball Valve and Reservoir Unit 13
2.5 Construction of the Experimental Rig 14
2.6 Commissioning and Synchronization of the
Experimental Set-up 15
2.6.1 Firing of the Projectile v 15
2.6.1.1 Calibration of pressure
transducer 16
2.6.1.2 Calibration of the
projectile speed 16
2.6.2 Recording the Load-Time History 16
Page No.
2.6.3 Calibration of Speed MeasuringTechnique by Laser-Beam 17
2.6.4 Recording Deformation-Time History 18
2.6.4.1 Positioning of the laser
and photo-cell units 18
2.6.4.2 Delay timing and selection
of lens aperture 19
2.6.4.3 Modification of the
optical extension tube 20
CHAPTER 3
EXPERIMENTAL TECHNIQUE AND PREPARATION OF
THE PROJECTILES AND BALLISTIC TEST SPECIMENS 21
3.1 Introduction 21
3.2 Preparation of the Projectiles 21
3.3 Preparation of the Ballistic Test
Specimens 22
3.4 Operational Technique of. the Camera 24
3.5 Technique for Recording
Time-Deformation History 26
3.6 Calibration of Streak Unit 27
3.7 Loading, Firing and Recording Procedure 28
3.8 Other Electronic Instrumentations
for Recording 29
3.9 Reading under Travelling Microscope 30
3.10 Selection of Curve Fitting Equation 31
3.11 Construction of the Stress-Strain Curves 33
3.11.1 Initial approach 33
3.11.2 Alternative arrangement 35
3.11.3 Technique of the construction
of dynamic stress-strain curve 37
3.11.4 Effect of total deformation 38
3.12 Arrangement for Conducting Tests at
Sub-zero and at Warm Temperatures 39
3.12.1 Arrangement for low temperature
tests 39
3.12.2 Arrangement for high temperature
tests 41
Page No.
3.13 Metallography 43
CHAPTER 4
RESULTS OF THE EXPERIMENTS 44
4.1 Introduction 44
4.2 Results of the Preliminary Tests 44
4.2.1 Effect of strain rate history 44
4.2.2 Effect of total deformation 48
4.2.3 Effect of specimen geometry 50
4.2.4 Effect of friction 51
4.3 Results from the Main Test Programme 54
4.3.1 Stress-strain characteristics
of structural steel 54
4.3.2 Stress-strain characteristics of
aluminium and copper 58
4.3.3 Proposed constitutive equation 59
4.4 Micro-examination of Structures 61
4.4.1 Micro-examination of structural
steel 61
4.4.2 Micro-examination of aluminium
and copper 62
4.5 Error Analysis DO
CHAPTER 5
DISCUSSION OF RESULTS 64
5.1 Introduction 64
5.2 Effect of Strain Rate History 64
5.3 Effect of Pre-straining 66
5.4 Effect of Specimen Geometry 67
5.5 Effect of Radial Inertia ■ ____ 69
5.6 Effect of Friction 71
5.7 Temperature Rise during Deformation 72
5.8 Comparison of Dynamic and Static Stress-Strain Characteristics of En-8
Steel at Different Temperatures 74
Page No.
5.8.1 Quasi-static stress-straincharacteristics 74
5.8.2 Dynamic stress-strain
characteristics 76
5.8.3 Strain rate sensitivity 76
5.9 Comparison of Dynamic and Static Stress-Strain Characteristics of Aluminium
and Copper 78
5.10 Metallographic Studies 81
5.10.1 For En-8 steel 81
5.10.2 For aluminium and copper 83
CHAPTER 6
CONCLUSIONS 85
LIST OF TABLES 88
LIST OF FIGURES 149
REFERENCES 238
APPENDIX A-1
(vii)
CHAPTER 1
INTRODUCTION
1.1 Importance of Stress-Strain Data at High Strain Rates
Data on the mechanical behaviour of metals at very high strain rates are required for a variety of reasons. From the theoretical stand point, there is a need to study the rate-controlled mechanism for plastic flow which, in many materials has been found to change when the strain rate exceeds about 10** per second' (1). From the practical stand point, strain rates of this order, and above are encountered in many real engineering
situations and applications. The broad band of practical topics are in the field of the following:
(i) Spalling, fracture, elastic wave propagation,
cracking and deformation in the field of demolition, (ii) High energy rate metal forming processes, (iii) Dynamic metal powder compaction.
1.1.1 Blast load resistance and demolition of structures:
Materials are often subjected to rapidly applied loading when used as construction material in certain structures which may undergo high intensity impulsive or shock
loading. Due to rapid unloading and the reflection of compressive stress-waves from a free surface, scabs or
-spalls may be formed in hard concrete or steel which may acquire speeds of the order of 100 m/s (2), and hence be lethal. Also fracture due to unloading - even more than loading in a (composite) concrete building structure may lead to large scale dynamic, catastrophic "knock on" collapse.
The demand in recent years for large ana relatively cheaper building structures has promoted the development of several new varieties of design and the imaginative structural use of concrete which may be reinforced, pre stressed or. post-tensioned, with steel bar. This has
given rise to buildings with a considerable sophistication in the structural design. The ability of these buildings to withstand blast loading effect require to be assessed which in turn requires high strain rate data. The
demolition of such buildings at the end of their useful life is also a complex operation. The non-critical severing or removal of only some stressed elements in some of these modern, large and continuous structures may well lead to disastrous dynamic collapse. Demolition work therefore, must be approached with great caution; straightforward demolition, for example, by swinging a heavy steel ball, will often be quite inadequate for these modern structures whether it be accompanied by the use of explosives and drilling or not.
For demolition of other structures such as railway
bridges, factory chimneys and the removal of foundations
-2-and buildings shot-hole charges tend to be used (3).In the breaking up of heavy plant such as acid pot s , retorts and boilers etc. by concussion charges and the cutting of concrete, steel and wood etc. "lay on" charges are usually employed. However, from an engineering point of view, this has important design aspects for a variety of structures which may go shock loading.
1.1.2 Forming of metals:
The principal use which metal processing engineers have for conventional strain rate data is to facilitate predictive calculations for tool pressures or loads developed in causing a certain operation or process to take place. In structural applications, small plastic strains in metals, beams or frames and the like, would be of interest whereas in the case of metal forming,
large plastic strains are involved. But in both kinds of applications, interest in mechanics.of fracture and
stress-wave or shock effects is always present. The
structural engineer very occasionally meets with cleavage fracture and elastic waves, but the manufacturing engineer may come across ductile fracture processes, problems of
tensile instability (especially in sheet metal) and
reasons such as ageing and change of failure modes (4). Strain rate has greater effect on the flow stress in hot working range and relatively smaller effect in cold
working range, this applies especially when large strains are imposed. The choice of appropriate strain rate is also important in superplastic metal forming processes. The amount of plastic flow in this case is usually very high. Interest in impressing a super-alloy composite (5) arises from the need to use new materials for turbine discs and the like, so that they can operate successfully in advanced high temperature turbo-plant. It is important to know the strain rates and temperatures in order to
avoid excessive damage in the forming of such materials.
1.1.3 Dynamic compaction of metal powders:
In recent years, metal powders have been prepared and made commercially available on a large scale, for
conversion into engineering components directly by means of quasistatic compaction processes. Powder metallurgical fabrication techniques have been developed because (a) for some components and materials, established forming methods are unsuitable, e.g. there are difficulties with
refractory metals in melting and cutting; (b) savings on material wastage or in machining costs are possible and worthwhile, e.g. with many iron-based klloys; and (c) they afford greater control of structure, e.g. grain size and component distributions are more homogenous.
However, dynamic compaction appears to have
-4-originated in about the 1950’s in the belief that compact properties such as uniform density, improved green strength and lower ejection forces from dies and containers, as well as increased production rates, could be secured by this means. Uniaxial and isodynamic
compaction systems are found to be most suitable * arrangements for industry. Ballistic and explosive
uniaxial compaction presses are said to operate at strain rates of upto 102 to 103 per second respectively (6). Magnetic and explosive isodynamic compaction systems have been tried but details of press design and product
properties are not available. Therefore, fundamental informations about the stress-strain properties of metal powders at high strain rates are necessary to secure better compaction systems.
1.2 Review of Previous Works and Deficiencies
As early as the 1930’s and probably earlier,
investigators (7-9) attempted to measure the effects of deformation rate upon the resultant mechanical properties of the deformed metals. Since then, however, there has been significant developments in forming processes
involving high strain rates at large values of strains. Electro-magnetic, explosive-hydraulic and some of the conventional forming processes are said to generate
strain rates of upto 105 per second (10). The conventional tensile and compression tests are normally made at
contrast, many forming and machining processes are said
to be carried out at strain rates in the range 103 to 106
per second or even higher (11). Although tensile and
compression tests have been performed successfully at
strain rates upto 103 per second, but difficulties are
encountered with these methods in making the necessary
measurements in the extremely limited time during which
the applied load acts.
/'
A review of recent literature shows that since the
introduction of split Hopkinson pressure bar by Koisky (12),
considerable efforts by various investigators (13-15)
have been directed to evaluate the stress-strain
characteristics of metals at high rates of strain,
usually between 10I+ and 103 per second. In this respect,
various high speed impact apparatus and associated
techniques have been devised to affect and record the
deformation-time and load-time histories. Flat ended
mild steel projectiles as test specimens fired against a
rigid anvil enabled others (16,17) to derive the yield
stress from known impact velocity and the final shape of
the projectile. However, recent experimental efforts
consisted of uniaxial compression using specially designed
drop hammer (14,18) and ballistic tests (15) on strong
material. Holzer and Brown (14) tried to obtain the
deformation-time history using fibre optics non-contacting
transducer which required elaborate computation for inter
polation purpose while the use of high speed camera in
framing mode in conjunction with separate optical system
-by Gorham (15) involved tedious measurement on each frame. In addition, with the fast loading rates and limited test durations that are encountered in such
situations, frequency dispersions of the stress pulse in the load:'measuring system is significant. Consequently, converting these raw data by various mathematical .and computer manipulations, into useable form introduces the possibility of incurring errors of unknown degree.
Furthermore, the variation of strain rate during
deformation was not properly accounted for in the process ing of the data and in the presentation of results.
/ /
/ However, a review of previous works (13 - 23) also
shows that the material inertia (19), stress wave propagation (20), highly localised temperature effect
(13,14), adiabatic shear bands (21,22) and the bulk effects (23) appear to have caused many conflicting observations and contradictory conclusions.
On the basis of the information available in the
upto-date literature, it appears that there is no definite mechanism of predicting macro-deformation and failure
modes of engineering components at high strain rates. Therefore, analysis of the forming and cutting processes and prediction of structural collapse and catastrophic failure, require more data and better understanding of the material behaviour at high strain rates. To analyse these processes effectively, the corresponding stress-strain properties must be known but unfortunately, at the present
-7-time very little reliable published information is available. However, a consideration of the past works suggest that an attempt, employing new experimental technique as well as the displacement-time measuring equipments, is necessary. These were the main
motivating factors behind the present study to explore further investigation on the subject.
1.3 Selection of Test Materials:
For the present investigation, three different materials were chosen, (i) structural steel (En-8), / (ii) aluminium and (iii) copper. Aluminium and copper
/
/ have been selected arbitrarily to conduct experiments at room temperature only. However, the En-8 steel has been selected because of the following applications:
The En-8 steel resembles one of the important varieties of steels, which is subjected to stresses in machine parts. This type of medium carbon steel is also used for both the construction and transportation
industries for making components which are directly or indirectly subjected to dynamic loading. The main — advantage of this steel is that it enables people to
build lighter but relatively high strength structures while retaining the highly desirable properties of easy workability and adaptability. The structural steel
is also easily available in plate, slab, bar and rod
varying the amount of carbon, manganese and silicon
contents and it does not necessarily include the alloying elements such as chromium, vanadium etc.
1.4 Aim and Plan of the Present Project
The present research project has been undertaken with the following aims of investigation:
To (a) develop a suitable testing technique and method of processing the displacement-time data for establishing the stress-strain properties of metals and
/
/alloys at strain rates of upto 105 per second, /'
j
/ (b) establish the stress-strain characteristics
of structural steel, aluminium and copper at these high rates of strain at room temperature,
(c) establish the stress-strain characteristics of structural steel at sub-zero and at warm temperatures, and compare with those at room temperature,
(d) study micro-structural changes corresponding to these high strain rate deformations, and finally
(e) compare the results with the existing data available in the literature.
In order to achieve the above objectives, it was
necessary to design and develop a dynamic compression test rig capable of firing projectiles to impact on to the
specimen directly. Therefore, the basic experimental
-9-technique used in this study involved firing of a
cylindrical projectile on to small disc shaped specimen placed on a rigid anvil. Compressed air was used to propel the projectile and as of interest the load-time history was also measured by using a high frequency piezo electric load-cell and pressure bar arrangement. This measured load-time history was not used for actual
derivations of the final results. In order to facilitate recording of deformation-time history, a high speed image converter (IMACON) type camera was used which is capable of recording the event at a framing rate of upto 106 frames per second and a.lso in a continuous streak mode.
-10-CHAPTER 2
DESIGN, DEVELOPMENT AND COMMISSIONING OF THE EXPERIMENTAL RIG
j
2.1 Introduction
A schematic diagram of the experimental rig with its other accessories is shown in Fig. 1, whilst Fig. 2
shows a photograph of the experimental set-up. The test rig mainly consisted of (a) Load-Cell and Anvil Unit, (b) Barrel and Loading Throat Unit and (c) 2-Way Ball Valve and Reservoir Unit. For convenience, assembly drawing of the experimental rig was grouped into three sections. Details of each sub-assembly drav/ing are shown by line diagrams in Figs. 3 to 5 and the sectional
drawing of the individual components are shown in Figs. 6 to 10 inclusive, all dimensions being in millimetre. The fundamental design calculations are shown in
Appendix A to E.
2.2 Load-Cell and Anvil Unit
A schematic diagram of this section in assembled condition is shown in Fig. 3. This unit is composed of 8 individual components listed as follows: (i) Base plate, (ii) Back-up anvil, (iii) Holder plate, (iv) Pressure bar, (v) Middle anvil, (vi) Load-cell, (vii) Top anvil and
(viii) Cover plate. The detail line diagrams of these parts are shown in Figs. 6 a,nd 7.
-11-A robust cylindrical alloy steel (En-32) bar was used as the main pressure bar or anvil column. The top
end of which is recessed to incorporate a 80 kHz piezo electric load-cell and the top and middle anvil pieces which are made of tool steel (FMP-338). All the anvil pieces including the pressure bar were hardened by special heat treatment. The load cell is placed in between the middle and top anvil pieces. These parts are held in place by means of the top cover plate and a holder plate which in turn is fastened to the base plate at the bottom end of the pressure bar. The whole arrangement was put under 2 kN of compressive pre-load and securely attached to the base plate. The base plate is a rectangular
solid En-12 steel plate having a central recess for the insertion of the back-up anvil, which is also fixed onto the reinforced concrete foundation of the test rig. All the mating surfaces of the assembly were machined and ground to a mirror finish.
2.3 Barrel and Loading Throat Unit
Assembled drawing of this section in line diagram is shown in Fig. 4. This unit is composed of 8 individual components listed as follows: (i) Extension barrel,
(ii) Surge suppressor cap, (iii) Coupling sleeve,
(iv) Loading throat, (v) Split cover, (vi) Sliding collar, (vii) Collar nut and (viii) Projectile gripper mechanism. The detailed line diagrams of these parts are shown in Fig. 8.
-12-The extension barrel is made of En-16 steel at one end of which is attached a surge suppressor cap. The
suppressor also permits the laser beam to pass through it. The other end of the extension barrel is connected to the loading throat (primary barrel) by means of a threaded and knurled coupling sleeve. The loading throat is made of En-32 alloy steel and its top end is fixed to the air release valve nut. There is a cut-out segment of the primary barrel through which the projectile can be loaded and pushed upwards inside the projectile gripper mechanism. A close fitting split cover made of En-32 alloy steel is used to close the cut-out segment, and a sliding collar and nut is used to firmly hold the assembly in place, thus preventing escape of the high pressure air upon release of the valve.
The projectile gripper mechanism consists of three grab screw and spring operated smooth pins (hardened En-32 alloy steel) incorporated at the upper end of the loading throat. The projectile holding pressure may thus easily be adjusted to suit projectiles of different
masses. The coupling sleeve provides two holes in order to fix stop pins used to prevent the collar nut from sliding down.
2.4 2-Way Ball Valve and Reservoir Unit
The line diagram of this section in assembled
condition is shown in Fig. 5 and those of the individual
-13-parts are shown in Figs. 9 and 10. The two main
components are (a) the high pressure reservoir unit and (b) a 2-way ball valve. The ball valve of 1" B.S.P. (Part No: 012-25-34) specification is suitable for
operation at pressures of upto 4700 psi at temperatures in between -30°C to +100°C, and is manually operated by turning a handle through 90°. This valve is firmly fixed to the bottom end of the pressure chamber by means of the valve nut. Copper gasket is used to make the assembly leak proof. The pressure chamber and valve assembly
is rigidly secured to the frame of the rig by means of the holder plates specially designed for this purpose. The top end of the pressure chamber was made with appropriate connection facilities to the high pressure (2000 psi) air cylinder.
2.5 Construction of the Experimental Rig
Once the iiidividual components .were made, they were then assembled together and fixed to the frame of the rig.
This frame was made of welded and bolted mild steel angles and is 2 metres high overall and about half a metre square in plan area. Two platforms were provided, each on the opposite side of the rig in order to fix the laser beam generator and receiver. A small safety chamber was built using wire mesh material and perspex sheet to
impact. Two Xenon flash units were placed outside this safety chamber. The front wall of the chamber was made with 20 mm thick armour glass plate. This was necessary
to focus the specimen as well as to prevent any possible damage to the camera by the deformed specimen. The back wall can be easily opened and closed in order to p-lace
the specimen onto the anvil as well as to remove the specimen and the projectile after each test.
The entire rig with its frame was erected on a cubical reinforced concrete foundation built over the cemented
floor.
2.6 Commissioning and Synchronization of the Experimental Set-up
Commissioning of the testing rig was carried out by conducting initial tests in order to standardise and
calibrate the facilities for (a) firing of the projectile onto the compression test specimen, -(b) recording the load-time history using 80 kHz piezo-electric load cell and pressure bar arrangement, (c) measuring the initial impact speed and (d) recording the deformation-time
history using high speed image converter (IMACON) camera.
2.6.1 Firing of the projectile
For trial operation, a number of projectiles were made from tool steel. These were fired at different speeds onto the specimens prepared from mild steel. The rig was found to be satisfactory for firing the projectile
-15-in order to deform the specimen upto 80% reduction -15-in height. This facilitated selection of the appropriate size of the projectile and specimens to be used in proper testing programmes.
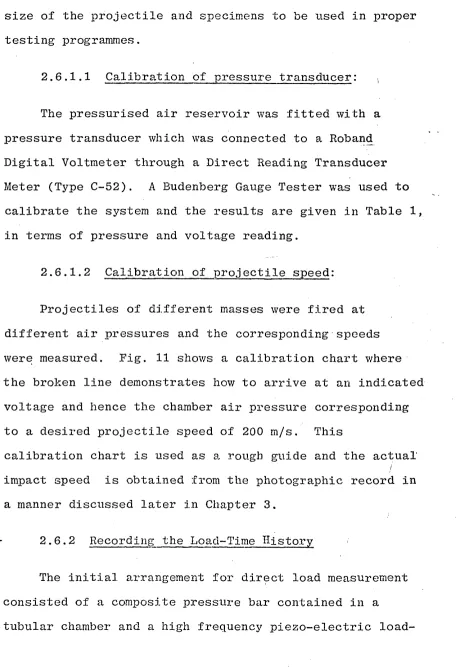
2.6.1.1 Calibration of pressure transducer: .
The pressurised air reservoir was fitted with a pressure transducer which was connected to a Roband Digital Voltmeter through a Direct Reading Transducer Meter (Type C-52). A Budenberg Gauge Tester was used to
calibrate the system and the results are given in Table 1, in terms of pressure and voltage reading.
2.6.1.2 Calibration of projectile speed:
Projectiles of different masses were fired at different air pressures and the corresponding speeds were measured. Fig. 11 shows a calibration chart where the broken line demonstrates how to arrive at an indicated voltage and hence the chamber air pressure corresponding to a desired projectile speed of 200 m/s. This
calibration chart is used as a rough guide and the actual
/
impact speed is obtained from the photographic record in a manner discussed later in Chapter 3.
2.6.2 Recording the Load-Time History
The initial arrangement for direct load measurement consisted of a composite pressure bar contained in a
tubular chamber and a high frequency piezo-electric load
[image:28.617.89.547.76.743.2]-16-cell (80 kHz) which could be located at different positions along the length of the pressure bar. The
load-time traces obtained from similar tests with the load-cell at different positions along the composite pressure bar are shown in Fig. 12. It is evident that the load-time trace is affected if the position of the load cell is changed. However, all of these measured loads produced stress values even lower than those
obtained from static tests. Subsequently, it was decided that the measured load would not be used to calculate the stress values but for reference only.
In order to check the repeatability of the load-time histoiy and that of the projectile speed, a projectile was fired at the same air-pressure to obtain a desired
speed of 132 m/s for a given set of experiments. Fig. 13 shows the repeatability of load-time traces during impact whereas Fig. 14 shows the repeatability of the elapsed time:covered by the projectile (19.07 mm long) before
impact.
2.6.3 Calibration of Speed Measuring Technique /
I
by Laser BeamIn order to assess the accuracy of speed measurement * by laser beam, first a thin rigid disc (15 cm dia.) of
aluminium was firmly attached to a motor whose r.p.m. was controlled by a Servo Motor Controller (Type MC-43). A small hole (3 mm dia.) was made at a known radius from the
-17-centre of the disc to allow the laser beam to pass through. A photo-cell unit of response time of 5 ns was positioned to receive the beam through the hole in the disc. A
schematic diagram is shown in Fig. 15. The photo-cell unit was connected to a pre-calibrated storage
oscilloscope. As soon as the motor was run at a known r.p.m, the beam remained obstructed intermittently by the disc and the photo-cell unit received signal only when the beam passed through the hole after each revolution.
Instantaneously, the photo-cell unit transferred the signal to the oscilloscope screen. The elapsed time during which the beam was obstructed by the solid disc was recorded on the oscilloscope screen. From the known distance covered and the elapsed time, it was possible to calculate the speed of the disc. Now, comparison was made with this calculated speed and the actual speed of the motor as precisely regulated by the speed controller,
which showed only 3% variation.
2.6.4 Recording Deformation-Time History
2.6.4.1 Positioning of the laser and photo-cell,- — -
I
units: '
In order to obtain a useful photographic record, it *was necessary to synchronise the camera and the flashing
of the flash units with the impact. The flashing time was controlled by the Trigger Delay Generator (TDG) unit and this timing was again dependent on the height of the
-18-laser beam from the top of the test specimen as well as on the speed of the projectile. In order to maintain a constant beam height throughout the experiment, it was therefore, necessary to fix the laser and the photo-cell units at a certain position. The beam was positioned at a height of about 35 mm from the top of the specimen and the flash units were then attached to the frame one at opposite side of it as shown in Fig. 1.
2.6.4.2 Delay timing and selection of lens aperture:
Once the beam height was fixed, it was possible to determine the expected time of impact and accordingly the delay time was adjusted using the TDG unit. When the beam is cut off by the high speed projectile, the TDG unit starts counting and the Xenon flash lamp flashes just after the pre-selected delay period. As soon as the event becomes luminous, a photo-cell detector triggers the camera to record the sequence of deformation.
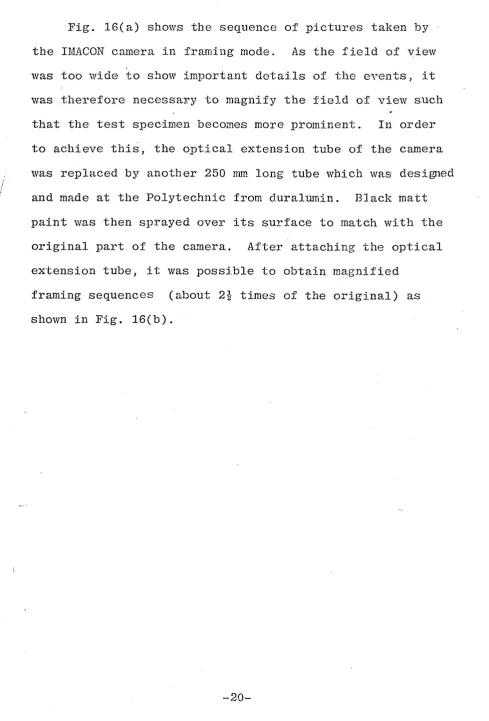
2.6.4.3 Modification of the optical extension tube:
Fig. 16(a) shows the sequence of pictures taken by the IMACON camera in framing mode. As the field of view was too wide to show important details of the events, it was therefore necessary to magnify the field of view such that the test specimen becomes more prominent. In order to achieve this, the optical extension tube of the camera was replaced by another 250 mm long tube which was designed and made at the Polytechnic from duralumin. Black matt paint was then sprayed over its surface to match with the original part of the camera. After attaching the optical extension tube, it was possible to obtain magnified
[image:32.614.63.553.46.768.2]CHAPTER 3
EXPERIMENTAL TECHNIQUE AND PREPARATION OF THE PROJECTILES AND BALLISTIC TEST SPECIMENS
3.1 Introduction
A series of experiments were carried out in order to standardise the testing procedure to obtain accurate results using the experimental set-up described in the previous chapter. For each experiment, attempts were made to maintain identical conditions in order to compare the results for establishing most appropriate test procedures. Details of the experimental procedure are described in the following sub-sections.
3•2 Preparation of the Projectiles
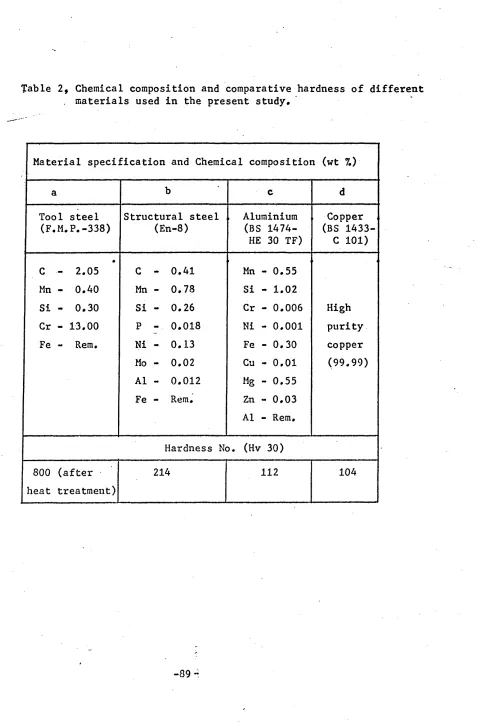
For the projectile, tool steel (type FMP-338) was chosen, since this material has very high strength and high resistance to impact. Furthermore, it was heat-treated to induce desired hardness and was found to be about 800 Hv 30. The composition of this material is shown in Table 2(a).
The projectile was machined to a diameter of 9.52 -.001 mm to fit closely within the loading throat.
The length of the projectile was made about 19.00 mm. It was finely ground and polished resulting in a
mirror finish surface. Using this projectile, it was
-21-only possible to obtain stress-strain results corres ponding to strain rates ranging from about 1 x 10L* to about 2.5 x 10⁴ per second. In order to obtain results corresponding to strain rates in excess of about
2.5 x lO4 sec” 1 some lighter projectiles were
subsequently made from the same material. The projectile was made lighter by .drilling a 5 mm diameter blind hole
into it as shown in Fig. 17. Using this lighter projectile results corresponding to strain rates of upto about
4 x 10⁴ sec” 1 were obtained. In order to carry out comparatively low strain rate experiments, between
7 x 1 0 3 sec"1 and 1 x 10⁴ sec"1, 30 mm long projectiles were used. A threaded hook was screwed on the top of the projectile to facilitate its upward lifting by a string through the hole of the extension barrel. This extra arrangement was necessary because of the shorter length (22 mm) of the cut-out segment in the primary barrel.
In order to obtain stress-strain results in excess of 4 x 10^ sec- 1 , it was necessary to use a different loading throat - extension barrel unit which facilitated 8 mm diameter projectiles. Furthermore, it was made lighter by drilling a 5 mm diameter blind hole into it. Using this smaller projectile, it was possible to obtain stress-strain results at strain rates of upto about
1 x 10⁵ per second.
3.3 Preparation of the Ballistic Test Specimens
The ballistic test specimens were prepared from
structural steel (En-8), aluminium and copper. The compositions of these metals and alloy are shown in Table 2. All the specimens in the present work were machined from as-received 15 mm round bar. In order to
avoid barrelling or buckling, all the compression test specimens were made to a length to diameter ratio *of less than one for both dynamic and quasi-static tests. The specimen surface was finely ground and the end faces were made as flat and parallel as possible.
For making specimens from pre-strained material, small samples of 15 mm diameter and 14 mm long were cut from the as-received 15 mm round bar. These were quasi-statically compressed to different strain levels using a 50 Ton Universal Machine and a sub-press fitted with a dial gauge. During pre-straining, graphite in grease was used as lubricant to minimise friction at the specimen-platen interface and thus induce deformation more
uniformly throughout the specimen. After each 10% of strain, the test was interrupted and the interfaces were cleaned and relubricated. Ballistic test specimens of different sizes were then prepared out of these
compressed samples. For carrying out comparatively low strain rate (7 x 10³ sec-1 ) tests, specimens of 6.5 mm diameter and 6.00 mm long were used whereas, for medium high strain rate (2 x 10lf sec-1 ) tests and very high
of each specimen were measured individually by a micro meter and the specimens wereput in separate envelopes having appropriate notes for identification. Before a dynamic test was conducted, the contacting faces of the specimen, the anvil and the projectile were cleaned with acetone.
3.4 Operational Techniques of the Camera
For recording the deformation history of any specimen the following steps were undertaken.
After positioning the test specimen on to the anvil,
I
the camera v/as directed towards it and aligned by !
switching to the focus mode. For focussing purpose, some lighting was necessary. Two desk lamps were used to provide adequate illumination of the specimen. At this stage, if the capping shutter was opened, the image could be viewed on the output screen. The fine focussing was carried out with a magnifier inside the viewing hood and adjusting the lens focus by means of a remote control. The cross point graticule was then inserted into the
left slot of the Imacon tube. It was necessary to locate the exact position, where the operating streak optics
needed to be placed. After fixing the position, the cross ‘point graticule was removed and a streak optic with a slit
opening of 100 micron was placed. A pre-calibrated slow streak unit (SS/CV type) was used and the streak speed was selected at 1 micro-second per 2.00 millimetre of the
-24-sweep. After fitting the streak optic, the camera was switched to operate mode. By turning the lens aperture disc, it was set at position marked 16 which was found to give a better-quality picture.. The film backing unit was then loaded with high speed polaroid film (type 47) and pushed upto the appropriate position for recording the deformation-time history. During these steps, it was essential to take the following operational safety precautions in order to obtain better and consistent results from the IMACON high speed camera.
I
j
(a) It was noticed during the operation of the cam era that about 2 minutes delay was necessary after
switching the camera from focus to operate mode, other wise a square shape white shade (fog) was observed on the photographic trace of the polaroid film. It is believed that with a static image in focus mode, the phosphor
(photo luminescent) of the image tube stores the image for a while. In normal incident light, this is not
visible but is bright enough to cause an image on the film when a picture is taken. After being in focus mode for a
considerable time, it is advisable to leave the camera in operate mode for a few minutes to allow the image to
disappear.
(b) When the plug-in units (either framing or streak) operate at a very high voltage, the capacitors within
voltage into a conducting medium. This was usually achieved by placing the pins of the plug-in units on a flat conductive surface.
(c) Before each re-loading of the polaroid film, it is essential to clea.n-up the rollers of the film backing unit with a soft cloth to remove any dirt or chemical from the previous film which may damage the subsequent film.
3.5 Technique for Recording Time-Deformation History
/
/ The framing photography as shown in Fig. 16 was
/ found to be inadequate to give a continuous record of the interaction between the projectile and the specimen.
Furthermore, measurements on each frame, in order to
construct the strain history of a specimen, were found to be tedious and sometimes unreliable due to the change in detum betweeen the frames. Many accurate measurements of deformation in one axis over a very short time are
possible by operating the camera in streak mode. The line diagram shown in Fig. 18(a) describes the principle of streak photography. A detailed time-deformation
history can be obtained with this arrangement. The camera looks through a 0.1 mm wide slit perpendicular to the
projectile-specimen contact faces and records the event
of the projectile impacting on to the specimen and
deforming i t . The result is an accurate and continuous record of time-displacement history of the projectile and strain history of the specimen as both the projectile and
-26-the anvil are considered to be rigid. The rigidity of
the anvil was confirmed by investigating streak
photographs under travelling microscope which revealed no measurable deviation of the anvil top face during
compression of the specimen. A clear band and continuous picture of the projectile-specimen contact interfa-ce is shown in Fig. 18(b). Hence, framing unit was replaced by streak unit to carry out the main experiments. The framing mode of photography was used to study the mode of overall deformation of the specimen during high strain /
/rate experiments.
3.6 Calibration of Streak Unit
The streak mode unit of the IMACON camera was
accurately calibrated before the dynamic test programme was started. This was done by first feeding pulses of mark/space ratio of 1:10 from a pulse generator (type TSA 628) into a storage oscilloscope to obtain time/
distance values. The streak optic of the camera was then carefully masked to provide an aperture opening of about 100 micron in diameter. The pulse generator was then connected to the input terminal of the camera. The storage oscilloscope was left connected to the pulse
the input pulses to those measured from the photograph, the actual operating speed of a streak unit was determined. This actual streak speed was then used to measure the
time-displacement data from the photograph obtained during dynamic tests. Throughout the test programme, the strekk speed was checked several times using t*he same procedure and the necessary correction, if any, was made accordingly.
3.7 Loading, Firing and Recording Procedure
Once the camera was set to take pictures and the 2-way ball valve was in closed position, the projectile was then put inside the loading throat through the
entrance slot and pushed up into the gripper mechanism and kept in suspension. The slot opening was then closed with the split cover and the sliding collar was slid over and clamped using the coilar-nut as shown in Fig. 4. The valve of the compressed air cylinder was then opened
slowly and kept open until the reservoir air pressure reached the predetermined level as indicated by the pressure transducer meter attached to it.
The whole system i.e. the charge amplifier, the
oscilloscope, the flash and the TDG units were then reset and it was made sure that the laser beam was in correct position. The whole set-up was then ready to receive signals. Checking was done once again prior to firing which was achieved by pressing down the handle of the valve. In the course of its travel through the barrel at
-28-a very high velocity, the projectile cut off the l-28-aser beam before impacting onto the specimen and deforming it
within a few micro-seconds.
As soon as the beam was cut off by the projectile the whole system responded instantaneously. The camera recorded the events for about 35 micro-seconds of
duration. The film holder was then pushed down and the film was pulled out of the camera after a delay of about 20 seconds and the developing solution was applied on to the picture.
3.8 Other Electronic Instrumentations for Recording
i
(a) Charge amplifier: A Kiag Swiss 5001 type charge amplifier was used for amplifying the load signal from the piezo-electric load cell of maximum capacity of 60 kN.
(b) Oscilloscope: A Philips PM 3310 type (0-60 MHz)
/
oscilloscope was used for recording the load-time history. As soon as the projectile struck the specimen, the load produced due to impact was transmitted through the load
cell to the oscilloscope. On the oscilloscope screen, the analog signal represented the magnitude of the load in the Y-axis and that of the deformation time in the X-axis. The recorded trace was then transferred via the X-Y recorder onto the graph using a suitable scale. The speed of the projectile just before impact was also
obtained from the recordings on the oscilloscope of the interception of the laser beam.
-29-(c) Recorder: A Bryans (26000 series, model A4) portable X-Y recorder was used for plotting the load-time curves and the elapsed time recordings during which the beam was obstructed by the projectile.
3.9 Reading under Travelling Microscope
The photograph obtained from the IMACON camera
represents the time-deformation history of the specimen and also the time-displacernent history of the projectile. The time (t) in the horizontal and the displacement (d) in the vertical directions were calibrated with respect to the operating streak speed and the magnifying factor respectively. Since the streak speed was known, there fore, it was possible to determine the displacement
covered in a given time period. The photograph was firmly attached to the platform of the travelling microscope and it was aligned with the horizontal vernier before taking any measurement. On the photographic trace, the straight part represents the zone of free flight just before
impact. The slope of this straight part was used to determine the speed of the projectile before impact. Starting from the specimen-projectile contact point
(t = 0, d = 0), the displacement co-ordinates were measured at every micro-second interval. It was necessary to
establish the magnifying factor for each and every set of tests and analyse the photographic record accordingly. The magnifying factor was obtained by dividing the height
-30-of the specimen in the photograph, by the actual original
height of the specimen. All the displacements from the
photograph were then divided by the magnifying factor to
obtain actual displacements.
3.10 Selection of Curve Fitting Equation
Table 3 shows a comparative chart of the displacement-
time values calculated using different mathematical
expressions for 0% pre-strained specimen. In order to
obtain the values of the unknown constants of these
equations which give closest fit of the displacement data
to those measured experimentally, an iterative computer
program was necessary.
Fig. 19 shows the values obtained by equation No: 4
i.e. Y = Cit + C2
1n are the closest- to the measured values
compared to those obtained according to curves 1, 2 and 3.
For this curve, the value of 'n should be greater than 2
but for low total deformation good matching becomes
difficult for V greater than
2. Therefore, finally a fourth
order polynomial equation of the following form
Y = Cit + C
2t2+ C
31
-3+ C^t4
was chosen.
The experimental displacement-time data were then used
to feed directly into'a desk-top computer and the following
calculations were carried out by using a computer program.
Velocity of compression at time t, V-j- =
Force on the specimen at time t, F+ = Mass of
dVt
projectile X
-I •£
Stress on the specimen at time t, o-^ “
where,
A-j; is the cross-sectional area of the specimen at
time t,
Strain of the specimen at time t, et = -^n^
1o/^
1t^ where,
hQ and h^. are the original height a.nd. the height at
time ’t' of the specimen respectively, and
V t
Strain rate at time t,
= “
Following the above calculations, the stress-strain
results obtained by using equations (4) and (5) are shown
in Fig.
2 0.
It shows that, although the displacement-time
data given by equations (4) and (5) were very close to
those obtained experimentally, as shown in Fig. 19, the
stress-strain results calculated based on them differ
considerably. However, for the present study the equation
No. 5, has been selected and the reasons for this already
described above.
3.11 Construction of the Stress-Strain Curves
3.11.1 Initial Approach:
The original aim was to derive the strain-time,
velocity time, strain rate-time and area-time values from
the photographic record. The corresponding force-time
traces obtained from the load cell would then be used in
conjunction with the area-time values to calculate the
stress-time values for a known strain rate which remains
fairly constant during the initial part of the total
deformation-time history.
-32-The measured force—time trace for a typical test is
shown in Fig. 21, indicating severe distortion,
attenuation and phase-shift, especially during the first
few vital microseconds. It is envisaged that the following
possible factors might affect the recorded load-time
history during high speed deformation.
(a) Effect of stress wave: When one end of a long
bar is impacted by means of a rigid striker, a longitudinal
stress wave is generated at the point of impact which
propagates through the bar. In the present study, when
the projectile struck the specimen, the load produced due
to impact was recorded using a load-cell and was stored
in a storage oscilloscope, the signal being transmitted
through a charge amplifier to the oscilloscope and
displayed on to the screen. It is thought that the
stress waves reflected from the projectile caused the
distortions and may be explained by considering the
propagation of stress wave through the projectile soon
after impact.
The speed of the elastic stress wave, Ce = /E/p" for
steel was found to be about 5.167 mm/ys, using
E = 210 x 10s N/m
2and p = 7.862 x 10
3Kg/m3. Immediately
after impact, a compressive stress wave will travel through
the 19 mm long steel projectile which is subsequently
reflected from its free surface as a tensile stress wave.
This tensile stress is an unloading wave and thus the
reflected tensile wave will have a reducing effect on the
-incident compressive wave. Let 'L ' by the length of the
projectile. At the end of the time ’t' = 2L/Ce, therefore
a slightly reduced compressive force will be experienced
at the projectile-specimen interface. The calculated
time 11 T in the present case was found to be about 7.5 ys
using L = 19 mm and Ce = 5.167 mm/ys. Hence, the magnitude
of the force after this period would be affected and the
recorded force-time history shown in Fig. 21 clearly
demonstrates this effect. It is also noticeable from
this figure that the fluctuation is repeated several times
after each 7.5 ys interval making a hump on the force
time trace. The stress wave space-time diagram may be
constructed as shown in Fig. 22, Only the first stage of
stress wave propagation is shown in this figure, since
after this stage, the stress wave propagation becomes
even more complex.
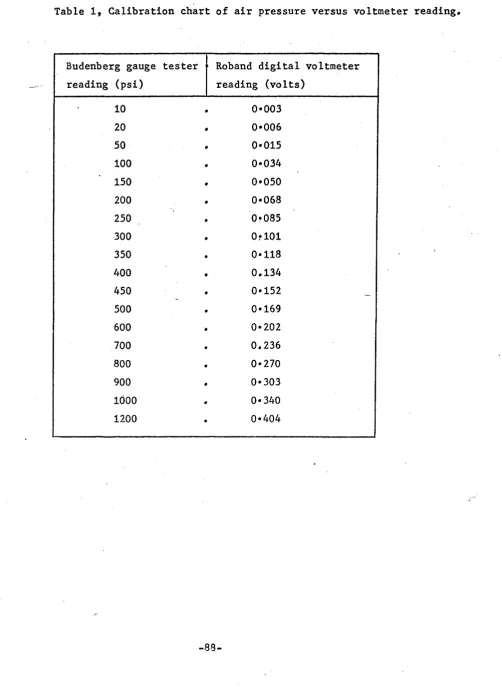
(b) Effect of size of the top anvil and position
of the load cell: In order to establish the
effect of the length of the anvil piece and the position
of the load cell on the recorded load-time trace, several
experiments were carried out by altering the position of
the load cell and the length of the top part of the
pressure ba,r. Fig. 12 shows that there was no real
consistency in the results, although the overall pattern of
the load-time traces was the same.
Furthermore, the projectile strikes a specimen of
different dimensions and material which is placed upon an
[image:46.613.88.508.28.675.2]4-anvil of different dimensions and material. It is believed
that these dimensional and material differences would also
have some attenuation effect on the recorded force-time
history.
(c) Effect of inherent response characteristics of
the recording devices: The inherent response
characteristics of the charge amplifier and the storage
oscilloscope may also affect the recorded load-time trace.
It was observed during the calibration of the oscilloscope
that when a monitor square shaped signal was fed into it,
the output signal was found to be somewhat distorted.
Therefore, all the aforesaid factors were either
directly or indirectly affecting the true force-time tra.ce
during the high speed deformation and these tra.ces could
not be used to deduce the stress values. Indeed the
stress values calculated using this measured force values
were found to be lower than those obtained from the quasi
static test as shown in Fig. 2-3. The technique was,
therefore, abandoned and an alternative method of obtaining
the force-time histories was sought and developed.
3.11.2 Alternative arrangements
Subsequently, alterations were made to the anvil and
pressure bar assembly, replacing the composite pressure
bar system with a massive rigid block (hardened alloy
tool steel, En-32). The load cell and the smaller top
anvil were also incorporated so that the load-time
-histories could still be recorded despite their distorted shapes, for the purpose of comparison only. After
spending a considerable length of time and effort to rectify the situation, it was finally decided that the force-time histories should be deduced from the photo graphic record of the displacement-time histories of the projectile (i.e. deformation-time histories of the
specimen).
Assuming.the projectile and anvil to be rigid, the deceleration-time curve of the projectile was deduced from displacement-time records. Knowing the mass of the projectile, the force-time histories were established from Newton’s Second Law of Motion. Fig. 24 shows a comparison of the force-time histories derived from the displacement time curve and measured force using the load cell
incorporated in the rigid anvil. It is clear from this figure that the new arrangement of the load cell has reduced the phase shift and distortions to the measured load-time history and also has shifted the position of the maximum load towards the left-hand side, i.e. towards early stages of deformation. It also indicates that the maximum load obtained from the computer calculations (on the basis of the photographic records of the displacement time histories) is comparable to that measured experimen tally with load cell.