http://dx.doi.org/10.4236/jgis.2016.83035
A Prediction of Future Land Use/Land Cover
in Amman Area Using GIS-Based Markov
Model and Remote Sensing
Hamzah Ali Khawaldah
Department of Geography, The University of Jordan, Amman, Jordan
Received 23 May 2016; accepted 18 June 2016; published 21 June 2016
Copyright © 2016 by author and Scientific Research Publishing Inc.
This work is licensed under the Creative Commons Attribution International License (CC BY). http://creativecommons.org/licenses/by/4.0/
Abstract
The paper aims to analyze land use/land cover (LULC) changes in western part and the populated area of Amman governorate and to identify the process of urbanization and urban expansion within the study area for the period of 1984-2014. It also aims to predict future LULC map for the year 2030 using Markov Model to provide city planners and decision makers with information about the past and current spatial dynamics of LULC change and strictly urban expansion towards successful management and better planning in the future. Images from Landsat 5-TM for the years 1984, 1999 and from Landsat 8-OLI for the year 2014 were used to investigate LULC within the study area during 1984-2014 and the resulted LULC maps in 1999 and 2014 were used to predict future LULC map based on Markov Model. The results indicated that the urban/built up area ex-panded by 147% during the period from 1984 to 2014 and predicted to expand by 43.9% from 2014 to 2030 based on Markov model predictions. The areas in the western, northwest and southwest parts of Amman as well as the areas of Marka and Uhud, the northeast of the study area, were predicted to witness the major urban expansion in 2030. And these are the areas where city planners and decision makers should take into consideration in future plans of Amman. The urban expansion was mainly attributed to the high population growth rate and large number of immi-grants from neighboring countries and other socio-economic changes.
Keywords
Land Use/Cover Change, Markov Model, GIS, RS, Amman
1. Introduction
en-vironmental and socio-economic issues. Urbanization, caused by population growth, will lead to inward urban growth (intensification) and outward urban growth (sprawl) [2]. These processes inevitably result in Land Use/ Land Cover (LULC) change which has great impacts on both natural ecosystems and human systems [3] [4]. Therefore, monitoring and detecting urban growth and its resulting LULC change are critical to planners, gov-ernment agencies, hydrologists, ecologists, and so on. With the development of remote sensing and GIS tech-nologies, reliable change detection results can be obtained.
Urban growth mainly comes as a result of population growth and frequent human activities, such as industria-lization, migration from rural to urban areas and resettlement [1] [5], leading to LULC changes and landscape pattern alteration at local and regional scale [6]-[10]. Such changes can include losses of agriculture areas, water bodies, forest and other vegetated green spaces and non-vegetated fields [2] [6] [9]-[11], and can result in vari-ous urban issues by increasing population density, hvari-ousing condition, education, employment, public facilities accessibility, infrastructure sufficiency, and quality of life and so on, which are important socioeconomic issues accompanying urban expansion [5] [10] [12] [13].
Amman city, the capital of Jordan, is one of the cities that is experiencing a rapid urbanization as a result of its population’s natural growth and migration from the neighboring countries as well as from other cities and ru-ral areas of Jordan. The result of this was an unplanned expansion of Amman’s urban area, which caused many problems. Thus, predicting future built up area is an important issue in order for future urban planning of the city.
With the free access to the USGS Landsat archive and development of remote sensing techniques, detecting urban growth pattern (intensification or sprawl) and LULC change dynamics with temporally high frequent da-tasets become possible. Since the Landsat 1 was launched in 1972 as the first land-surface observation satellite, satellite data have been widely used for urban area analysis. Landsat archive data with longest record and global coverage allowed a great number of studies to detect long-term LULC change and urban expansion. With the Landsat archive data being open access, detecting long-term change dynamics is the trend of change detection analysis of complex systems. Numerous change detection methods were applied in previous studies. The most widely used method is Post Classification Change Detection (PCCD) method which can generate thematic map for each date and provide specific “from-to” change information. The key factor of producing high quality change detection results is producing accurate individual thematic map.
Additionally, the prediction of future LULC in an area is very important process that provides urban planners and decision makers with the growth rates and the direction of urban expansion. This can help in planning for the needed public services and infrastructure in the future.
In this regard, Markov model is an application of change detection that can be used to predict future changes in one area based on the rates of past change in the area. The method is based on probability that a given piece of land will change from one mutually LULC to another. These probabilities are generated from past changes and then applied to predict future change [14]. The general procedures of using Markov Change Detection Techniques (MCDT) are: first to create a transition matrix of pixels in each class for two time periods—this is basically the same as the cross-tabulation matrix that can be used for accuracy assessment. The main diagonal of the matrix contains pixels that have not changed, while other cells contain pixels that have changed. The next step is to generate probabilities of change between classes. This is accomplished by dividing each cell value by its row total. The result is the probability that a given class in date 1 will convert to another class in date 2 out of all possible changes [15].
The aim of this paper is to detect and reveal urban growth and LULC change dynamics in Amman, an area of observed high population growth in the past five decades, from 1984 to 2014 using GIS and remote sensing (RS) and to predict the future map of LULC in Amman. The objectives of this study can be specified as follows: • To analyze LULC change dynamics of Amman from 1984 to 2014.
• To predict the future LULC in the area in 2030 focusing on the development of the built up area of Amman using Markov model.
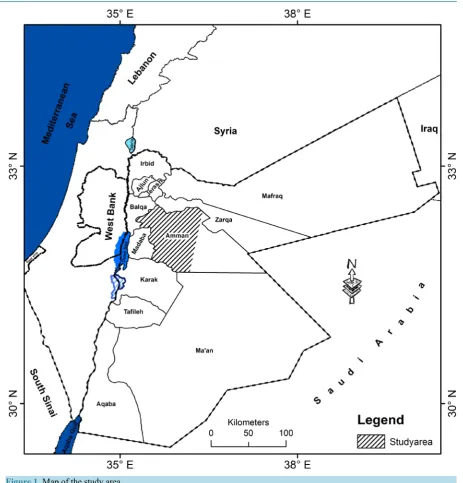
2. Description of the Study Area
Figure 1. Map of the study area.
3. Methodology
3.1. Materials and Methods
The population data of the study area since 1952 was taken from surveys (for many years) and census data (for the years 1952, 1961, 1979, 1994 and 2004) provided by the Department of Statistics of Jordan. The estimation of population in Amman before 1952 was collected from other scientific research.
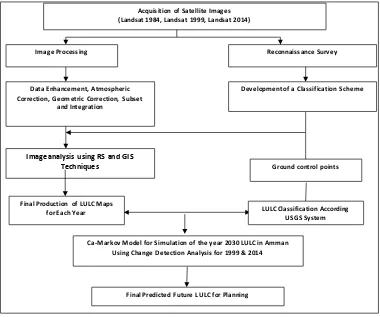
Landsat 5-TM for the years 1984, 1999 and Landsat 8-OLI for the year 2014 images were acquired for this study, as they provide an appropriate and cost-effective source of information for a wide range of applications, including land change mapping. Images (data sets) were obtained from the United States Geological Survey (USGS) (http://glovis.usgs.gov/), having a ground resolution element of 30 × 30 m, the images were then subset to the border of the study area. Figure 2 shows the flowchart of this study.
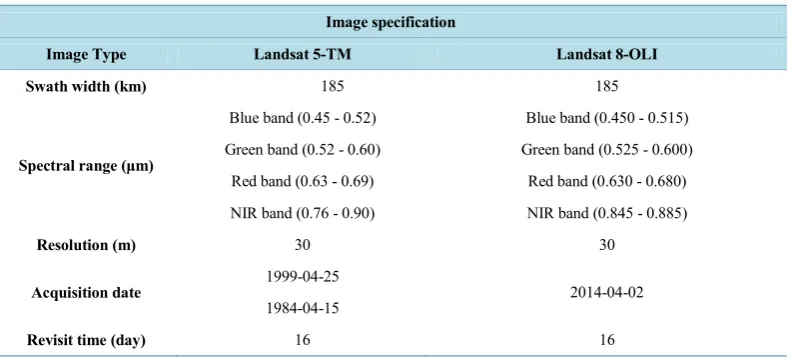
The images of Landsat TM and Landsat OLI include different bands with different wavelengths as shown in
Table 1.
3.2. Image Processing
Radiometric calibration and corrections is important component to the change detection [18], as it can eliminate or reduce image differences introduced as a result of changing atmospheric conditions. For this, the three images were acquired in the same season. The scenes were selected to be radiometric correction, geometrically cor-rected by using ground control points (GCP’s) for road crosses with Global Position System (GPS), with an ac-curacy of ±3 meter calibrated. The transformation model was applied to correct the Landsat 8-OLI image. An image to image geometric correction was followed for correcting Landsat 5-TM images using the corrected im-age of Landsat 8-OLI.
The raw data of Landsat 8-OLI image was provided in Digital Number (DN) that would represent reflected radiance for each pixel at the top of atmosphere. Therefore, it was important to carryout radiometric correction
Acquisition of Satellite Images (Landsat 1984, Landsat 1999, Landsat 2014)
Image Processing Reconnaissance Survey
Data Enhancement, Atmospheric Correction, Geometric Correction, Subset
and Integration
Image analysis using RS and GIS Techniques
Development of a Classification Scheme
Ground control points
Final Production of LULC Maps for Each Year
Ca-Markov Model for Simulation of the year 2030 LULC in Amman Using Change Detection Analysis for 1999 & 2014
Final Predicted Future LULC for Planning
LULC Classification According USGS System
[image:4.595.123.503.390.707.2]Table 1. Specification for satellite images bands, wavelengths and acquisition date.
Image specification
Image Type Landsat 5-TM Landsat 8-OLI
Swath width (km) 185 185
Spectral range (μm)
Blue band (0.45 - 0.52) Blue band (0.450 - 0.515) Green band (0.52 - 0.60) Green band (0.525 - 0.600)
Red band (0.63 - 0.69) Red band (0.630 - 0.680) NIR band (0.76 - 0.90) NIR band (0.845 - 0.885)
Resolution (m) 30 30
Acquisition date 1999-04-25 2014-04-02
1984-04-15
Revisit time (day) 16 16
Source: Adapted From (http://glovis.usgs.gov).
for the images to convert the DN to reflectance values using RS software.
This was done using absolute radiometric correction by measuring reference spectral reflectance of reference object in the image. For this purpose ground measurement were collected by the Multispectral Scanner (MSR16) with similar wavelengths. The reference objects were a quarry floor and a motorway paved with asphalt. The DNs for the same location of the target objects were extracted and correlated with spectral reflectance measured by MSR16. A histogram stretch was also applied to ensure that reflectance values would be in the rage of 0% - 100%. Image enhancement techniques like histogram equalization are performed on each image to improve the quality of the image. The data of ground control points were adapted for each single classifier produced by its spectral signature for producing a series of classification maps. Digital image processing was manipulated by the Remote Sensing (RS) software used.
3.3. Image Analysis and Land Use/Cover Classification
Landsat images were classified using hybrid classification technique. In the hybrid classification technique, im-ages for the years 1984, 1999 and 2014 are classified by combining the results from the unsupervised classifica-tion and the supervised classificaclassifica-tion to obtain the highest possible accuracy. Accurate classificaclassifica-tions are imper-ative to insure precise change detection results. A supervised classification method was carried out using train-ing areas. Finally, the signature from the unsupervised classification was merged with the signature of super-vised classification. This process enables us to assign each pixel of an image to a particular land cover group or class. Maximum Likelihood Algorithm was employed to detect the land cover types using RS software, then the final map was designed by a GIS software as shown in Figure 3 in the discussion section.
To determine the changes in land use/cover at different years, a hybrid classification system was used. Four land use/land cover (LULC) classes were included for the scheme of this research. These land use/cover classes or categories are: Built-up area, Agriculture & Forest land, Rangeland and Barren areas. The description of these classes is shown in Table 2.
3.4. Ca-Markov Model
A raster data model is used in GIS to represent continuous data over space and which allow to produce a specific layer that can be used by TerrSet land change modeler. Markov in TerrSetclark labs IDRISI software involves two techniques; the first one is to analyze expected LULC based on early and later maps of LULC that has enabled us to obtain transition probability matrix records, that is probability of each land cover category to change to the another category.
Table 2. LULC Classification classes and descreption.
No Class Description
1 Built-up area Includes all residential, commercial, and industrial development.
2 Agriculture and Forest land All forest vegetation types including evergreen, deciduous, and wetland forest vegetation types.
3 Rangeland Includes all vegetation features that are not typical of forest, including shrub like vegetation features.
[image:6.595.84.539.95.411.2]4 Barren land Barren or sparsely vegetated areas most often representative of bare earth or soil.
Figure 3. Land use/cover changes during (1984-2014) in Amman area.
random process will satisfy the equation:
( )
( )
( )
( )
(
( )
)
( )
(
1 1 , 1 1, 1 1 1)
X n n n n n n X n n n n
F X t + ≤x+ X t =x X t− =x− X t =F X t + ≤x+ X t =x (1)
where: tn is the present time so that tn+1 represents some points in the future and t1, t2, ···, tn−1 represent various points in the past. Based on the present data, future is independent of the past. In other words, future of random process depends neither on where it is now nor where it was.
If the Markov chain is expressed by X[k], and the states is {x1, x2, x3, ···}, then the probability of transition from the state i to the state j in one time instant is;
[
]
[ ]
(
)
, Pr 1
i j
P X k+ = j X k =i (2)
4. Results and Discussion
4.1. The Development of Amman and its Population Growth
early 1940s, with the city extending over 2.5 km2 by 1947 [21]. In 1948, urban expansion increased to 4.123 km2, due to the first wave of migrants of Palestinians, as a result of the foundation of the state of Israel, who moved to Jordan in general and to Amman in particular. The refugees were mainly accommodated in five hastily prepared camps. Two of these were sited in Amman, namely Al Hussein camp in the north of the city and Al Wehdat camp in the south [20] [21]. As a result of such migration and the strong internal migration from rural areas and other cities to Amman, the population growth rate of the city has always been higher than that of Jor-dan as a whole, standing at 9.6% in the 1950s whereas the population rate at the national level has never ex-ceeded 4% [21]. The spatial expansion during the 1950s took the form of “climbing the hills and mountains” that surrounded the urban core as noted above. Planning at this stage didn’t attempt to guide or regulate urban growth and development.
Population size of Amman has dramatically increased to reach 250 thousand in 1952 soon after the Arab- Israeli conflict in 1948 [22]. The second major wave of refugees arrived in Amman after 1967 war between Israel and the three Arab states of Egypt, Syria and Jordan. Khadhim and Rajjal (1988) noted that this conflict sent Amman into “another spiral of uncontrolled growth” [23], where the city’s population increased from 350 thousand before the conflict to around half a million shortly after it. The population of the city was estimated at 600 thousand in 1974 and increased to 777.8 thousands in 1979, with the city extending over an area of 101 km2 as a result of the second large scale Palestinian migration combined with additional refugees from Lebanon after the Civil War in 1975 [20].
Rapid urban growth in the city of Amman has greatly increased the expansion of the built up area during the period of 1984 to 1999. In 1994, the population of Amman has reached 1,307,017, representing an increase of 54.6% since last census in 1979 according to Population and Housing Census conducted in 1994. The urban ex-pansion was estimated to be 150.764 km2 in 1996 [20]. This expansion was due to the Gulf war in 1991, where about 400 thousand of refugees from Jordanian and Palestinian origins came back from Kuwait and other Gulf countries and settled in Amman. Therefore, Jordan in general, and Amman in Particular, has suffered from the problems of unemployment, poverty and foreign debt, which can be directly related to the third wave of refugees in 1991. With the situation worsened by the economic crisis in 1989 that led to a decline in the value of the Jor-danian Dinar that also pushed more people from rural area and small cities to move to Amman.
The urban expansion continued to reach 162.924 km2 in 2002 [20], and the population growth of Amman has also increased to some 1,726,713 inhabitants amounted to 33.8% of Jordan’s population according to the Population and Housing Census which took place in 2004 after the creation of the geographically wider Great-er Amman Municipality (GMA) area. HowevGreat-er, due to the invasion of Iraq in 2003, the population has contin-ued to grow at a phenomenal rate and the population of Amman was estimated at 2.17 million in 2007 which equals almost 40% of the national population. In March 2007, the Ministry of the Interior estimated that there was as many as 1.4 million Iraqi nationals were living in Amman [21]. The number of Iraqis has decreased to around 500 thousand, but there are no reliable statistics concerning their number. In addition, thousands of construction workers from Egypt and Syria used to live in the city at that time, but again there are no reliable statistics concerning their number especially that some of them used to work seasonally then go back to their countries.
The population of Amman was estimated at 2,528.5 thousands in 2013 by the Jordanian Department of Statis-tics [16]. Urban expansion had increased by 2013 due to three factors; first, the government’s decision in 2007 to merge five additional areas into the GMA, which resulted in an expansion of the area of Amman. The second factor was the enforced Iraqi migration in 2003 due to the Third Gulf War, with most refugees settling in Am-man. The final factor is the current migration of Syrian refugees, which began in 2011 and still continuing.
4.2. Accuracy Assessment
(
)
(
)
1 2 * * r rii i i
i i i r
i i
i i
N X X X
k
N X X
+ + = = + + = = −
∑
∑
∑
where: r is the number of rows in the confusion matrix; Xii is the number of observation in row i and column I;
Xi+ is the total number of observation in row I; X+i is the total number of observation in column I; and N is the total number of observation included in matrix.
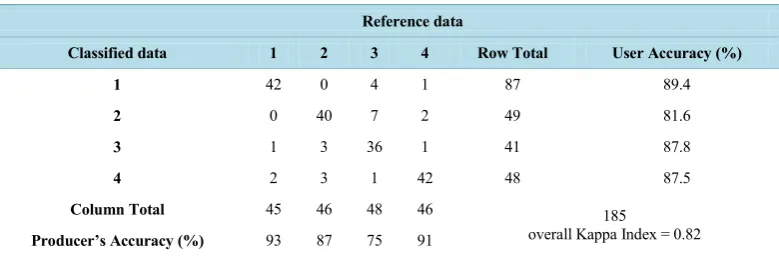
Tables 3-5 show the confusion (error) matrices resulting from the classified digital data. For TM-1984 land
[image:8.595.122.512.225.353.2]use/cover map, a total of 185 pixels were selected and were then checked with a reference to 1:50,000 topograph-ic maps. The results show an overall accuracy of 86%. In terms of the producer’s accuracy and user’s accuracy,
Table 3. Confusion matrix of the signatures derived from Hyper-classification training of Landsat TM-1984.
Reference data
Classified data 1 2 3 4 Row Total User Accuracy (%)
1 42 0 4 1 87 89.4
2 0 40 7 2 49 81.6
3 1 3 36 1 41 87.8
4 2 3 1 42 48 87.5
Column Total 45 46 48 46 185
overall Kappa Index = 0.82
Producer’s Accuracy (%) 93 87 75 91
[image:8.595.119.513.401.525.2]Note: Number of pixels correctly classified = 160; overall classification accuracy = 86%; class 1 = Agriculture Land & Forest Land; class 2 = Built-up Land; class 3 = Rangeland; class 4 = Barren Land.
Table 4. Confusion matrix of the signatures derived from Hyper-classification training of Landsat TM-1999.
Reference data
Classified data 1 2 3 4 Row Total User Accuracy (%)
1 67 4 6 0 77 87.0
2 6 31 0 1 38 81.6
3 6 2 33 3 44 75.0
4 3 10 12 80 105 76.2
Column Total 82 47 51 48 264
overall Kappa Index = 0.72
Producer’s Accuracy (%) 82 66 65 95
[image:8.595.123.513.574.699.2]Note: Number of pixels correctly classified = 211; overall classification accuracy = 80%; class 1 = Agriculture Land & Forest Land; class 2 = Built-up Land; class 3 = Rangeland; class 4 = Barren Land.
Table 5. Confusion matrix of the signatures derived from Hyper-classification training of Landsat 8-OLI-2014.
Reference data
Classified data 1 2 3 4 Row Total User Accuracy (%)
1 55 0 11 4 70 78.6
2 0 61 0 2 63 96.8
3 3 2 50 8 63 79.4
4 0 5 1 39 45 86.7
Column Total 58 68 62 53 241
overall Kappa Index = 0.80
Producer’s Accuracy (%) 95 90 81 74
all classes were above 80% accept for Rangeland class with producer’s accuracy of 75%. Kappa index of agreement was 82% (Table 3). This value indicates that the classification process avoided 82% of the error.
For TM-1999 land use/cover map, a total of 274 pixels were selected and were then checked with a reference to 1:50,000 topographic maps. The results show an overall accuracy of 80%. In terms of the producer’s accura-cy, all classes were above 65% and above 75% in terms of user’s accuracy. Kappa index of agreement was 72%
(Table 4). This value indicates that the classification process avoided 72% of the error.
For Landsat 8-OLI-2014 land use/cover map, a total of 241 pixels were selected and were then checked with a reference to 1:50,000 topographic maps. The results show an overall accuracy of 85%. In terms of the produc-er’s accuracy, all classes were above 74% and above 78% in terms of usproduc-er’s accuracy. Kappa index of agree-ment was 80% (Table 5). This value indicates that the classification process avoided 80% of the error.
Finally, overall accuracy of more than 80% for the three maps (1984, 1999 and 2014), indicate that this is good evidence that the image processing approach adopted in this study has been effective in producing com-patible land use/cover data over time.
4.3. Detection of LULC
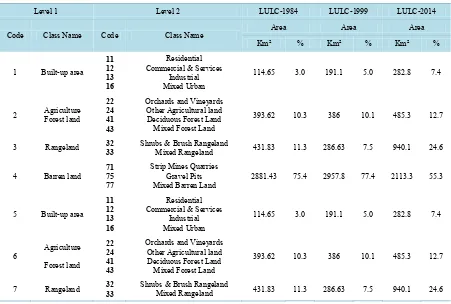
This classification of LULC is performed based on the classification scheme of USGS Land cover system. The USGS system divided the land cover classes into two levels (shown in Table 6). GIS and remote sensing have been used to integrate the LULC classes focusing on urban/ built up area classes within the study area for the three time series to and generate a thematic map to examine dynamics of urban expansion of Amman (Figure 3). The results showed that the built up area has increased from 114.7 km2 in 1984 to 191.1 km2 in 1999 which indicates that the number of population has increased during this period as discussed in section 3.1. During the period 1984-1999, it was clear that the encroachment of urban/built up areas occurred to the directions of northwest and southeast of Amman [21], and continued toward Zarqa city. In comparison, the Agriculture & Forest land has decreased from 393.6 km2 to 386 km2 during the same period. Another decrease was in Rangel-and class which decreased by 145.2 km2 compared to Barren land class gaining extra 76.4 km2 during the same period due to the dry winter season of 1999. On the other hand, the rate of the encroachment of built up area during the period 1999-2014 expanded much more extensively in the same direction of the former period be-sides the expansion toward Al-Salt city. The built up area of Amman has increased by another 92 km2 during the same period. The wet winter season in 2014 has influenced the agriculture and rangelands areas to increase
(Table 6). Furthermore, a rapid urban sprawl occurred around Amman, since the sprawl normally takes place in
radial direction around the city center or in linear direction along the highways [26]. Consequently, Potter et al., (2009) noted that the existence of transportation routes within the study area encouraged the urban sprawl to occur, where transport in the cities is as socially polarized as the structure of the cities themselves [21].
The increase of Amman’s built-up area without a comprehensive planning had a negative impact on local en-vironment; especially, on water resources which are already scarce [27]. On the other hand, there are many “in-formal” houses, which were built without planning permits in urban areas in Jordan and comprise more than half of the urban building stock, especially in poor areas [27]. The informal houses are considered a serious problem to the environment due to improper planning system. Moreover, Amman city remains the main economic center of Jordan, which offers plenty of services, jobs and business opportunities. Therefore, the flows of a big number of immigrants from the neighboring countries, after 1991 and 2003 and 2011 into Amman city [16], caused an urgent need to urban planning studies, to determine the magnitude of encroachment resulted from the urban ex-pansion centered mostly at the central part of Jordan. Thus, the study used Markov model to predict the 2030 LULC and predict encroachment of urban expansion and its direction for better planning for the area.
4.4. Predicting of the 2030 LULC Using Ca-Markov Model
4.4.1. Final 2030 LULC Map Using Ca-Markov Model
As discussed above in the methodology section, Ca-Markov model was used to predict the 2030 LULC based on transition probability matrix records derived from the observed 1999 and 2014 LULC, the probability of each land cover category to change to another category. This matrix is produced by the multiplying each column in the transition probability matrix with the number of cells of corresponding land use in the later image as shown
in (Table 7). Although the transition probabilities may be accurate for a particular class as a whole but there is
Table 6. Area estimates and the overall amount of change in LULC for the study area.
Level 1 Level 2 LULC-1984 LULC-1999 LULC-2014
Code Class Name Code Class Name Area Area Area Km² % Km² % Km² %
1 Built-up area
11 12 13 16
Residential Commercial & Services
Industrial Mixed Urban
114.65 3.0 191.1 5.0 282.8 7.4
2 Agriculture Forest land
22 24 41 43
Orchards and Vineyards Other Agricultural land Deciduous Forest Land Mixed Forest Land
393.62 10.3 386 10.1 485.3 12.7
3 Rangeland 32 33 Shrubs & Brush Rangeland Mixed Rangeland 431.83 11.3 286.63 7.5 940.1 24.6
4 Barren land 71 75 77
Strip Mines Quarries Gravel Pits
Mixed Barren Land 2881.43 75.4 2957.8 77.4 2113.3 55.3
5 Built-up area
11 12 13 16
Residential Commercial & Services
Industrial Mixed Urban
114.65 3.0 191.1 5.0 282.8 7.4
6 Agriculture Forest land
22 24 41 43
Orchards and Vineyards Other Agricultural land Deciduous Forest Land Mixed Forest Land
393.62 10.3 386 10.1 485.3 12.7
7 Rangeland 32 33 Shrubs & Brush Rangeland Mixed Rangeland 431.83 11.3 286.63 7.5 940.1 24.6
Table 7. Transnational probability matrix derived from the LULC map of 1999 and 2014.
Eary-2014/Later-2030 Built-up area Agriculture & Forest land Rangeland Barren land
Built-up area 0.7465 0.1600 0.0738 0.0198
Agriculture & Forest land 0.1339 0.5792 0.2657 0.0212
Rangeland 0.0959 0.3181 0.5156 0.0704
Barren land 0.0192 0.0444 0.2663 0.6702
a spatial dimension to the model as a second step.
According to transition probability matrix, the main change occurred on barren land. Field work investiga-tions demonstrated that barren land with built-up area and agriculture land are transient categories and hence exposed to more changes over time. Barren land shifted mostly to built-up area, agriculture land and rangeland with time.
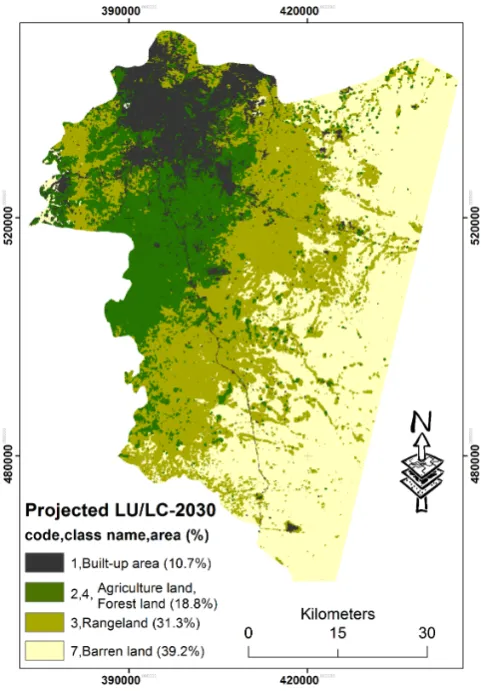
As shown in Figure 4, it can be easily seen that there is a predicted urban expansion in the western part of the current built up area than in the east of Amman as expected. The built up area is predicted to increase by another 124 km2 (to be 10.7% of the study area compared to 7.4% in 2014). Another increase was predicted in Agricul-ture & Forest land which is predicted to occupy 18.8% of the study area in 2030 compared to 12.7% in 2014. The Barren land area is predicted to only occupy 39.2% from the total area compared to 55.3% in 2014 (Table 8).
[image:10.595.86.541.427.506.2]Figure 4. Predicted land use/cover change from Ca-Markov Modeling for the year 2030.
Table 8. Predicted areas of LULC for 2030 in the study area.
LULC Classes Built-up area Agriculture & Forest land Rangeland Barren land
2030 Area in km
2 406.8891 718.7931 1197.0369 1498.1931
Area in percentage 10.7 18.8 31.3 39.2
expected [16]. This increase in population will result in an increase in built up area as predicted in this study. Therefore, urban planners of Amman should takes this into consideration and set their plans for the expected new urban areas.
4.4.2. Validation of Ca-Markov Model Results
The validation, or calibration, of the performance of the model is an important process to assess the ability of the model to replicate the known data set. Many goodness-of-fit statistics have been used in the literature within spatial modelling [28]. In this study, one main statistical tests of goodness-of-fit will be used to evaluate the performance of Markov model and to validate its predictions against real data set. One of the most commonly- used GOF statistics is R2 [29]-[31], and is formulated as follows:
(
)
(
)
(
)
(
)
2
2
1 2 2 2
ˆ R
ˆ *
ij o ij e i j
ij o ij e
i j i j
S S S S
S
S S S
− −
=
− −
∑ ∑
[image:11.595.86.542.471.522.2]where, So represents the mean of the Sij’s (observed values) and Se represents the mean of the Sˆij’s (pre-dicted values). R2 values range between zero and one. The closer the value of R2 is to one the better, since a value of one shows an exact correspondence between the observed and predicted values, whilst a zero value re-flects no correspondence.
To calibrate Markov model, two maps of LULC in the study area for the years 1984 and1999 were used in order to create the 2014 LULC map in the study area using Markov model (see Figure 5). For validation, the resulted LULC for 2014 as created by Markov was compared to the observed 2014 LULC of the study area. The results of R2 value showed a high performance of Markov model and its prediction of 2014 LULC, with R2 equals 0.886. The model has underestimated the built up area in 2014 and predicted it at 6.1% of the study area compared to the observed 2014 map of LULC which showed that the percentage of the built up area was 7.4% of the study area. This can be due to the changes in Amman’s population which increased quickly as a result of receiving high number of Iraqi refugees in 2003 after the invasion of Iraq and receiving high number of Syrian refugees due to the current crisis in Syria, as well as the internal migration from other Jordanian cities and small towns to Amman. This clearly had an impact on the land use in the city, and the built up area increased as a re-sult.
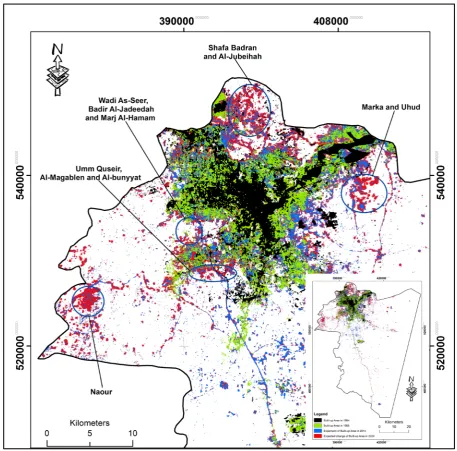
The model predicted the built up area of Amman to increase by another 124 km2 during 2014-2030 as noted above. Figure 6 shows the development of the built up area within the study area during 1984-2030. From the figure, it can be easily seen the areas in the study area that are predicted to be converted to a built up areas in 2030 based on Markov model predictions. Five locations were highlighted in the figure as they will witness an urban expansion in 2030. These are: ShafaBadran, Al-Jubeihah and Tareq in the northwest of the study area, Naour in the southwest, the areas of Wadi As-Seer & Badir Al-Jadeedah & Marij Al-Hamam, and Umm Quseir in the west of Amman, and Finally, Marka and Uhud in the northeast of the study area.
It can be noticed that the built up area takes radial direction around the center of the study area or linear direc-tion along the highways as it is found in previous research that the existence of road networks encourages urban expansion to take place along road networks [21] [27].
5. Conclusions
It is necessary to have information about LULC patterns change over time not only for urban planning purposes, but also for improving the management of the use of land resources [27]. This study has demonstrated the im-portance of using GIS and RS GIS techniques to produce accurate LULC maps and change statistics for the western and populated part of Amman’s governorate, which is valuable to monitor urban expansion effectively over a time.
The results of LULC change detection of the study area showed that built-up area covered 114.7 km2 in 1984, 191.1 km2 in 1999 and 282.8 km2 in 2014 or 3%, 5% and 7.4% of the study area respectively. This represents a net increase of 168.1 km2 in 30 years, which is mainly attributed to the rapid increase in population due to large migration from neighboring countries and internal migration from other Jordanian cities and small towns. Dur-ing the period of 1984 to 1999, there was a decrease in both the Agricultural lands and Rangeland, which were converted to urban areas due to population growth and to Barren land due to the dry season of 1999, while from 1999 to 2014 the urban expansion as well as Agricultural land and Rangeland increased toward bare lands. However, urban sprawl had increased during the same period, which was considered as a key indicator that ur-ban planning strategy should be given more attention. The preprocessing stage, such as the geometric correc-tions of multi-temporal satellite images as well as using the same classification scheme, is very important to en-hance the accuracy of the results. In this study, the accuracy of the maps was satisfactory. It confirmed that the image processing procedures were effective in producing land use/cover maps from the Landsat image, which were fairly compatible to those produced from high resolution data. The study took advantage of remote sensing and GIS techniques that were crucial for dealing with the dynamics of LULC change in the study area over the study period.
Figure 5. Observed Land use/cover change in 2014 versus the predicted for the same year in Amman.
Figure 6. Built up area changes during (1984-2014) and the predicted built up area in 2030 of the stdy area.
The model predicted an increase of 124 km2 in the built up area of Amman during 2014-2030 and five loca-tions to witness a clear urban expansion in 2030 mainly in the north, west and southwest of current built up area as discussed before.
6. Study Implications and Future Research
strategies for better sustainable land management.
Future studies should investigate the impacts and the interactions of some spatial variables on urban expan-sion patterns and to integrate other suitable methods with Markov model to predict future LULC change and to investigate other socio-economic factors that may play important roles in urban expansion.
References
[1] Ridd, M.K. and Hipple, J.D. (2006) Remote Sensing of Human Settlements: Manual of Remote Sensing. 3rd Edition, American Society for Photogrammetry and Remote Sensing, Bethesda.
[2] Sexton, J.O., Song, X., Huang, C. and Channan, S. (2013) Urban Growth of the Washington, DC-Baltimore, MD Met-ropolitan Region from 1984 to 2010 by Annual, Landsat-Based Estimates of Impervious Cover. Remote Sensing of En-vironment, 129, 42-53. http://dx.doi.org/10.1016/j.rse.2012.10.025
[3] Gillanders, S.N., Coops, N.C., Wulder, M.A. and Goodwin, N.R. (2008) Application of Landsat Satellite Imagery to Monitor Land-Cover Changes at the Athabasca Oil Sands, Alberta, Canada. Canadian Geographer, 52, 466-485. http://dx.doi.org/10.1111/j.1541-0064.2008.00225.x
[4] Munthali, K.G. and Murayama, Y. (2011) Land Use/Cover Change Detection and Analysis for Dzalanyama Forest Reserve, Lilongwe, Malawi. Procedia-Social and Behavioral Sciences, 21, 203-211.
http://dx.doi.org/10.1016/j.sbspro.2011.07.035
[5] Bhatta, B. (2010) Analysis of Urban Growth and Sprawl from Remote Sensing Data. Springer Science & Business Media, Heidelberg. http://dx.doi.org/10.1007/978-3-642-05299-6
[6] Yin, J., Yin, Z., Zhong, H., Xu, S., Hu, X., Wang, J. and Wu, J. (2011) Monitoring Urban Expansion and Land Use/Land Cover Changes of Shanghai Metropolitan Area during the Transitional Economy (1979-2009) in China. E n-vironmental Monitoring and Assessment, 177, 609-621. http://dx.doi.org/10.1007/s10661-010-1660-8
[7] Tan, K.C., Lim, H.S., MatJafri, M.Z. and Abdullah, K. (2009) Landsat Data to Evaluate Urban Expansion and Deter-mine Land Use/Land Cover Changes in Penang Island, Malaysia. Environmental Earth Sciences, 60, 1509-1521. http://dx.doi.org/10.1007/s12665-009-0286-z
[8] Deng, J.-S., Wang, K., Li, J. and Deng, Y.-H. (2009) Urban Land Use Change Detection Using Multisensor Satellite Images. Pedosphere, 19, 96-103. http://dx.doi.org/10.1016/S1002-0160(08)60088-0
[9] Sundarakumar, K., Harika, M., Begum, S.K.A., Yamini, S. and Balakrishna, K. (2012) Land Use and Land Cover Change Detection and Urban Sprawl Analysis of Vijayamada City Using Multitemporal Landsat Data. International Journal of Engineering Science and Technology, 4, 170-178.
[10] Fu, A. (2014) Urban Growth and LULC Change Dynamics Using Landsat Record of Region of Waterloo from 1984 to 2013.
[11] Yang, X. (2011) Urban Remote Sensing: Monitoring, Synthesis and Modeling in the Urban Environment. John Wiley & Sons, Oxford. http://dx.doi.org/10.1002/9780470979563
[12] Thapa, R.B. and Murayama, Y. (2009) Urban Mapping, Accuracy, & Image Classification: A Comparison of Multiple Approaches in Tsukuba City, Japan. Applied Geography, 29, 135-144. http://dx.doi.org/10.1016/j.apgeog.2008.08.001 [13] Patino, J.E. and Duque, J.C. (2013) A Review of Regional Science Applications of Satellite Remote Sensing in Urban
Settings. Computers, Environment and Urban Systems, 37, 1-17. http://dx.doi.org/10.1016/j.compenvurbsys.2012.06.003
[14] Aavikson, K. (1995) Simulating Vegetation Dynamics and Land Use in a Mire Landscape Using a Markov Model.
Landscape and Urban Planning, 31, 129-142. http://dx.doi.org/10.1016/0169-2046(94)01045-A
[15] Wijanarto, A. (2006) Application of Markov Change Detection Technique for Detecting Landsat ETM Derived Land Cover Change Over Banten Bay. Jurnal Ilmiah Geomatika, 12, 11-21.
[16] Department of Statistics (2014) Population Estimation Reports, Amman, Jordan.
[17] Potter, R., Darmame, K., Barham, N. and Nortcliff, S. (2007) An Introduction to the Urban Geography of Amman, Jordan. Geographical Paper, No. 182.
https://www.reading.ac.uk/web/FILES/geographyandenvironmentalscience/GP182_Amman_RBP_9Aug07.pdf
[18] Chavez, P.S. and MacKinnon, D.J. (1994) Automatic Detection of Vegetation Changes in the Southwestern United States Using Remotely Sensed Images. Photogrammetric Engineering and Remote Sensing, 60, 571-582.
[19] Chatelard, G. and de Tarragon, J.-M. (2006) The Empire and the Kingdom. Centre Culturiel Francais D’Amman, Am-man.
[20] Al Rawashdeh, S. and Saleh, B. (2006) Satellite Monitoring of Urban Spatial Growth in the Amman Area, Jordan.
http://dx.doi.org/10.1061/(ASCE)0733-9488(2006)132:4(211)
[21] Potter, R., Darmame, K., Barham, N. and Nortcliff, S. (2009) “Ever-Growing Amman”, Jordan: Urban Expansion, So-cial Polarization and Contemporary Urban Planning Issues. Habitat International, 33, 81-92.
http://dx.doi.org/10.1016/j.habitatint.2008.05.005
[22] Abu-Dayyeh, N. (2004) Persistent Vision: Plans for a Modern Arab Capital, Amman, 1955-2002. Planning Perspec-tives, 19, 79-110. http://dx.doi.org/10.1080/0266543042000177922
[23] Kadhim, A.M. and Rajjal, Y. (1988) City Profile: Amman. Cities, 5, 318-325. http://dx.doi.org/10.1016/0264-2751(88)90021-2
[24] Congalton, R.G. (1991) A Review of Assessing the Accuracy of Classifications of Remotely Sensed Data. Remote Sensing of Environment, 37, 35-46. http://dx.doi.org/10.1016/0034-4257(91)90048-B
[25] Lillesand, T.M., Kiefer, R.W. and Chipman, J.W. (1994) Remote Sensing and Image Interpretation. Wiley, New York. [26] Sudhira, H.S., Ramachandra, T.V. and Jagadish, K.S. (2004) Urban Sprawl: Metrics, Dynamics and Modelling Using
GIS. International Journal of Applied Earth Observation and Geoinformation,5, 29-39. http://dx.doi.org/10.1016/j.jag.2003.08.002
[27] Alsaaideh, B., Al-hanbali, A. and Tateishi, R. (2011) Assessment of Land Use/Cover Change and Urban Expansion of the Central Part of Jordan Using Remote Sensing and GIS. Asian Journal of Geoinformatics, 11, 1-9.
[28] Knudsen, D.C. and Fotheringham, A.S. (1986) Matrix Comparison, Goodness-of-Fit, and Spatial Interaction Modelling.
International Regional Science Review, 10, 127-147. http://dx.doi.org/10.1177/016001768601000203
[29] Birkin, M., Khawaldah, H., Clarke, M. and Clarke, G. (2015) Applied Spatial Interaction Modelling in Economic Geo-graphy: An Example of the Use of Models for Public Sector Planning. In: Karlsson, C., Andersson, M. and Norman, T., Eds., Handbook of Research Methods and Applications in Economic Geography, Edward Elgar Publishing, Chelten-ham, 491-510.
[30] Fotheringham, A.S. (1983) A New Set of Spatial Interaction Models: The Theory of Competing Destinations. Envi-ronment and Planning A,15, 15-36.
[31] Khawaldah, H.A. (2012) Using GIS and Spatial Modelling for Retail Planning and Economic Impact Assessment: The Case of Silverburn in Glasgow. Doctoral Dissertation, University of Leeds, Leeds.