392
1YOUN-SIK HONG, 2DONG-YEONG KIM
1Professor, Incheon National University, Dept. of Computer Science and Eng., Rep. of KOREA 2 Undergraduate, Incheon National University, Dept. of Computer Science and Eng., Rep. of KOREA
E-mail: 1[email protected], 2[email protected],
ABSTRACT
The number of domestic senior care centers has increased exponentially. The biggest problem of the senior
care centers is that they have absolutely insufficient manpower and need efficient management of patients with limited manpower. Patients with pressure ulcers often do not move themselves, so it is necessary to ch ange their postures when lying down in the same position for a certain period of time. In particular, admissi on to a senior care center is known to be an important risk factor for the development of pressure ulcers. In the case of dementia patients, most of them are able to move themselves, so it is necessary to prevent falls o r to tell nurses or caregivers whether they are lying in bed or not. We are interested in an implementation of a smart bed to aid nurses or caregivers for nursing elderly patients. The smart bed can detect the pressures o ccurred on a whole body of a patient at regular interval to prevent pressure ulcers and/or falling accident fro m the bed. The body structure of a person can be divided into three parts according to their characteristics:
head, body, and leg. Legs, like arms, have weak loads and are frequently moving parts. On the other hand,
the body is the area where the load is the largest and the area where the pressure ulcer occurs. Heads and legs can be measured only by the presence or absence of pressure, rather than by the exact location of the
pressure. To do this, two types of pressure sensors are used to sense pressures on specific body parts depen ding on sensing purposes.
Keywords: Pressure Ulcers, Fall Prevention, Pressure Sensor, FSR Sensors, Smart Bed, IOT
1. INTRODUCTION
In Korea, the percentage of elderly population reached 11% in 2011, which has already entered the aging society, and it is expected to increase to 15.7% in 2020 to enter the aged society [1]. As a result, chronic diseases such as pressure ulcers, dementia, stroke, and traumatic diseases related to the elderly are rapidly increasing. This increases the number of elderly people who need long-term care.
Therefore, the concern for the elderly is increasing, and also for the elderly patients. The number of domestic nursing hospitals (a.k.a. senior care centers) has increased exponentially, from 19 in 2000 to 825 in 2010 [2]. More than half of the patients admitted to senior care centers are elderly people aged 75 or older [3] and 56~97% elderly people who have 3 or more chronic diseases [4].
Pressure ulcers are localized damage to the skin and/or underlying tissue that usually occur over a bony prominence as a result of pressure, or
pressure in combination with shear and/or friction. The most common sites are the skin overlying the sacrum, coccyx, heels or the hips, but other sites such as the elbows, knees, ankles, back of shoulders, or the back of the cranium can be affected [5].
In particular, admission to a senior care center is known to be an important risk factor for the development of pressure ulcers [6]. The incidence of pressure ulcers in senior care centers has been reported to be 6.8~13.9% in Korea and 9.0~25.2% in foreign countries [8].
Shin’s research group [8] conclude that prevention strategies to decrease the occurrence of pressure ulcers should include the use of optimal nursing personnel, use of pressure ulcer assessment tools, and nurses' proactive attitudes towards pressure ulcer prevention. In particular, the influence of nurse manpower on the occurrence of pressure ulcers was the most significant variable.
In elderly patients admitted to senior care centers, the percentage of patients with dementia is
A DEPLOYMENT OF FSR SENSORS AND ITS SENSING
ALGORITHM FOR IMPLEMENTING A SMART BED
393 also very high. As the age increases, the incidence of dementia, a geriatric disease, sharply increases. Over the age of 65, the number of dementia patients doubles every five years [9]. The incidence of dementia among elderly people aged 65 and over in Korea was 9.2% in 2012 [10]. Especially, when nurses or caregivers are negligent, the patients with dementia often fall down from his/her bed or get out of the room without permission.
In this paper, we have implemented IoT (Internet of Things) based smart bed system to aid nurses or caregivers for nursing elderly patients. The primary goal of a smart bed system is to prevent pressure ulcers and/or falling accident from the bed.
The biggest problem of the senior care centers is that they have absolutely insufficient manpower and need efficient management of patients with limited manpower.
Pressure ulcers most commonly develop in individuals who are not moving about, such as those being bedridden or confined to a wheelchair [5]. Patients with pressure ulcers often do not move themselves, so it is necessary to change their postures when lying down in the same position for a certain period of time. According to the previous work [10], it was shown that the incidence of pressure ulcers decreased when the position changes every 3 hours and the repositioning using 30 ° tilt is done [11].
In the case of dementia patients, most of them are able to move themselves, so it is necessary to prevent falls or to tell nurses or caregivers whether they are lying in bed or not.
The body structure of a person can be divided into three parts according to their characteristics: head, body, and leg. When the head
is laid on the pillow, the load is relatively low. Legs,
like arms, have weak loads and are frequently
moving parts. On the other hand, the body is the area where the load is the largest and the area where the pressure ulcer occurs. Heads and legs can be
measured only by the presence or absence of pressure, rather than by the exact location of the pressure. On the other hand, the body needs to know the precise location of the pressure and how long the pressure has persisted at that location.
To do this, two types of pressure sensors are used to sense pressures on specific body parts depending on sensing purposes. We will deploy sensors regarding both average body size by age referring from the Korea Agency for Technology and Standards (KATS) [12], and the most common sites of pressure ulcers.
Also we introduce the pressure sensing algorithm that detects the pressure intensity and the duration of the pressure accurately.
The remainder of this paper is organized as follows. Section 2 we describe an overall structure of a smart bed system. In Section 3, the experimental results used to validate the proposed method are presented. Finally, conclusions are drawn in Section 4.
2. SMART BED SYSTEM
2.1 System Overview
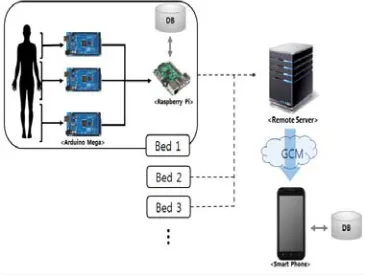
[image:2.612.326.510.341.479.2]The primary purpose of a smart bed system is to assist caregivers for nursing elderly patients who are not able to move about freely. With a smart bed, a set of pressure sensors installed under a mattress cover measure pressure intensity due to the weight of a patient who lies down on the bed.
Figure 1: H/W Diagram Of A Smart Bed System
A smart bed can get the information of pressure intensity of points or areas of a patient body. With this information we know the patient posture, supine position or lateral position, and the duration time of pressure on the particular point. Based on this knowledge, a smart bed system can inform caregivers to prevent pressure ulcers and/or falling accident from the bed.
394
2.2 Design Of A Smart Bed System
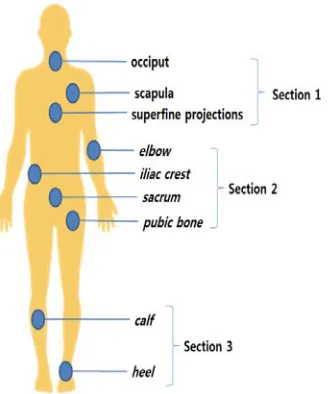
[image:3.612.318.518.86.339.2]Our smart-bed meets the standard requirements of 1,895cm x 850cm, where it is a dimension of a bed for medical purpose. A whole body of a patient is divided into three distinct sections as shown in Fig.2. This classification has been done based on pressure intensity and the position of the frequent occurrence of pressure ulcers. The points marked as blue dots in the section have similar pressure intensity and they are close to the known position of pressure ulcers.
Figure 2: The Three Distinct Sections And The Positions Of The Frequent Occurrence Of Pressure Ulcers
[image:3.612.104.269.253.450.2]The first section corresponds to the upper body. It consists of head, where the three dots are occiput, scapula, and superfine projections, respectively. The second section consists of arms and buttocks, where the four dots are elbow, iliac crest, sacrum, and pubic bone, respectively. The third section consists of legs, where the two dots are calf and heel, respectively.
Figure 3: The Operations Of A Smart Bed System
A micro-controller unit (MCU) is allocated to each section to collect data of pressure intensity which have been sent from sensors deployed. It has been implemented with Arduino MEGA-2560. Since each MCU operates independently, the smart-bed system performs its own work even though one or two MCUs have some troubles or stopped accidentally.
As shown in Fig.3, a gateway node to the remote server of the smart bed system is implemented with Raspberry PI board. It has an ATmega 644 CPU and operates on Linux operating system.
The gateway communicates with three distinct MCUs via Master-Slave mode. Each MCU transmits data of pressure intensity to the gateway periodically. The gateway converts raw data into the corresponding formatted data and then stores them in a local database.
These data will be sent to the remote server and then be stored in a permanent database. In the case of high possibility of pressure ulcers attack or falling accident from a bed, an alarm message will be sent to caregiver’s smart device immediately via GCM (Google Cloud Messaging)
server.
Notice that in Fig.3, the time (5 minutes and 30 minutes) is initially set and is variable
395
2.3 FSR Sensors Deployment
We have deployed sensors regarding both average body size by age referring from the KATS, and the most common sites of pressure ulcers. By doing this, it will be possible to detect pressure of body positions with various body dimensions.
A force sensing resistors (FSR) is a flat, flexible device that exhibits a decreasing electrical resistance with increasing forces applied normal to its surface. Our design goal for sensor deployment is to use the minimum number of sensors to detect pressure of all possible body positions. To satisfy this goal, two types of FSR sensors are used: FSR-408 and FSR-406 [13]. The dimension of FSR-FSR-408 and FSR-406 is 610mm x 5mm and 38mm x 38mm, respectively. The pressure range for the above two sensors is 0.1 ~ 10.2²N (Newton).
2.3.1 Square-type FSR sensor
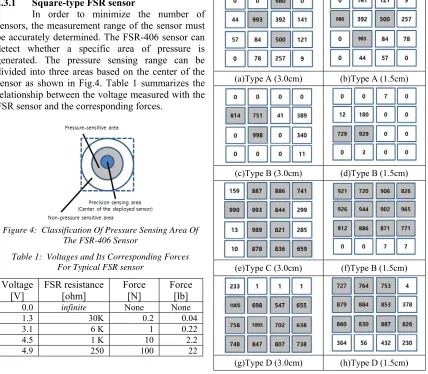
[image:4.612.323.519.66.260.2]In order to minimize the number of sensors, the measurement range of the sensor must be accurately determined. The FSR-406 sensor can detect whether a specific area of pressure is generated. The pressure sensing range can be divided into three areas based on the center of the sensor as shown in Fig.4. Table 1 summarizes the relationship between the voltage measured with the FSR sensor and the corresponding forces.
Figure 4: Classification Of Pressure Sensing Area Of The FSR-406 Sensor
Table 1: Voltages and Its Corresponding Forces For Typical FSR sensor
Voltage
[V] FSR resistance [ohm] Force [N] Force [lb]
0.0 infinite None None
1.3 30K 0.2 0.04
3.1 6 K 1 0.22
4.5 1 K 10 2.2
4.9 250 100 22
Figure 5: FSR-406 Sensor Deployment In A 4x4-Grid Pattern
Table 2: Measured Voltages With Respect To Different Body Parts And The Distances Between The FSR Sensors
(a)Type A (3.0cm) (b)Type A (1.5cm)
(c)Type B (3.0cm) (d)Type B (1.5cm)
(e)Type C (3.0cm) (f)Type B (1.5cm)
(g)Type D (3.0cm) (h)Type D (1.5cm)
[image:4.612.94.522.304.678.2]396 this, 16 FSR sensors are arranged as shown in Fig. 5 in a 4x4 grid structure.
In addition, the pressure was measured by arranging the distances between the sensors to 3 cm and 1.5 cm, respectively. There are 4 body parts to be measured:
Type A: The forces occurred in his head were
measured when a 24-year-old man lay on the smart mat as shown in Fig.5.
Type B: The forces occurred in his head were
measured, while he put his head on a pillow.
Type C: When he sat on the smart mat, the
pressure was measured.
Type D: The forces occurred in his upper body
were measured when he lay on the smart mat.
The results are summarized in Table 2. The number used in Table 2, Table 3 and Table 4 is a value from 0 to 1,023, which corresponds to a value of 0 to 5000 mV. That is, the larger the value, the larger the force is generated. For visual distinction, when the output values are over 500, the color of the cells is depicted as gray.
[image:5.612.348.480.335.472.2]Table 3 and Table 4 show the results of statistical analysis for type A and type B, and for type C and type D, respectively. Notice that the head is not the area where pressure is precisely measured. However, when lying on the bed, people often lay down on their pillows. Thus, our experiments were carried out with the aim of measuring what pressure changes appeared in the case of Type B compared to the Type A.
Table 3: The Statistics for Type A and Type B cases
Type Type A Type B
Distance 3cm 1.5cm 3cm 1.5cm Average 228.5 228.5 209 116.3 Std. dev 330.0 330.0 345.7 284.1 Total 3,656 3,656 3,344 1,860
In general, it is predicted that the measurement pressure will increase when the sensors are arranged by making the distance between the sensors narrow. However, as shown in Table 3, when the distances between the sensors are shortened to 1/2 in Type B, the average pressure is lowered. One of the reasons for this is that the pressure from the head is reduced by the pillow.
Table 4: Statistics for Type C and Type D cases
Type Type C Type D
Distance 3cm 1.5cm 3cm 1.5cm Average 643.1 660.3 586.5 607.9 Std. dev 359.1 396.5 339.9 312.3 Total 10,290 10,564 9,384 9,727
The pressure around the sitting area is the strongest when a person is seated. As shown in Table.4, this can be confirmed by increasing the total measured pressure when the sensor interval is narrowed. When a person is lying down in the case of Type C, the measured pressure is somewhat less than when sitting in the case of Type D. Through this, it can be judged whether a person is sitting or lying. Also, as the sensor interval is narrowed, the total measured pressure increases by 1.03 to 1.04 times.
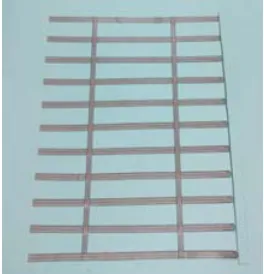
2.3.2 Strip-type FSR sensor
The FSR-408 pressure sensor is able to detect the pressure of a wide area with relatively smaller numbers. It does know only the strength of the pressure, whereas it does not know the exact position of pressure issued. To utilize FSR-408 sensors they are deployed in a strip pattern as shown in Fig.6.
Figure 6: Deployment of the FSR-408 sensors in strip-patterns
Notice that they are used to detect pressures of patient head, legs, and hips. The
vertical spacing between sensors for detecting pressure of hips is 20~30mm, whereas the vertical spacing for legs is 50mm.
To expect the position of pressure issued, at least two FSR-408 sensors are necessary. First, let's look at a case where four FSR-408 sensors are arranged horizontally and four vertically, as shown in Fig.7. Assume that the two sensors, A2 and B1 in Fig.7 detect pressures simultaneously. Then the intersection point marked as the dotted line will be expected as the position of pressure issued.
397 case of Fig. 8, the method of estimating the position of pressure generated is similar to that of Fig.7. That is, it is necessary to find a point where the two sensors (in this case, A31 and B 41) overlap each other.
Figure 7: Detection Of The Area Which The Pressure Is Generated For A Simple Strip Pattern
Figure 8: Detection Of The Area Which The Pressure Is Generated For Complex Strip Patterns
2.3.3 Deployment of FSR sensors
To detect pressure of the upper body, FSR-406 sensors are deployed in a dot pattern as shown in Fig.9. FSR-406 sensor does know the exact position of pressure issued. They have been deployed by 190mm-distance away from the FSR-408 sensors deployed in the back of the patient head to detect the pressure of the shoulder portion. Note that the exact dimension is determined by referring Korean standard body dimension from KATS. For example, such distance for Koreans is measured by 190.223mm~220.44mm.
FSR-406 sensors are also deployed to detect pressure of both superfine projections (spine) and elbow positions.
[image:6.612.133.232.162.271.2]For the actual implementation as shown in Fig.10, the total number of 45 sensors is used: the 18 FSR-408 sensors and the 27 FSR-406 sensors. With this implementation, the 22 positions of the frequent occurrence of pressure ulcers can be detected: 10 positions for supine posture and 12
[image:6.612.94.300.313.453.2]positions for lateral posture. Such implementation is designed for elderly patient whose height is 150 ~ 180cm.
Figure 9: Deployment Of Two Types Of Sensors
Figure 10: The Actual Sensor Deployment
3. EXPERIMENTS
[image:6.612.349.482.389.551.2]398
3.1 Detection of Falling Accidents
The control unit in Fig.1 checks the patient posture at regular interval (at initial, set to 5 minutes) to prevent falling accident from a bed. A set of sensors deployed on the bed split vertically into three different subsets: left, center and right subset.
Depending on how many number of sensors of one subset compared to the other two subsets senses pressure, we can expect the patient posture in the bed and thus generate warning message against falling accident. For example, if more than 80% of sensors which belong to the left subset detect pressure, whereas less than 20% of sensors which belongs to both the center subset and the right subset, our smart bed system decides that the patient posture is the dangerous condition to fall from the bed.
3.2 Detection of Pressure Ulcers
If a patient is a supine position, his (her) height can be estimated by using the distance between the occipital area sensors and the sensors which are deployed farthest from the occipital area sensors. Based on average body size from the KATS, we do know which sensors are sensed which position of a patient. It is important because pressure ulcers have been occurred frequently in the specific patient position according to KATS.
In order to prevent pressure ulcers attacks caregivers should change the patient posture at least every 2 hours [10]. Whenever the pressure of the specific position continues more than 60 minutes, smart-bed system gives caregivers warning messages. When the pressure continues for 90 minutes, it sends an alarm to caregiver’s smart device to change the patient posture as soon as possible.
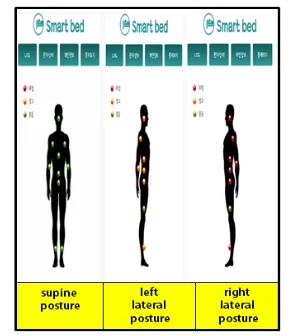
Fig.11 shows the duration time with respect to patient posture. The green, orange and red dot indicates the duration time of 30, 60 and 90 minutes, respectively. As shown in Fig.11, our smart-bed system can identify three types of the patient posture: supine and lateral (left, right) position. Fig.12 and Fig.13 show the patient posture and accumulated pressures daily, weekly, and monthly, respectively.
4. CONCLUSION
Our prototype smart-bed system can sense pressure occurred on a whole body of a patient at either fixed intervals or various intervals through an efficient deployment of sensors. The FSR sensors were placed in consideration of human body structure characteristics and motion patterns. In
[image:7.612.343.487.138.306.2]addition, it can detect the position with the highest possibility of pressure ulcers attack by finding the largest accumulated pressure.
Figure 11: Visualization Of The Duration Time Of Pressure With Respect To Supine Position (left), Lateral
[image:7.612.316.525.372.479.2]Position (center, right)
Figure 12: Patient Posture - Daily (left), Weekly (center), and Monthly (right)
Figure 13: Accumulated Pressure Of The Body Parts - Daily (left), Weekly (center), and Monthly (right)
[image:7.612.313.530.517.620.2]399 to nurse their patients more properly. Our system will be the one of the possible solution which prevents pressure ulcers and/or falling accident from the bed. Besides, it will be particularly useful in nursing homes and senior care centers.
ACKNOWLEDGMENTS
This work is supported by the 2015 Grant of Incheon National University.
REFRENCES
[1] Korea national statistics office, “Estimated future population”, 2011, pp. 2010-2060. [2] Health Insurance Review & Assessment Service,
National Health Insurance Statistical Yearbook for 2010, 2010
[3] Kim, E. K, “Resource use of the elderly in long-term care hospital using RUG-III”, Journal of Korean Academy of Nursing, Vol.33, No.2, 2003, pp. 275-283.
[4] Yoo, J. Y., Im, B. H, “A case study of major disease distributions and patterns of depression of the elderly inpatients of geriatric hospital”,
Health and Social Science, Vol.21, 2007, pp.
117-135.
[5] https://en.wikipedia.org/wiki/Pressure_ulcer [6] Takahashi, P. Y., Chandra, A., & Cha, S. S.,
“Risk factors for pressure ulceration in an older community-dwelling population”, Advances in
Skin and Wound Care, Vol.24, No.2, 2011, pp.
72-77.
[7] Song, H. J., Kim, S. M., & Kim, N. C, “A study of voiding patterns and pressure ulcer for the residents of long term care facilities”, Journal
of Korean Continence Society, Vol.7, No.2,
2003, pp. 91-97.
[8] Shin Kyung Rim, Kim Miyoung, Kang Younhee, Jung Dukyoo, Cha Chiyoung, Lee Eliza, Kim Yun Ju, Kweon Yoo Rim, “ Facility and Nursing Factors Influence on Pressure Ulcer Occurrence among Patients at Risk for Pressure Ulcer in Long-term Care Hospitals”, J. Korean Gerontol Nurs, Vol.14, No.1, 2012, pp. 30-39.
[9] A. F. Jorn, "Is depression a risk factor for dementia or cognitive decline?" A Review in Gerontology, Vol. 46, 2000, pp. 219-227.
[10] Y. J. Kim, J. W. Han, Y. S. So, J. Y. Seo, K. Y. Kim, K. W. Kim, “Prevalence and trends of dementia in Korea: a systematic review and eta-analysis”, J. Korean Med Sci., Vol. 29, No. 7,
2014, pp. 903-912.
[11] Moore, Z., Cowman, S., & Conroy, R. M., “A randomized controlled clinical trial of repositioning using the 30°tilt, for the prevention of pressure ulcers”, Journal of Clinical Nursing, Vol.20, No.17-18, 2011, pp.
2633-2644.