3-Level Techniques Comparison based Image
Recognition
Zainab Ibrahim Abood
Electrical Engineering Department, University of
Baghdad, Iraq
Ahlam Hanoon Al-sudani
Computer Engineering Department, University of
Baghdad, Iraq
ABSTRACT
Image recognition is one of the most important applications of information processing, in this paper; a comparison between 3-level techniques based image recognition has been achieved, using discrete wavelet (DWT) and stationary wavelet transforms (SWT), stationary-stationary-stationary (sss), stationary-stationary-wavelet (ssw), stationary-stationary (sws), stationary-stationary wavelet (sww), wavelet-stationary-stationary (wss), wavelet-stationary-wavelet (wsw), stationary (wws) and wavelet-wavelet-wavelet (www). Acomparison between these techniques has been implemented. according to the peak signal to noise ratio (PSNR), root mean square error (RMSE), compression ratio (CR) and the coding noise e (n) of each third level. The two techniques that have the best results which are (sww and www) are chosen, then image recognition is applied to these two techniques using Euclidean distance and Manhattan distance and a comparison between them has been implemented., it is concluded that, sww technique is better than www technique in image recognition because it has a higher match performance (100%) for Euclidean distance and Manhattan distance than that in www..
Keywords
3-level Techniques, image recognition, stationary wavelet transform, wavelet transform, feature extraction.
1. INTRODUCTION
Image recognition is the process of identifying and detecting an object or a feature in a digital image or video. This concept is used in many applications like systems for factory automation, toll booth monitoring and security surveillance [1]. Wavelet transform decomposes the input image into low-frequency coefficients and a number of high low-frequency bands which considered as low-pass and high-pass versions of the original image [2]. Wavelet transform in image recognition was introduced by Aleˇs Proch´azka, a selected mathematical methods used for image segmentation and application of wavelet transform for the following segments classification by multi-resolution decomposition of segments boundary signals The wavelet transform approach has been adopted and used for feature extraction allowing its use for image de-noising and resolution enhancement as well [3].
A flexible architecture for implementation Discrete Wavelet Transform (DWT) of 5/3 filter was proposed by Dhaha Dia, the architecture includes transforms modules, a RAM and bus interfaces. This architecture works in non-separable fashion using a serial-parallel filter with distributed control to compute all the DWT (1D-DWT and 2D-DWT) resolution levels. The so-called lifting scheme represents the fastest implementation of the DWT [4]. A robust image watermarking technique for the copyright protection based on
3-level discrete wavelet transform (DWT) was implemented by Nikita Kashyap, a multi-bit watermark is embedded into the low frequency sub-band of a cover image by using alpha blending technique. The insertion and extraction of the watermark in the gray-scale cover image is found to be simpler than other transform techniques. This method was compared with the 1-level and 2-level DWT based image watermarking methods by using statistical parameters such as peak-signal-to-noise-ratio (PSNR) and mean square error (MSE) [5].
Zainab Ibrahim, introduced content – based image retrieval (CBIR), four techniques were used, colored histogram features technique, properties features technique, gray level co-occurrence matrix (GLCM) statistical features technique and hybrid technique stationary-wavelet-wavelet (sww). For similarity measure, normalized Mahalanobis distance, Euclidean distance and Manhattan distance are used. The CBIR using hybrid technique is the better for image retrieval because it has a higher match performance (100%) for each type of similarity measure [6].
A digital image watermarking based on 3-level discrete wavelet transform (DWT) and compares it with 1 & 2 levels DWT, was presented by Pratibha Sharma. Performance of method for different values of scaling factor is analyzed & compared with 1 & 2 levels DWT method by using statistical parameters such as peak-signal-to-noise-ratio (PSNR) and mean square error (MSE) [7].
2. FEATURE EXTRACTION
The features allow finding images that are similar to the used test image. For different properties of images, different features may account. The goal of the feature extraction is to find an informative variables based on image data, so, it can be seen as a kind of data reduction [6].
In this work, the low-low sub-band of the third level of each technique is considered as the extracted features.
3. WAVELET TRANSFORM
Discrete wavelet transform employs two sets of functions, called scaling function and wavelet function, which are associated with low pass and high pass filters, respectively. The first level decomposition mathematical expressions are:
(1)
(2)
Nason and Silverman proposed a stationary wavelet transform (SWT), which is shift invariant and redundant, it is also called un-decimated wavelet transform. To image stationary wavelet transform, the 2-D image x(n, n) , (where n×n is the size of the image) is transformed into four sub-bands which can be labeled as LL, LH, HL and HH [6].
4. COMPARISON PARAMETERS
4.1 Peak Signal to Noise Ratio (PSNR)
The Mean Square Error (MSE) and the Peak Signal to Noise Ratio (PSNR) are the two error metrics used to compare image compression quality. The MSE represents the cumulative squared error between the compressed and the original image, whereas PSNR represents a measure of the peak error. The mean-squared error:(3)
where and are the original and compressed image, respectively. M and N are the number of rows and columns in the input images, respectively. The PSNR:
(4)
where R is the maximum fluctuation in the input image data type. For example, if the input image has a double-precision floating-point data type, then R is 1. If it has an 8-bit unsigned integer data type, R is 255, etc. [9].
4.2 Root mean square error (RMSE)
The root mean square error (RMSE) between the original image and compressed image is given by [10],RMSE = (5)
4.3 Compression ratio
Compression ratio is the ratio of the number of bits required to represent the image before compression to the number of bits required to represent image after compression [8]:
CR
=
(6)
4.4 Coding noise
if and be the original and reconstructed images, respectively, n is the length of the window over which the metrics are calculated, Then coding noise [8]:
- (7)
5. IMAGE RECOGNITION
Image recognition is one of the most important applications of information processing. Although it is easy for a person to recognize images, it is a classic difficult problem for a computer to do so. The main reason is that a computer lacks ability of adaptive learning. The inductive processes embody the universal and efficient means for extracting and encoding the relevant information from the environment, the evolution of intelligence could be seen, as a result of interactions of such learning, mechanism with the environment. In consensus
with this, any one strongly believe that the pivot of image recognition should be arranged around learning processes at all levels of feature extraction and object recognition [11]. In this work, image recognition using matching by measuring Euclidean distance and Manhattan has been implemented.
5.1 Euclidean distance
Euclidean distance is a distance measured between two feature vectors, d and t:
(8)
5.2 Manhattan distance
Manhattan distance is a distance measured between two feature vectors d and t [6]:
(9)
BLOCK DIAGRAM OF THE PROPOSED
TECHNIQUE
The proposed technique is 3-level techniques comparison based image recognition, here using techniques, where i = no. of levels, so there are 8 techniques, as shown in figure (1).
Transforms
6. PROPOSED TECHNIQUE
ALGORITHM
The proposed technique algorithm is:
1. Input the color or grey image of any size or format.
2. Convert the image to a grey-scale form (if it is color).
3. Resize the image into a square and power of two in order to apply DWT and SWT, the test and data images are resized to be of size (256*256) pixels.
4. Apply stationary wavelet (s) and discrete wavelet (w) transforms using haar to each image in the database and test set as follows:
S
S
S
S
S
S
S
S
S
W
W
W
W
W
W
W
W
W
1a. As a single level, apply 2-D stationary wavelet transform to all matrices, so it is (s).
1b. As a 2nd level, apply 2-D stationary wavelet transform to each low-low sub-band of each matrix (those produced from step 1a), so it is (s).
1c. As a 3rd level, apply 2-D stationary wavelet transform to each low-low sub band (those produced from step 1b) so it is (s), therefore, the technique here is sss.
2a. As a single level, apply 2-D stationary wavelet transform to all matrices, so it is (s).
2b. As a 2nd level, apply 2-D stationary wavelet transform to each low-low sub-band of each matrix (those produced from step 2a), so it is (s).
2c.. As a 3rd level, apply 2-D discrete wavelet transform to each low-low sub band (those produced from step 2b) so it is (w), therefore, the technique here is ssw.
3a. As a single level, apply 2-D stationary wavelet transform to all matrices, so it is (s).
3b. As a 2nd level, apply 2-D discrete wavelet transform to each low-low sub-band of each matrix (those produced from step 3a), so it is (w).
3c. As a 3rd level, apply 2-D stationary wavelet transform to each low-low sub band (those produced from step 3b) so it is (s), therefore, the technique here is sws.
And so on for sww, wss, wsw, wws...till reach to technique :
8a. As a single level, apply 2-D discrete wavelet transform to all matrices, so it is (w).
8b. As a 2nd level, apply 2-D discrete wavelet transform to each low-low sub-band of each matrix (those produced from
step 8a), so it is (w).
8c. As a 3rd level, apply discrete wavelet transform to each low-low sub-band (those produced from step 8b) so it is (w), therefore, the technique here is www.
5. For 3rd level of each technique, the parameters, PSNR, RMSE, CR and e(n) are calculated using eq’s.4, 5, 6 and 7 respectively.
6. A comparison between these techniques has been implemented according to these parameters. The two techniques that have the best results are sww and www.
7. Construct feature vectors by taking the low-low sub-band of the 3rd level of each these two techniques for the test and database images.
8. By using equations 8 and 9 respectively, compute
Euclidean distance and Manhattan distance between the test and database images in order to find the best matching for these two techniques.
7. TESTING AND EVALUATION OF
THE RESULTS
The results are shown in two figures that illustrate the model and chart; and three tables showing the results measured for the proposed system when applied on the data and test images:
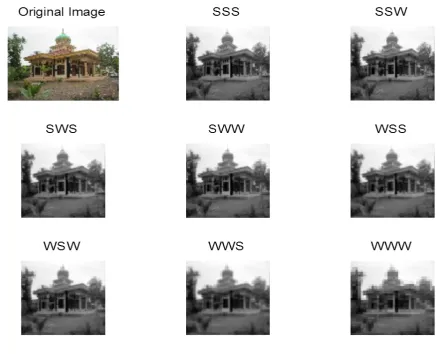
[image:3.595.74.521.399.753.2]Fig. (2) Illustrates the model, the original image and the images of the 3rd level of each technique (sss, ssw, sws, sww, wss, wsw, wws and www) of one of the test image that has been taken as a model.
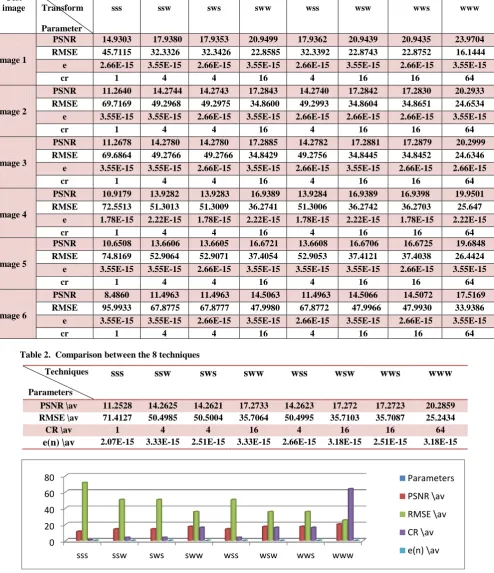
Table (1), shows a comparison between the eight techniques according to PSNR, RMSE, CR and e(n) of each third level (for samples of six test images).
Table (2), shows a comparison between the eight techniques according to the average values of PSNR, RMSE, CR and e(n) of each third level.
[image:4.595.54.554.169.787.2]The two techniques that have the best results are sww and www, while the other techniques have good results in one of these parameters only such as (sss), which has a least value of coding noise ( the difference between original and reconstructed image ) .This also illustrated in the chart shown in fig. 3.
Table 1. Comparison between the 8 techniques for six samples of test images
Table 2. Comparison between the 8 techniques
[image:4.595.57.552.185.759.2]
Figure 3
0 20 40 60 80
sss ssw sws sww wss wsw wws www
Parameters
PSNR \av
RMSE \av
CR \av
e(n) \av
Test image
Transform
Parameter
sss ssw sws sww wss wsw wws www
image 1
PSNR 14.9303 17.9380 17.9353 20.9499 17.9362 20.9439 20.9435 23.9704
RMSE 45.7115 32.3326 32.3426 22.8585 32.3392 22.8743 22.8752 16.1444
e 2.66E-15 3.55E-15 2.66E-15 3.55E-15 2.66E-15 3.55E-15 2.66E-15 3.55E-15
cr 1 4 4 16 4 16 16 64
image 2
PSNR 11.2640 14.2744 14.2743 17.2843 14.2740 17.2842 17.2830 20.2933
RMSE 69.7169 49.2968 49.2975 34.8600 49.2993 34.8604 34.8651 24.6534
e 3.55E-15 3.55E-15 2.66E-15 3.55E-15 2.66E-15 2.66E-15 2.66E-15 3.55E-15
cr 1 4 4 16 4 16 16 64
image 3
PSNR 11.2678 14.2780 14.2780 17.2885 14.2782 17.2881 17.2879 20.2999
RMSE 69.6864 49.2766 49.2766 34.8429 49.2756 34.8445 34.8452 24.6346
e 3.55E-15 3.55E-15 2.66E-15 3.55E-15 2.66E-15 3.55E-15 2.66E-15 2.66E-15
cr 1 4 4 16 4 16 16 64
image 4
PSNR 10.9179 13.9282 13.9283 16.9389 13.9284 16.9389 16.9398 19.9501
RMSE 72.5513 51.3013 51.3009 36.2741 51.3006 36.2742 36.2703 25.647
e 1.78E-15 2.22E-15 1.78E-15 2.22E-15 1.78E-15 2.22E-15 1.78E-15 2.22E-15
cr 1 4 4 16 4 16 16 64
image 5
PSNR 10.6508 13.6606 13.6605 16.6721 13.6608 16.6706 16.6725 19.6848
RMSE 74.8169 52.9064 52.9071 37.4054 52.9053 37.4121 37.4038 26.4424
e 3.55E-15 3.55E-15 2.66E-15 3.55E-15 3.55E-15 3.55E-15 2.66E-15 3.55E-15
cr 1 4 4 16 4 16 16 64
image 6
PSNR 8.4860 11.4963 11.4963 14.5063 11.4963 14.5066 14.5072 17.5169
RMSE 95.9933 67.8775 67.8777 47.9980 67.8772 47.9966 47.9930 33.9386
e 3.55E-15 3.55E-15 2.66E-15 3.55E-15 2.66E-15 3.55E-15 2.66E-15 3.55E-15
cr 1 4 4 16 4 16 16 64
Techniques
Parameters
sss
ssw
sws
sww
wss
wsw
wws
www
PSNR \av 11.2528 14.2625 14.2621 17.2733 14.2623 17.272 17.2723 20.2859
RMSE \av 71.4127 50.4985 50.5004 35.7064 50.4995 35.7103 35.7087 25.2434
CR \av 1 4 4 16 4 16 16 64
Table (2) and (3) show the results of the recognition in sww and www respectively, for samples of 6 of the test images and 16 of the data base images using Euclidean distance and Manhattan distance. ”0” is referred to not recognized, while, “1” is referred to recognized.The techniquesww has a higher
match performance (100%) than www because it recognized all the images using Euclidean and Manhattan distance, while in the www, not all the images has been recognized as shown in the values that have been surrounded by an ovals.
Table 2. Image recognition for sww
[image:5.595.92.503.181.580.2]
Table 3. Image recognition for www
8. CONCLUSIONS
In a 3-level techniques comparison based image recognition,
the two techniques, among eight techniques, that have the best results in acomparison according to PSNR, RMSE, e(n) and CR are sww and www and the best one is www. But in the image recognition, the amount of information and the effectiveness of the features used was determine the
recognition performance
,
sww has a higher match performance (i.e., 100%) than www in Euclidean and Manhattan distance, so it is the best in the image recognition. It is concluded that sww is the best transform for image recognition; and www is the best transform for image compression. For a future work, the same technique will be used but for speech recognition.sww Recognition
Euclidean distance
Manhattan distance
test1 test2 test3 test4 test5 test6 test 1
test2 test3 test4 test5 test6
data1 1 0 0 0 0 0 1 0 0 0 0 0
data2 0 0 0 0 0 0 0 0 0 0 0 0
data3 0 0 1 0 0 0 0 0 1 0 0 0
data4 0 0 0 1 0 0 0 0 0 1 0 0
data5 0 0 0 0 0 0 0 0 0 0 0 0
data6 0 0 0 0 1 0 0 0 0 0 1 0
data7 1 0 0 0 0 0 1 0 0 0 0 0
data8 0 0 0 0 0 1 0 0 0 0 0 1
data9 0 1 0 0 0 0 0 1 0 0 0 0
data10 0 0 0 0 0 1 0 0 0 0 0 1
data11 1 0 0 0 0 0 1 0 0 0 0 0
data12 0 0 0 0 0 1 0 0 0 0 0 1
data13 1 0 0 0 0 0 1 0 0 0 0 0
data14 0 0 0 0 0 1 0 0 0 0 0 1
data15 0 0 0 0 0 1 0 0 0 0 0 1
data16 1 0 0 0 0 0 1 0 0 0 0 0
www Recognition
Euclidean distance
Manhattan distance
test1 test2 test3 test4 test5 test6 test 1
test2 test3 test4 test5 test6
data1 1 0 0 0 0 0 1 0 0 0 0 0
data2 0 0 0 0 0 0 0 0 0 0 0 0
data3 0 0 1 0 0 0 0 0 1 0 0 0
data4 0 0 0 1 0 0 0 0 0 1 0 0
data5 0 0 0 0 0 0 0 0 0 0 0 0
data6 0 0 0 0 1 0 0 0 0 0 1 0
data7 1 0 0 0 0 0 1 0 0 0 0 0
data8 0 0 0 0 0 1 0 0 0 0 0 1
data9 0 1 0 0 0 0 0 1 0 0 0 0
data10 0 0 0 0 0 0 0 0 0 0 1
data11 1 0 0 0 0 0 1 0 0 0 0 0
data12 0 0 0 0 0 1 0 0 0 0 0
data13 1 0 0 0 0 0 1 0 0 0 0 0
data14 0 0 0 0 0 1 0 0 0 0 0 1
data15 0 0 0 0 0 1 0 0 0 0 0 1
data16 1 0 0 0 0 0 1 0 0 0 0 0
9. REFERENCES
[1]Matlab R2014a Computer Vision System Toolbox, “Recognition methods in image processing”.
[2]Othman Khalif, “Wavelet Coding Design for Image Data Compression”, The International Arab Journal of Information Technology, Vol.2; No. 2; April 2005.
[3] Aleˇs Proch´azka, Andrea Gavlasov´a, and Karel Volka, “Wavelet transform in image recognition”,
[4] Dhaha Dia, Medien Zeghid, Taoufik Saidani, Mohamed Atri, Belgacem Bouallegue, Mohsen Machhout and Rached Tourki,“Multi-level Discrete Wavelet Transform Architecture Design”, Proceedings of the World Congress on Engineering 2009 Vol I, July 1 - 3, 2009, London, U.K.
[5] Nikita Kashyap and G. R. SINHA, “Image Watermarking Using 3-Level Discrete Wavelet Transform (DWT)”, I.J.Modern Education and Computer Science, April 2012 in MECS (http://www.mecs-press.org/), 50-56.
[6]Zainab Ibrahim Abood, Israa Jameel Muhsin and Nabeel Jameel Tawfiq, “Content-Based Image Retrieval (CBIR) Using Hybrid Technique”, International Journal of Computer Applications Vol. 83 – No 12, December 2013, p17-24,
[7] Pratibha Sharma and Shanti Swami, ”Digital Image Watermarking Using 3 level Discrete Wavelet Transform”, Conference on Advances in Communication and Control Systems 2013, 129-133, [email protected], [email protected].
[8] Zainab Ibraheem Abood, “Image Recognition using 3-D Two-LevelTechniques”, Journal of Engineering, Vol. 19,
No.11, November 2013, 1407-1424,
[9] Matlab7.8.0 (R2009a) Image Processing Toolbox, “Video and Image Processing Blockset”.
[10] Kanagaraj Kannan, Subramonian Arumuga Perumal and Kandasamy Arulmozhi, “Optimal Decomposition Level of Discrete, Stationary and Dual Tree Complex Wavelet Transform for Pixel based Fusion of Multi-focused Images”,
Serbian Journal of Electrical Engineering, Vol. 7, No. 1, May 2010,81-93,[email protected] , [email protected] , [email protected]
[8] Y. Min, J. Zhtwei, Y. Wensheng, and Z. Xiaornin, “Applications of Generalized Learning in Image Recognition", IEEE, First International Conference on Neural Interface and Control Proceedings, 26-28 May 2005, 159-162.