Vol.1, No.1, 2013; ISSN 2289 4497 Published by ZW Publisher
11
Application of Peat Filter Media in Treating Kitchen
Wastewater
Radin Maya Saphira Radin Mohamed*, Chee-Ming Chan **, Hasyimah Binti Ghani*, Mohd Azarudin b. Mat Yasin*, Amir Hashim Mohd. Kassim*
* Department of Water and Environmental Engineering, Faculty of Civil & Environmental Engineering,
Universiti Tun Hussein Onn Malaysia, Batu Pahat, Johor, Malaysia. **
Department of Civil Engineering Technology, Faculty of Engineering Technology, Universiti Tun Hussein Onn Malaysia, Batu Pahat, Johor, Malaysia.
*Corresponding Email : [email protected]
Abstract—
A l
aboratory set up was used to determine the treatment capacity and effectiveness of bio-treatment system, which consists of a gravel-sand pre-treatment layer followed by a natural peat layer as the primary filter medium to treat kitchen wastewater by percolation. The filter column contained a 50 cm layer of peat lightly compacted to a density of 0.150 g/cm3 and supplied with 10 cm kitchen wastewater per day. The treatment gave the following reductions: SS, 72%; CODtot, 37%; BOD5, 40% and NH+4 -N, 87%. The effluent had a pH of 6.6-6.7. The physical properties of the peat did not appear to be significantly affected by the applied densities of a kitchen wastewater percolation (α = 0.05), as suggested by the voids ratio - applied pressure plots, which shows relatively unchanged compression characteristics pre- and post- filtration. However, the XRF test results show that Silicon Dioxide (SiO2) and Aluminium Oxide (Al2O3) increased after filtration. It was also shown in the study that peat can be potentially used for the removal of pollutants, with the post-filter water quality parameters complying well within the limits of Standard B effluent stipulated in the Environmental Quality Act 1974 (Sewage and Industrial Effluents, 2009). Thus, peat media can serve as a sustainable, effective and economical option for the filtration of kitchen greywater.
Keywords: Kitchen wastewater, Peat, Filtration
I. INTRODUCTION
Malaysia is one of the developing countries with increased the number of human population. From the statistic the population of human in Malaysia 23.27 million in 2000 are increase 2.67% to 28.4 million in 2010 [1]. The growing population contributed to the increase in water demand across the country. Water effluent discharged by industrial, housing and agriculture, both in large scale, medium or small, are among the causes of and contributors to pollution, especially when it discharge into rivers, lake and ocean. Water pollution has its ability imposing threats to the socioeconomic development and eco-systems particularly in highly populated areas [2].
Amongst water pollution causes, wastewater emerging from the kitchen sink has high organic material from the food dishes as well as oil and grease. In many developing countries, most of kitchen activities often let the polluted water flow into rivers and stream without treatment [3]. Unrestricted disposal of kitchen wastewater to land can cause eutrophication if it enters ponded surface water in large enough quantities. Furthermore, the stagnant kitchen wastewater can become anoxic and create unpleasant odours by the release nutrients such as ammonia as well as providing a breeding environment for insect pests. The characteristics of kitchen wastewater effluent are quite variable among households due to the type of cooking’s and dietary preferences. [4] found kitchen wastewater had the highest Escherichia Coli (EC) due to the input of provider with treatment. Therefore, it is important to give measures of kitchen wastewater treatment to protect both environment and health.
12 use on kitchen wastewater has not been presented in the literature.
Through this study, a filter system has been established to overcome this problem by providing a filter system for kitchen wastewater. This system use peat soil as filter media to treat kitchen wastewater. This study is able to see the effectiveness of peat to treat kitchen wastewater before being discharged and consequently can reduce the pollution load to the water bodies.
II. METHODOLOGY
2.1 Kitchen Wastewater Sampling
The site investigation has shown that the kitchen wastewater was discharged directly from the house to the drain outside the area of residential. One unit village house in Kg. Parit Haji Rasipan was selected because of discharge pipe for kitchen wastewater near the drain. An interview for daily activities was needed to know the activities undertaken routinely by the occupants of the house. Composite wastewater samples were collected over 24 h using barrels that were previously graduated over the height for the purpose of flow measurement. Contents of the barrels were mixed thoroughly before sampling. Collected samples were transferred to Environmental Engineering lab and analyzed for pH, EC, total suspended solids (TSS), biological oxygen demand (BOD), chemical oxygen demand (COD) and ammonial nitrogen (NH+4 -N). The experiments were conducted in three replicates sampling collected from the house from February 2013 to May 2013.
2.2 Filter Media
Figure 1 shows the design of filter media. Four model of filter were prepared to evaluate the replicacy settings. Control model was prepared to simulate the irrigation with tap water. The filter was using a container sized 410mm x 300 mm x 255 mm and it can store about 20 liter of water. The filter was designed based on the gravity concept. Filter columns containing a layer of 50 cm peat packed at a density of 0.150 g/cm3 and supplied with 10 cm kitchen wastewater.
First stage was a screening process as shown in the pre-treatment compartment. It contains gravel layer filling up to 3 inch height and sand layer filling up to 4 inch. The purpose was to screen particles, silts associated from raw kitchen wastewater and preparing the liquid based for the peat filter media. This compartment was supported by fine sand.
[image:2.595.56.304.753.841.2]Peat filter consist three layers which were peat soil, charcoal and gravel. Peat soil was filled up to 3 inch, charcoal 2 inch and sand up to 2 inch. Charcoals were applied to remove the color and odor of raw kitchen wastewater. According to [9], charcoal was identified as a material that can reduce turbidity of kitchen wastewater. Gravel was again placed at the final layer as support layer and also functioned to filter fine impurities. The peat filter was filled in loose condition in order to allow kitchen wastewater pass through the filter. Mosquito net and wire mesh were used to separate layer and to avoid the peat soil taken down during filtration process.
Figure 1. Filter media consisting; (i) Gravel + sand (pre-treatment) and (ii) Peat + charcoal + gravel
2.3 Peat soil analysis
Peat soils used for filter media were taken from Kampung Parit Nipah. It was sampled by using the disturbed sampling technique, where chunks of peat deposit were simply retrieved for remoulding in the laboratory. Sampling was conducted at approximately 300 mm from the ground surface to avoid including surface and near-surface debris from the samples collected. All samples were then transported to the laboratory for tests in accordance with the British Standards, BS1377: 1990. The soil tests included moisture content (Oven-drying Method), specific gravity, loss on ignition, organic contents, Atterberg limit, pH and 1-dimensional consolidation. Complementary XRF analysis was carried out on the peat samples to monitor the elemental content of the pre and post filtration. The 1-dimensional consolidation and XRF tests were performed mainly to compare the peat soil’s preperties pre- and post- filtration, and to identify possible chemical reactions resulting from the greywater – peat interaction during percolation in the system.
2.4 Post Filtration Analysis
Kitchen wastewater passes through the filter were collected and testing was done to get their parameter. Samples of filtered kitchen wastewater were collected in two sanitized PP 40-mL flasks and analysed for the physicochemical parameters
analyses. Chemical tests were included pH (sensION 378
Laboratory Multiparameter Meter), BOD5 (HACH senION8 Dissolved Oxygen) and COD (HACH Reactor). Turbidity, Suspended Solid and Ammonia Nitrogen were used HACH DR 5000 Spectrophometer.
III. RESULTANDANALYSIS
Gravel
13 Summary data of the quality of raw and treated kitchen is shown in Table 1. The pH, conductivity, DOC, and TSS results of raw kitchen wastewater showed a good compatibility with all data
reported in literature [10, 11, 12]. Concerning turbidity, COD,
and BOD values some of them were lower the maximum referenced in literature. It should be underlined that households where high organic fraction and soaps were used led to higher TSS, turbidity, COD, and BOD values. As all of these parameters characterize a pollution, the efficiency of any treatment would much depend on cooking style and dishwashing products used rather than on the family composition.
The analysis of filtered kithen wastewater shows that the pH
concentrations were improved from acidic to neutral. pH concentration in wastewater was generally acidic (5.9-7.4) mostly contributed from organics compound in foods such as citrus fruits, pickles and sauces. The pH of the treated kitchen wastewater gradually increased from 4.6 to 6.9 with increasing duration of time possibly due to decomposition of organic materials into peat soil. Peat was content with positively charged ions. Negatively charged ions in the kitchen wastewater were highly attracted and adhered to peat. As the kitchen wastewater flows through the peat, particles were absorbed by the peat and removed from the flow. Treated kitchen wastewater also has shown better quality during the period of treatment by the reduction of BOD, COD, AN, TSS and turbidity concentrations.
TABLE I. SUMMARY OF KITCHEN WASTEWATER QUALITY BEFORE AND AFTER TREATMENT WITH PEAT SOIL FILTER MEDIA (NO. OF SAMPLES, N= MEAN + STANDARD DEVIATION)
Table 1 Summary of kitchen wastewater quality before and after treatment with peat soil filter media (no. of samples, n=3; mean + standard deviation)
Parameter
Kitchen wastewater concentration (mg/L)
Day 1 Day 7 Day 14 Day 28
Before After Before After Before After Before After
pH 4.6 6.9 0.2 4.2 6.6 0.1 4.71 6.8 0.2 4.4 6.9 0.2
BOD
(mg/L) 88 61 4 72 48 5 67 37 2 69 32 2
COD
(mg/L) 149 122 7.55 143 98
15.63 128
73
5.03 135 66 4.04
AN
(mg/L) 12.83 8.28 0.27 15.30 4.32
0.21 12.74 1.54
0.17 13.30 1.73 0.07 TSS
(mg/L) 312 205 16 296 176 8 234 53 6 212 40 3
Turbidit y (NTU) 298.0
193.3
16.26 267.0
164.3 7.37 210.0
43.7
5.03 198.0 31.7 3.50 Oil and
Grease 136.6 26.42 219.2 24.5 178.8 31.8 199.34 25.24
Figure 2 shows the BOD concentration for raw and treated kitchen wastewater. The application of peat soil was considered to give sufficient microorganism for degrading organic pollutant in the wastewater. Microbes in the peat soil break down organic matter in the kitchen wastewaters. The concentration of BOD for raw kitchen wastewater was 88 mg/L. After filtered with peat filter media, the BOD concentration was decreased gradually to 63 mg/L, 40 mg/L and 33 mg/L on the 7th, 14th and 28th day of filtration. The percentages of removals were 19%, 32% and 40% respectively.
[image:3.595.306.546.101.255.2]However, the better performance was achieved in [11] study on greywater treatment using filter material from bark, activated charcoal, foam and sand. The treatment had showed the efficient removal of the BOD concentration. From result, bark material reduced 98%, activated charcoal reduced 97%, foam reduced 97% and sand reduced 75% of BOD removal respectively. However, [12] shows 60% percent of BOD removal in treating raw greywater using sand filter material.
Figure 2. Removal efficiency of BOD
The removal efficiency of COD for the raw and treated kitchen wastewater is shown in Figure 3. The concentration of COD in raw kitchen wastewater was 148 mg/L. According to [13] the COD was generally higher than the BOD measure of a given sample by the amount of refractory organics in the sample. It is postulated that chemical substance was ineffective when react with peat soil. After filtered with peat filter media, COD concentration was decreased gradually to 116mg/L, 92 mg/L and 85 mg/L on the 7th, 14th and 28th day of filtration. The percentages of removal were 15%, 36% and 37% respectively.
However, according to studies from Jordan [13, 14], shows that treated raw greywater sample from rural area were removed 72% of COD. The COD removal efficiency achieved in the four barrel and confined trench (filled with gravel media). It shows that the ability of filter media to remove COD. In terms of the parameters, the filtration for 28th day raw kitchen wastewater filtered with peat soil was the best among others because it gave lowest COD value.
Figure 3. Removal efficiency of COD
Figure 4 shows the graph of Ammonia Nitrogen (NH+ 4 –N) against time for untreated and treated raw kitchen wastewater. From the graph, the highest value of NH+
[image:3.595.314.556.518.677.2]of NH+4 -N indicate the level of odor derived from kitchen wastewater. This was most probabaly the raw kitchen wastewater contain significant amount of nitrogen. Raw kitchen wastewater contains food particles, oils, fats and that contain nitrogen from the product of our eating habit and food preparation. However, the value of NH+4 -N decreased after filtration process. The removal efficiency percentage of NH+4 -N was ranging from 77% to 87%.
Figure 4. Removal efficiency of Ammonia Nitrogen
[image:4.595.307.547.412.559.2]Figure 5 shows the graph of suspended solid (SS) against time for untreated and treated raw kitchen wastewater. The highest concentration of SS was before kitchen wastewater treated with peat filter. Result from raw kitchen wastewater indicates that the SS was in the range of 274 mg/L to 234 mg/L. In this study, SS were found to be lower after treatment process. It shows the values of SS decreased dramatically by following day from 140 mg/L to 65 mg/L. The removal efficiency percentage was from 49% to 72%. The suspended solid in the kitchen wastewater reduced from 3.8 mg/L in the effluent to 0.6 mg/L in the effluent by using a slanted soil filter. It shows that soil treatment system could remove organic pollutant and SS partially. All the value of SS for kitchen wastewater were in range of permitted value for Standard B which the maximum value of SS was 100 as referred to the Environmental Quality Regulation, 2009.
Figure 5. Removal efficiency of Suspended Solids
4.0 Effects to peat soil filter media
4.1 1- Dimensional Consolidation Test
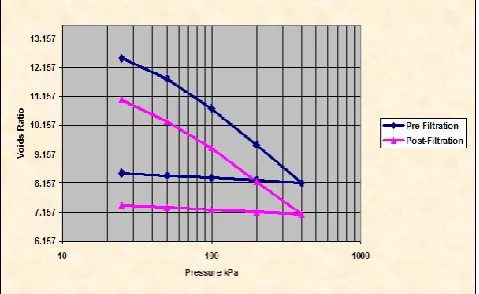
The test was conducted to examine the settlement behaviour of the samples when subjected to different loading. The compression curves for samples pre- and post-filtration are shown in Figure 6. The relevant consolidation parameters, such as coefficient of consolidation (cv) and coefficient of volume compressibility (mv) were identified. The loads used were 1.25, 2.5, 5.0, 10.0 and 20.0 kg.
Referring to Figure 6, it is apparent that the void ratio of both the samples was reduced with the incremental loading. The load-deformation curves did not show much difference in terms of the gradient, indicating similar compressibility characteristics. The total void ratio reduction was very similar too, i.e. 40 %. The unloading or swelling curve did not show much difference too between the two. However the initial void ratio of the post-filter sample was approximately 8 % lower than that of the pre-filter one, suggestive of enhanced structural formation of originally loose and weak soil mass. A higher void ratio could lead to increased percolation rate, and a higher water retention capacity in the peat. As such, the filtration rate would be gradually reduced with time as the voids were somehow ‘clogged up’ by large impurities in the kitchen wastewater. This corroborates well with water quality data shown in Table 1, where the total suspended solids (TSS), turbidity as well as oil and grease were markedly reduced with the filtration system. In addition, this reduction in void ratio is likely to be due largely to physical filling up of the voids by the solid impurities in the water than biological reactions, as depicted by the reduced BOD and COD (Table 1).
Figure 6. Voids Ratio versus Applied Pressure for Samples Pre and Post-Filtration
[image:4.595.58.294.553.717.2]15 structure formation could be enhanced, resulting in further reduction of compressibility and enhanced stiffness of the peat media. Nonetheless as a filtration system, the ‘clogging’ of the voids within the peat would have effectively slowed down the percolation rate, making the system ineffective as a whole. Such contradicting mechanisms require further investigation if an optimum combination of both phenomenon, with some physical modifications of the peat for instance, is to be identified to improve the filtration system.
[image:5.595.53.290.184.339.2]Figure 7. Coefficient of Consolidation, Cv
Figure 8. Coefficient of Volume Compressibility, Mv
4.2 XRF Test
The X-Ray Fluorescence (XRF) was conducted to identify and measuring the levels of elements in a sample and the percentage of inorganic content. Figure 9 shows the result of inorganic content for pre and post-filtration peat soil sample. Among the inorganic content that had been defined from the XRF test was Magnesium Oxide (MgO), Potassium Oxide (k2O), Aluminium Oxide (Al2O3), Silicon Dioxide (SiO2), and Ferum Oxide (Fe2O3).
From the chart, inorganic content of Ferum Oxide (Fe2O3) for pre-filtration sample obtained the highest percentage with 45.80% compared to post-filtration sample only was 17.40%. The differences percentage for both pre and post-filtration sample was 28.4% or 62% of reduction from pre-filtration sample. This was probably because the Ferum Oxide (Fe2O3) in the kitchen wastewater retained in the peat soil layer during the filtration process.
Silicon Dioxide (SiO2) and Aluminium Oxide (Al2O3) was increased after filtration where the pre-filtration sample percentage was only 22.30% and 7.88% while for post-filtration 33.60% and 10.70%. The percentage of this increment was in the range 26.4% to 50.7% after filtration.
Another percentage of inorganic content is Magnesium Oxide (MgO) and Potassium Oxide (k2O). From the chart, it was shows that percentage of Magnesium Oxide (MgO) and Potassium Oxide (k2O) below 11% and there were no significant differences of inorganic contents concentrations pre and post filtration. It has stated that low concentrations of heavy metals will not harm to health otherwise it was exceed the permitted value as indicated in the health and food regulations.
Figure 9. Results of inorganic content of peat for pre and post filtration
IV. CONCLUSION
The use of peat soil as a filter media for kitchen wastewater significantly gave the following reductions: SS, 72%; CODtot, 37%; BOD5, 40% and NH+4 -N, 87%. The effluent had a pH of 6.6-6.7. The better reduction can be achieved for the prolong period of study. The effects of peat soil associated with kitchen wastewater show no significant changes. The graph voids ratio versus applied pressure shows that there no significant difference in their properties between pre and post filtration. However, the XRF tests show that the minerals Silicon Dioxide (SiO2) and Aluminium Oxide (Al2O3) was increased after filtration. The study shown that peat has a potential in removing pollutant to comply standard B, Environmental Quality Act 1974 (Sewage and Industrial Effluents, 2009).
ACKNOWLEDGMENT
This work was successfully completed due to the dedication and commitment from the team works starting from the experimental set-up until data analysis.
REFERENCES
[1] Department of Statistics. Population and Housing Census, Malaysia (2010) CENSUS)” Copyright © 2011 Department of Statistics, Malaysia Official from Website (http://www.statistics.gov.my). 2010.
[2] Lake, P.S. and N. Bond. “Australian futures: Freshwater ecosystems and human water usage”. Futures 39: 288-305. 2007.
[image:5.595.52.290.280.471.2][4] Eriksson E., (2001). “Potential and Problems Related To Reuse of Water In Household”. Published by Environment & Resources, Technical University of Denmark.
[5] Deboucha, S., H. Roslan and A. Alwi. “Engineering Properties of Stabilized Tropical Peat Soils”. Published by EJGE Vol. 13, Bund. E. Journal. 2008.
[6] Leong, E.C. and C.Y. Chin. “Geotechnical characteristics of peaty soils in Southeast Asia”. Nanyang Technological University, School of Civil & Structural Engineering , Singapore. Journal.1997.
[7] Pérez,J.I., E. Hontoria, M. Zamorano and M. A. Gόmez, “Wastewater Treatment Using Fibrist and Saprist Peat: A Comparative Study,” Journal of Environmental Science and Health A, Vol. 40, No. 5, pp. 1021-1032. 2005.
[8] Gustafson, D.M. “Innovative Onsite Sewage Treatment Systems – Peat Filters”. University of Minnesota. 2004.
[9] Christina, B. “Biochar and activated carbon filters for greywater treatment : comparison of organic matter and nutrients removal.”Second cycle, A2E. Uppsala: SLU, Dept. of Energy and Technology. 2012.
[10] Eriksson, E., K. Auffarth, M. Henze, and A. Ledin. 2002. “Characteristics of grey wastewater”. Urban Water 4:85– 104.2002.
[11] Jefferson, B, A Laine, S Parsons, T Stephenson, and S Judd. “Technologies for domestic wastewater recycling”. Urban Water 1:285-292.1999.
[12] Jefferson, B, A Palmer, P Jeffrey, R Stuetz, and S Judd. “Grey water characterisation and its impact on the selection and operation of technologies for urban reuse”. Water Science and Technology 50 (2):157– 164.2004.
[13] M. Halalsheh, M., S. Dalahmeh, M. Sayed, W. Suleiman, M. Shareef, M. Mansour, M. Safi. “Grey water characteristics and treatment options for rural areas in Jordan.” Bioresource Technology 99 6635– 6641. 2008.