CFD Analysis of Air Cooled Condenser by Using
Copper Tubes and Aluminum Fins
Mallikarjun
1, Anandkumar S Malipatil
2Abstract--In systems involving heat transfer, a condenser is a device or unit used to condense a substance from its gaseous to its liquid state, typically by cooling it. In so doing, the latent heat is given up by the substance, and will transfer to the condenser coolant. Condensers are typically heat exchangers which have various designs and come in many sizes ranging from rather small to very large industrial-scale units used in plant processes. Air cooled condensers are used in small units like household refrigerators, deep freezers, water coolers, window air-conditioners, split air-conditioners, small packaged air-conditioners etc. These are used in plants where the cooling load is small and the total quantity of the refrigerant in the refrigeration cycle is small. Air cooled condensers are also called coil condensers as they are usually made of copper or aluminum coil. Air cooled condensers occupy a comparatively larger space than water cooled condensers.
In this work heat transfer by convection in air cooled condensers is studied and improved. The assessment has been carried out on an air-cooled finned-tube condenser of a vapour compression cycle for air conditioning system. Heat transfer analysis and CFD analysis is done on the condenser to evaluate the better design and material. The materials considered for tube is copper and for fins are Aluminum alloys 1100, 6063 and Magnesium alloy for different refrigerants HCFC and 404R. CFD analysis is done at different velocities. Theoretical calculations are done to determine heat transfer rate.
Keywords: Air cooled condenser, Heat Flux, Mesh generation, Refrigerants HCFC & 404R, Static pressure
I. INTRODUCTION
A condenser or evaporator is a heat exchanger, allowing condensation, by means of giving off, or taking in heat respectively Refrigerant and air will be physically separated, at air conditioner condenser, and evaporator. Therefore, heat transfer occurs by means of conduction. Air-cooled condensers are increasing in popularity because of the absence of water piping, the consequent simplicity of operation and the freedom from any health risk associated with the use of spray water. One objection to their use is that the capacity of the refrigeration plant does not gradually reduce as the ambient dry-bulb rises but ceases suddenly when the high pressure cut-out operates. A partial solution is to arrange for some of the compressor to be unloaded when the condensing pressure rises, before it reaches the cut-out point. It is a good plan to select air-cooled condensers to operate in an ambient temperature two or three degree higher than the design value chosen for the rest of the air conditioning system.M. M. Awad
et.al studied heat transfer by convection in air cooled condensers. E.F. Gorzelnik, indulged in the recovery of energy in the heat of compression from air conditioning, refrigeration, or heat-pump equipment in 1977 itself . PSS. Srinivasan et.al.
discussed in studies on Waste Heat Recovery from an Air Conditioning Unit that the energy can be recovered and utilized without sacrificing comfort level in 2011. P.Suresh Mohan Kumar Confabulated that he used intercooler which increases the efficiency of Air Conditioning system in 2012. Kaushik and SinghConfabulated about 40 percent of heat is recovered using Canopus heat exchanger in 1995.
II. PROBLEM DEFINITION
The assessment has been carried out on an air-cooled finned-tube condenser of a vapor compression cycle for air conditioning system.
The materials used for tube is copper and for fins are Aluminum Alloy 1100, Aluminum alloy 6063 and Magnesium. The refrigerants are HCFC, 404R.
Cooling load calculations are done to determine the capacity of air conditioner required to cool the required room.
Thermal flux calculations are done theoretically to compare the results with analytical results.
3D modeling is done in Pro/Engineer. The dimensions of the condenser are taken from the component itself using reverse engineering process.
Heat transfer analysis is done on the condenser to evaluate the better design and material. Analysis is done in Ansys. The analysis is done to verify the heat transfer rate, temperature distribution.
CFD analysis is also done on the fin for two refrigerants HCFC and 404R at different fluid velocities 2.5m/s, 5m/s and 7.5m/s.
III. METHODOLOGY
In all of the approaches the procedure followed is.
During preprocessing the geometry (physical bounds) of the problem is defined.
The volume occupied by the fluid is divided into discrete cells (the mesh). The mesh may be uniform or non-uniform. The physical modeling is defined –for example, the equations of motion + enthalpy + radiation + species conservation.
Boundary conditions are defined. This involves specifying the fluid behavior and properties at the boundaries of the problem. For transient problems, the initial conditions are also defined.
The simulation is started and the equations are solved iteratively as a steady-state or transient. Finally a postprocessor is used for the analysis and visualization of the resulting solution.
IV. RESULT AND DISCUSSIONS
A. Thermal Analysis Of Condenser
File >import>IGES>ok>browse>select file>ok Preferences>select thermal>ok
Postprocessor>materialproperties>material models
Used materials for condenser
Aluminum1100,Aluminum6063,Magnesium, Copper
Thermal analysis of condenser for HCFC refrigerant Al 1100 for fins
Thermal conductivity=230w/mk, Specific heat=900J/Kg.k, Density=2705Kg/m3
Copper for tubes
Thermal conductivity=390w/mk, Specific heat=390J/Kg.k , Density=8900Kg/m3
B. Boundary conditions
Loads>apply>thermal>temperature>select temperature area>ok>enter-temperature value>313k>ok
The temperature is applied inside the tube of the condenser
Convection>onareas>selectconvection area>enter film coefficient value=0.0024w/m2Loads>define Bulk temperature value=303k
The convection is applied on the fins
Solution>solve>current Ls>ok
[image:3.612.50.562.234.722.2]General post processor>plot results>counter plot>nodal solution>dof solution>nodal temperature>ok
Figure 4.1: Heat flux
Thermal analysis of condenser for HCFC refrigerant Al6063 for fins
Copper for tubes
Thermal conductivity=390w/mk, Specific heat=390J/Kg.k, Density=8900Kg/m3
Loads>define loads>apply>thermal>temperature>select temperature area>ok>enter temperature value>313k>ok Convection>on areas>select convection area>enter film coefficient value=0.0024w/m2
Bulk temperature value=303k Solution>solve>current Ls>ok
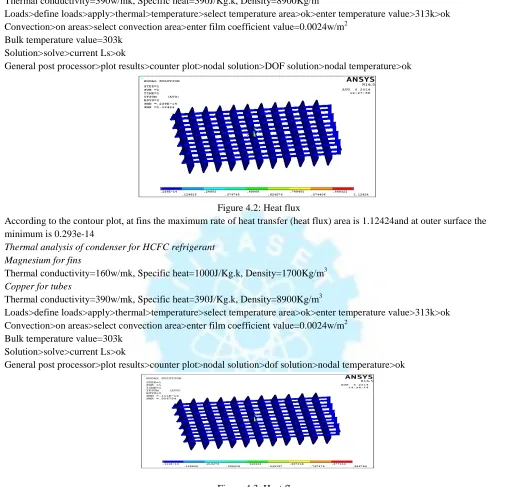
[image:4.612.47.555.101.588.2]General post processor>plot results>counter plot>nodal solution>DOF solution>nodal temperature>ok
Figure 4.2: Heat flux
According to the contour plot, at fins the maximum rate of heat transfer (heat flux) area is 1.12424and at outer surface the minimum is 0.293e-14
Thermal analysis of condenser for HCFC refrigerant Magnesium for fins
Thermal conductivity=160w/mk, Specific heat=1000J/Kg.k, Density=1700Kg/m3
Copper for tubes
Thermal conductivity=390w/mk, Specific heat=390J/Kg.k, Density=8900Kg/m3
Loads>define loads>apply>thermal>temperature>select temperature area>ok>enter temperature value>313k>ok Convection>on areas>select convection area>enter film coefficient value=0.0024w/m2
Bulk temperature value=303k Solution>solve>current Ls>ok
General post processor>plot results>counter plot>nodal solution>dof solution>nodal temperature>ok
Figure 4.3: Heat flux
According to the contour plot, at fins the maximum rate of heat transfer (heat flux) area is 0.986754and at outer surface the minimum is 0.111e-13
Thermal analysis of condenser for 404R refrigerant Al 1100 for fins
Thermal conductivity=230w/mk, Specific heat=900J/Kg.k, Density=2705Kg/m3
Copper for tubes
Thermal conductivity=390w/mk, Specific heat=390J/Kg.k, Density=8900Kg/m3
Loads>define loads>apply>thermal>temperature>select temperature area>ok>enter temperature value>313k>ok Convection>on areas>select convection area>enter film coefficient value=900w/m2
Bulk temperature value=303k Solution>solve>current Ls>ok
Figure 4.4: Heat flux
According to the contour plot, at fins the maximum rate of heat transfer (heat flux) area is 1.4805and at outer surface the minimum is 0.830e-14
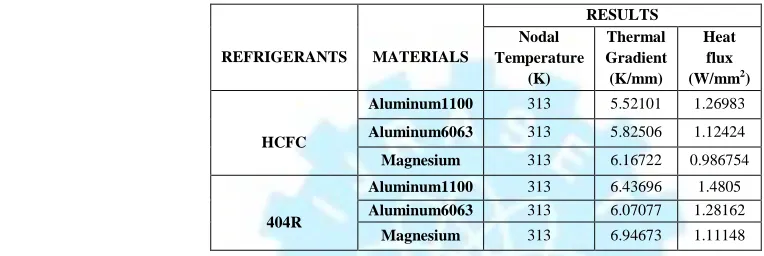
C. Results Table For Thermal Analysis
REFRIGERANTS MATERIALS RESULTS Nodal Temperature (K) Thermal Gradient (K/mm) Heat flux (W/mm2)
HCFC
Aluminum1100 313 5.52101 1.26983 Aluminum6063 313 5.82506 1.12424 Magnesium 313 6.16722 0.986754
404R
Aluminum1100 313 6.43696 1.4805 Aluminum6063 313 6.07077 1.28162
Magnesium 313 6.94673 1.11148
In the above table, the nodal temperature, thermal gradient and thermal flux values are presented from thermal analysis results. From the results, thermal flux is more when Aluminum alloy 1100 is used for fin and refrigerant used is 404R. That is the heat transfer rate is more. Thermal gradient is also more that is the change in temperature over a distance is more.
D. Theoretical Thermal Flux Results
Al ALLOY 1100 Al ALLOY 6063 MAGNESIUM
HCFC 2.64 2.44 2.21
R404 2.69 2.488 2.24
In the above table, thermal flux values are presented from theoretical calculations. From the results, thermal flux is more when Aluminum alloy 1100 is used for fin and refrigerant used is 404. That is the heat transfer rate is more.
CFD ANALYSIS OF FIN
REFRIGERANT - HCFC VELOCITY - 2.5 m/s
Ansys → workbench→ select analysis system → fluid flow fluent → double click
→Select geometry → right click → import geometry → select browse →open part → ok
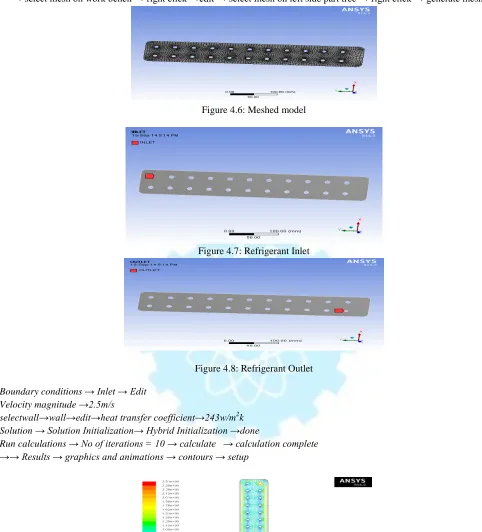
[image:5.612.63.445.281.409.2]→ select mesh on work bench → right click →edit → select mesh on leftside part tree → right click → generate mesh →
Figure 4.6: Meshed model
Figure 4.7: Refrigerant Inlet
Figure 4.8: Refrigerant Outlet
Boundary conditions → Inlet → Edit Velocity magnitude →2.5m/s
selectwall→wall→edit→heat transfer coefficient→243w/m2k
Solution → Solution Initialization→ Hybrid Initialization →done
Run calculations → No of iterations = 10 → calculate → calculation complete →→ Results → graphics and animations → contours → setup
Figure 4.9: Velocity magnitude
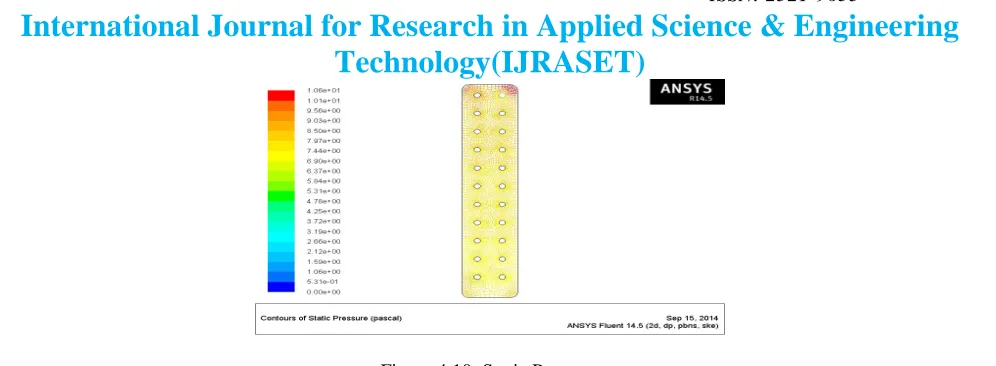
Figure 4.10: Static Pressure
According to the contour plot, the maximum static pressure at outlet hole beside corners is 1.06e+01pa and the minimum at inlet hole 5.31e-01pa
Figure4.11: Temperature
According to the contour plot, the maximum temperature at fin body is 3.00e+02 k
Mass flow report
"Flux Report"
Mass Flow Rate (kg/s)
--- ---inlet 0.09587553 interior-_trm_srf -1.0707636 outlet -0.095938734 wall-_trm_srf 0
--- ---Net -6.3204351e-05 kg/sec.
The net mass flow rate of fin body is 6.3204351e-05 kg/sec
"Flux Report"
Total Heat Transfer Rate (w) --- ---inlet 178.51022 outlet -178.6279 wall-_trm_srf 3.5367242e-13
--- ---Net -0.1176799 w
The net Total heat transfer rate of fin body is -0.117679 w.
VELOCITY 5m/s
Boundary conditions→ Inlet → Edit Velocity magnitude →5 m/s
Run calculations → No of iterations = 10 → calculate → calculation complete →→ Results → graphics and animations → contours → setup
Figure 4.12: Velocity Magnitude
[image:8.612.44.568.283.625.2]According to the contour plot, the maximum velocity at inlet and outlet holes is 6.20e+00 m/s and the minimum at in between inlet and outlet holes is 3.10e-01m/s
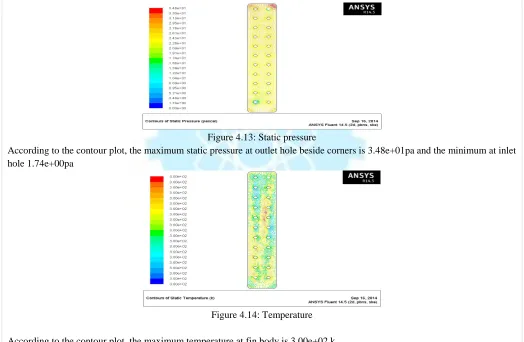
Figure 4.13: Static pressure
According to the contour plot, the maximum static pressure at outlet hole beside corners is 3.48e+01pa and the minimum at inlet hole 1.74e+00pa
Figure 4.14: Temperature
According to the contour plot, the maximum temperature at fin body is 3.00e+02 k
Mass flow rate
"Flux Report"
Mass Flow Rate (kg/s) ---
---inlet 0.191751 interior-_trm_srf -1.537853
outlet -0.1914832
---
---Net 0.00026780367 kg/sec
The net mass flow rate of fin body is 0.000267803kg/sec "Flux Report"
Total Heat Transfer Rate (w) --- ---inlet 357.02032 outlet -356.51999 wall-_trm_srf -0.0013494033
--- ---Net 0.49898629 w
The net Total heat transfer rate of fin body is 0.49898629w
VELOCITY 7.5m/s
Boundary conditions → Inlet → Edit Velocity magnitude → 7.5m/s
Solution → Solution Initialization→ Hybrid Initialization →done
[image:9.612.48.558.203.712.2]Run calculations → No of iterations = 10 → calculate → calculation complete →→ Results → graphics and animations → contours → setup
Figure 4.15: Velocity Magnitude
According to the contour plot, the maximum velocity at inlet and outlet holes is 9.02e+00 m/s and the minimum at in between inlet and outlet holes is 4.51e-01 m/s
Figure 4.16: Static pressure
According to the contour plot, the maximum static pressure at outlet hole beside corners is 7.21e+01pa and the minimum at inlet hole 3.60e+00pa
Mass flow report
"Flux Report"
Mass Flow Rate (kg/s) --- ---inlet 0.28762659 interior-_trm_srf -3.1008352
outlet -0.28777994 wall-_trm_srf 0
--- ---Net -0.00015335041kg/sec
The net mass flow rate of a fin body -0.0001533504 kg/sec
"Flux Report"
Total Heat Transfer Rate (w)
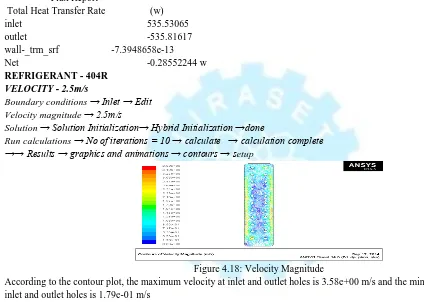
inlet 535.53065
outlet -535.81617 wall-_trm_srf -7.3948658e-13 Net -0.28552244 w REFRIGERANT - 404R
VELOCITY - 2.5m/s
Boundary conditions → Inlet → Edit Velocity magnitude → 2.5m/s
Solution → Solution Initialization→ Hybrid Initialization →done
[image:10.612.50.556.56.662.2]Run calculations → No of iterations = 10 → calculate → calculation complete →→ Results → graphics and animations → contours → setup
Figure 4.18: Velocity Magnitude
According to the contour plot, the maximum velocity at inlet and outlet holes is 3.58e+00 m/s and the minimum at in between inlet and outlet holes is 1.79e-01 m/s
Figure 4.19: Static pressure
[image:10.612.47.471.248.550.2]Figure 4.20: Temperature According to the contour plot, the maximum temperature at fin body is 3.00e+02
Mass flow rate
"Flux Report"
Mass Flow Rate (kg/s)
---inlet 0.19175106
interior-_trm_srf -2.0165849
outlet -0.19167539
wall-_trm_srf 0
--- ---Net 7.5668995e-05kg/sec
The net mass flow rate of fin body is 7.5668995e-05 kg/sec
"Flux Report"
Total Heat Transfer Rate (w) --- ---inlet 178.51022 outlet -188.34201 wall-_trm_srf -3.1452141e-13 ---
---Net -0.98317916 w
The net Total heat transfer rate of fin body is-9.831796 w
VELOCITY- 5(m/s)
Boundary conditions → Inlet → Edit Velocity magnitude →5m/s
Solution → Solution Initialization→ Hybrid Initialization →done
Run calculations → No of iterations = 10 → calculate → calculation complete →→ Results → graphics and
animations
→ contours
→ setupFigure 4.21: Velocity Magnitude
Figure4.22: Static pressure
[image:12.612.51.440.242.544.2]According to the contour plot, the maximum static pressure at outlet hole beside corners is 2.96e+01pa and the minimum at inlet hole 1.48e+00pa
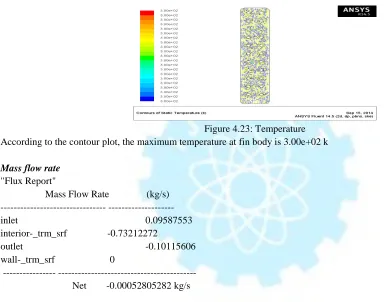
Figure 4.23: Temperature According to the contour plot, the maximum temperature at fin body is 3.00e+02 k
Mass flow rate
"Flux Report"
Mass Flow Rate (kg/s) --- ---inlet 0.09587553 interior-_trm_srf -0.73212272
outlet -0.10115606 wall-_trm_srf 0
--- ---Net -0.00052805282 kg/s
The net mass flow rate of fin body is -0.0052805282 kg/sec
"Flux Report
Total Heat Transfer Rate (w) --- ---inlet 357.02043 outlet -356.87954 wall-_trm_srf 1.5402225e-14
--- ---Net 0.14088776w
The net Total heat transfer rate of fin body is 0.14088776w
VELOCITY - 7.5m/s
Boundary conditions → Inlet → Edit Velocity magnitude →7.5m/s
Run calculations → No of iterations = 10 → calculate → calculation complete →→ Results → graphics and animations → contours → setup
Figure 4.24: Velocity Magnitude
According to the contour plot, the maximum velocity at inlet and outlet holes is 7.51e+00 m/s and the minimum at in between inlet and outlet holes is 3.76e-01pa
Figure 4.25: Static pressure
[image:13.612.50.244.591.701.2]According to the contour plot, the maximum static pressure at outlet hole beside corners is 1.07e+02pa and the minimum at inlet hole 5.33e+00pa
Figure 4.26: Temperature
According to the contour plot, the maximum temperature at fin body is 3.00e+02 k Mass flow report
"Flux Report"
Mass Flow Rate (kg/s) --- ---inlet 0.28762659 interior-_trm_srf -3.0067173
outlet -0.28706232 wall-_trm_srf 0
--- ---Net 0.00056426693 kg/s
The net mass flow rate of fin body is 0.00056426693 kg/sec
Total Heat Transfer Rate (w) --- ---inlet 535.53065 outlet -534.48004 wall-_trm_srf 1.0814626e-12
--- ---Net 1.0506061 w
The net Total heat transfer rate of fin body is 1.0506061 w.
RESULTS TABLE FOR CFD ANALYSIS
Velocity Magnitude (m/s) Static pressure (Pascal) Temperature (K) Mass Flow Rate (Kg/s) Heat Transfer Rate (W) Hcfc
2.5m/s 2.51e+00 1.06e+01 3.00e+02 6.3204351e-05 0.1176799 5 m/s 6.20e+00 3.48e+01 3.00e+02 0.00026780367 0.49898629 7.5
m/s
9.02e+00 7.21e+01 3.00e+02 0.00015335049 0.28552244
Results Table for CFD Analysis with HCFC Refrigerant
Velocity Magnitude (m/s) Static pressure (Pascal) Temperature (K)
Mass Flow Rate (Kg/s) Heat Transfer Rate (W) 404R 2.5 m/s
3.58e+00 5.23e+01 3.00e+02 7.5668995e-05 0.98317916
5 m/s
5.40e+00 2.96e+01 3.00e+02 0.00052805282 0.14088776
7.5 m/s
7.51e+00 1.70e+02 3.00e+02 0.000562426693 1.0506061
Results Table for CFD Analysis with 404R Refrigerant
V. CONCLUSIONS
In this work, an ac condenser is designed and optimized for better material, refrigerant and to improve the heat transfer rate.
By observing the thermal analysis results, using fin material Aluminum alloy 1100, thermal flux is more than other two materials. So by using Aluminum alloy 1100, the heat transfer rate increases. And also by taking refrigerant R404 is better.
Thermal flux is also calculated theoretically, by observing the results, using fin material Aluminum alloy 1100 and refrigerant R404 has more heat transfer rate.
CFD analysis is also done on the fin for two refrigerants HCFC and 404R at different fluid velocities 2.5m/s, 5m/s and 7.5m/s. By observing the analysis results, the velocity magnitude, mass flow rate and heat transfer rate is more when 404R is used, so using 404R increases the efficiency of the condenser but the pressure is less.
Increasing inlet velocity from 2.5m/s to 5m/s, yields no advantage but by increasing to 7.5m/s yields better results.REFERENCES
[1]. S.H. Noie-Baghban,G.R. Majideian, “Waste heat recovery using heat pipe heat Exchanger (HPHE) for surgery rooms in hospitals”, Applied Thermal Engineering, Vol. 20, (2000) 1271-1282.
[2]. E.F. Gorzelnik, Heat water with your air-conditioner, Electrical World 188 (11) (1977) 54–55.
[3]. P. Sathiamurthi, PSS.Srinivasan, design and development of waste heat recovery system for air conditioner, European Journal of Scientific Research ISSN 1450-216X Vol.54 No.1 (2011), Pp.102- 110.
[4]. P.Suresh Mohan Kumar, Eco friendly Energy Conservative Single window Air Conditioning System by Liquid Cooling with helical inter cooler ISSN 1450-216X Vol.76 No.3 (2012), pp.455-462
[5] S.C.Kaushik, M.Singh. “Feasibility and Refrigeration system with a Canopus heat exchanger”, Heat Recovery Systems & CHP, Vol.15 (1995)665 -673.