IDENTIFICATION OF RAIN CLOUD AMOUNT, RAIN INTENSITY AND
POSSIBLE CHANCE OF FLOODING USING IMAGE PROCESSING
AND FUZZY LOGIC
Miguel Joseph L. Jacoba and Edwin R. Arboleda
Department of Computer and Electronics Engineering, Cavite State University, Indang Campus Cavite, Philippines E-Mail: [email protected]
ABSTRACT
Tropical cyclones are the most powerful storm of all. These storms bring strong winds and large amount of rain which cause devastation in its affected areas. The rainfall amount of these weather disturbances can cause flooding, landslides, overflowing of rivers and dams and mudslide. Forecasting these weather disturbances is an important tool to save lives and properties in affected areas. To completely analyze the storm’s rainfall amount and intensity, an image processing technique is usually used by most meteorologists. The image processing technique can identify the intensity, size, and rainfall amount of the storm. The fuzzy logic on the other hand gives result based on rules made by the user. The fuzzy logic is also an important tool in identifying the chance of flooding in a specific area. In this paper the image processing and fuzzy logic are demonstrated in the software named MATLAB. In image processing, the amount of white colors which identifies the amount of rainclouds is counted using white color detection technique and the intensity of rain is counted using complemented gray scale in MATLAB. The results are then plugged into the fuzzy logic which outputs the possible chance of flooding.
Keywords: tropical cyclones; floods; image processing; fuzzy logic; white color detection; complemented gray scale.
1. INTRODUCTION
Tropical Cyclones are known to be one of the most devastating forces of nature. They bring strong winds and heavy rains. In some cases, tropical cyclone winds caused storm surges in coastal areas. And the high amount of rain they bring cause flash floods, landslides and mudslides. Due to the power they possessed, tropical cyclones can cause widespread destruction to lives and properties especially in its path. Tropical cyclones are unstoppable and cannot be controlled, the only thing the residence of affected areas can do is to prepare. For this reason, forecasting tropical cyclone became an important thing since radars and satellites were invented. Forecasting of cyclones involves the prediction of several interrelated features, such as the cyclone’s track, intensity, induced storm surges and accompanying rainfall, and the coastal areas threatened (Holland, 2009). Among these interrelated features, the rainfall amount indicates the possible floods, landslides, overflowing of dams, overflowing of rivers and mudslides when the storm made landfall. Also, heavy rainfall damages crops like rice, fruits, and vegetables. For this reason, the amount of rain of the storm is one of the most important things to consider, especially when the storm is making landfall in the places which are called catch basins or low lying areas. In the Philippines, the National Capital Region is the country’s most flood prone area.
In the western Pacific Ocean, the Philippine Atmospheric Geophysical Astronomical Service Administration indicates the rainfall amount of the storm based on its appearance in satellite imagery and the possible chance of flooding. The thickness of cloud of the storm indicates the amount of rainfall. Based on observations thick clouds contain more water compare to thin clouds. Flashfloods can drown crops, houses,
infrastructures and even humans. Landslides and mudslides are prone for people living near the mountains. From 1900’s to the present, thousands of people are died due to extreme flooding around the world. In the Philippines, flooding usually happens and claims many lives every year. Most of these flooding are caused by storms affecting the country. Examples of this storms are Tropical Storm Ketsana (Ondoy) of 2009 which claims 400 lives in National Capital Region, Tropical Depression Winnie of 2004 which claims 1000 lives in Bicol region and Tropical Storm Washi (Sendong) of 2012 which claims 1000 lives in Mindanao province.
In forecasting tropical cyclone rainfall amount using satellites, the technique known as image processing is an important tool. By using image processing, meteorologist can get more details about the storm’s size, intensity, central pressure and amount of rain. However, the size of storm does not play significant role in identifying the strength of the storm but it can identify the places affected by heavy rainfall. More importantly, the Image processing can also identify if the storm is intensifying or weakening and identify the places affected by heavy rainfall. In this paper, the author will demonstrate the image processing technique using the software named MATLAB. In addition to this study, the Fuzzy Logic is used to identify the possible chance of flooding.
2. METHODOLOGY
tropical cyclones in the western Pacific Ocean from 1950’s to the present.
The 64 samples of storms from the previous years (2006-2016) are used in this study. The images of storms are taken at the time of their peak intensity by using the satellite of Japan named “HIMAWARI”. The samples are combined in four pictures to make the analysis easy and accurate.
2.1 Image Processing
Figures 1 and 2 shows the samples of previous storms in the western Pacific. The white color detection technique in MATLAB is used to identify the amount of rainclouds of the storm and the complemented gray scale technique is used to determine the areas of intense rains. The storms with high level of white color percentage and dark color percentage are the storms that can cause severe flooding. And the storms with low amount of white and dark color are the storms with low chance of flooding. Figures 4 and 5 show the black and white images of Figures 1 and 2.
Figure-1. Storms in western Pacific Ocean.
Figure-2. Storms in western Pacific Ocean.
2.1.1 Black and White Images
a. Open MATLAB Script and type the code shown in Figure-3
Figure-3. Matlab Code for Converting Images into Black and White Images.
b. Run the Script. The results are shown in Figure-4 and Figure-5.
Figure-4. Black and White Images of Figure-1.
Figure-5. Black and White Images of Figure-2.
2.1.2 White Color Detection
a) Open MATLAB Script and type the code shown in Figure-6.
2. Run the Script
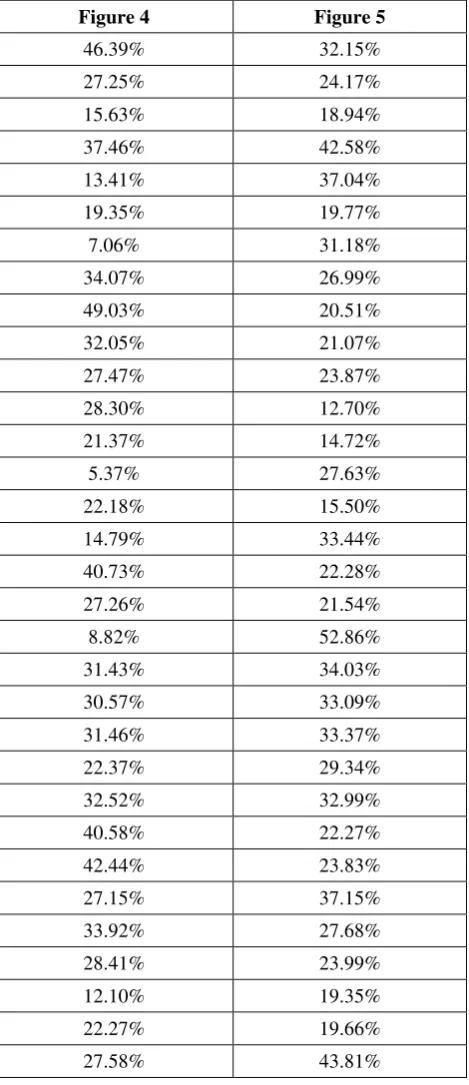
Using white color detection, the percentage of white colors in each sample in each figure is recorded. The results are shown in Table-1.
[image:3.595.53.288.169.712.2]
Table-1. Percentage of white colors in each sample.
Figure 4 Figure 5
46.39% 32.15%
27.25% 24.17%
15.63% 18.94%
37.46% 42.58%
13.41% 37.04%
19.35% 19.77%
7.06% 31.18%
34.07% 26.99%
49.03% 20.51%
32.05% 21.07%
27.47% 23.87%
28.30% 12.70%
21.37% 14.72%
5.37% 27.63%
22.18% 15.50%
14.79% 33.44%
40.73% 22.28%
27.26% 21.54%
8.82% 52.86%
31.43% 34.03%
30.57% 33.09%
31.46% 33.37%
22.37% 29.34%
32.52% 32.99%
40.58% 22.27%
42.44% 23.83%
27.15% 37.15%
33.92% 27.68%
28.41% 23.99%
12.10% 19.35%
22.27% 19.66%
27.58% 43.81%
From the results above, storms with high percentage of white color possess high amount of rainclouds which indicates that the number of rainfall affected place is large but the intensity of the rain at
particular areas is still unknown. For this reason, complemented gray scale is an effective tool.
2.1.3 Complemented Gray Scale
Figure-7 shows a snapshot of Matlab code to produce the Complemented image in GrayScale.
Figure-7. Matlab code for extracting the complemented gray of an image.
[image:3.595.310.547.349.474.2]The results are shown in Figures 8 and 9. Here the complemented images of storms, the darkest part of the storm indicates heavy to intense rain. And the less dark part indicates light to moderate rain.
[image:3.595.309.547.495.621.2]Figure-8. Complemented image of Figure-1.
Figure-9. Complemented image of Figure-2.
2.2 Fuzzy Logic
To identify the chance of flooding based on amount of raincloud and intensity of the rain, fuzzy logic is used. This technique is very useful when the outputs are based on conditions. There are two inputs in the fuzzy logic namely amount of rainclouds and rainfall intensity. And one output namely chance of flooding.
Amount of rainclouds based on white color detection technique:
15% to 30%: Medium
More than 30%: High
Intensity of rain based on level of darkness on complemented gray scale images:
Low: Light
Medium: Moderate
High: Intense
Chance of flooding: Low
Medium
High
Using fuzzy logic, the chance of flooding can now be determined. Figure 10 labels the output as the chance of flooding as shown here.
Figure-10. Setting up the Input and Output.
i. Set the amount of rainclouds as low, medium and high. Shown in Figure-11.
Figure-11. Setting up the amount of rainclouds.
ii. Set the intensity of rainfall into light, moderate, and intense as shown in Figure-12.
Figure-12. Setting up the intensity of rainfall.
Figure-13. Setting up the output parameters.
iv. Make rules as shown in Table-2.
Table-2. Fuzzy Rules.
Amount of
Rainclouds Intensity of Rain
Chance of Flooding
Low Light Low
Low Moderate Low
Low Intense Medium
Medium Light Low
Medium Moderate Medium
Medium Intense Medium
High Light Medium
High Moderate High
High Intense High
v. Plug the rules in the rule editor as shown in Figure-14.
Figure-14. Plugging the rules in the editor.
Figure-15. Sample of the Rule Viewer.
vi. View the surface viewer
3. RESULTS AND DISCUSSIONS
The image processing technique identifies the amount of white and black colors which correspond to amount of rainclouds and rainfall intensity that corresponds to possible flood occurrence. Based on data recorded, storms with high percentage of white color possesses high amount of rain clouds and storms with low percentage of white color possesses low amount of rainclouds. The intensity of rainfall is based on the complemented gray scale images, the darker the color, the more intense the rain is. It is noticeable that the darkest color is located near the eye or center of the storm and lesser dark color is located far from the storm’s center. The data gathered are used to identify the possible flood occurrence, to identify the chances of floods, a fuzzy logic is used. The fuzzy logic identifies the possible damage based on amount of rainclouds and rainfall intensity.
4. CONCLUSIONS
Based on the results gathered, it can be observed that by using the white color detection and complemented gray scale in image processing technique helps to determine amount of rainclouds and intensity of the rain. And by using fuzzy logic, the chance of flooding is known based on conditions given.
REFERENCES
[1] Digital Typhoon website
[2] Chandan Roy and Rita Kovordanyi, Tropical cyclone track forecasting techniques: A review, 2012, Atmospheric research, (104-105), 40-69. http://dx.doi.org/10.1016/j.atmosres.2011.09.012.
[3] Numerical model framework for typhoon prediction at the Japan Meteorological Agency, The 63th Interdepartmental Hurricane Conference, 4 Mar. 2009 Munehiko Yamaguchi, Takuya Komori, Takemasa Miyoshi, Masashi Nagata1 and Tetsuo Nakazawa4([email protected]).
[4] Current JMA ensemble-based tools for tropical cyclone forecasters Hitoshi Yonehara([email protected]) Yoichiro Ota JMA / Numerical Prediction Division.
[5] Joint Typhoon Warning Center Overview. p. 11.
[6] Real-Time HWRF Forecasts for the Joint Typhoon Warning Center. p. 4.
[7] 2013. Verification methods for tropical cyclone forecasts WWRP/WGNE Joint Working Group on Forecast Verification Research, November. pp. 15-16.
[8] Performance of tropical cyclone forecast in western North Pacific in 2015.
[9] Xiaotu LEI, Guomin CHEN, Xiping ZHANG, Peiyan CHEN, Hui YU (Shanghai Typhoon Institute/China Meteorological Administration, Shanghai, China), 48th Session ESCAP/WMO Typhoon Committee 22- 25 February 2016 Honolulu Hawaii, USA. p. 2.