2016, Volume 3, e3218 ISSN Online: 2333-9721 ISSN Print: 2333-9705
DOI: 10.4236/oalib.1103218 December 9, 2016
Conditional Correlations and Volatility Spillovers
between Crude Oil and Stock Index Returns of
Middle East Countries
Nagmi M. Moftah Aimer
Social Sciences Institute, Department of Business Administration, Kastamonu University,Kastamonu, Turkey
Abstract
This paper reveals the conditional correlations and fluctuation spillovers between oil price shocks and stock markets indices in Middle East countries, over the period from March 2000 to March 2015, by using the BEKK-GARCH, DCC-GARCH mod-els. The results show strong evidence of fluctuation spillovers between the price of WTI to all exporting and oil importing stock indexes. The results further show that the estimates of the conditional correlations are always significant. Time-varying correlations of crude oil and stock index do not differ from oil-exporter or oil- importer countries. Crude oil price shocks have a significant impact on the relation-ship between crude oil and stock indices in the world crisis periods. The extent of the influence stock market collapse in 2008 crisis on the correlation coefficients is much more important than those of the previous financial crises.
Subject Areas
Business Finance and Investment
Keywords
Oil Prices, Stock Markets, Persistence, GARCH-BEKK, DCC-Garch
1. Introduction
Oil represents one of the most important macroeconomic factors for global economy and the financial market due to its outstanding importance in the supply of the energy demands, thus it is the largest commodity market in the world and became one of the basic indicators of economic activity worldwide drawing the attention of both politicians and economists. In recent years, it appears that economic growth and development play a How to cite this paper: Aimer, N.M.M.
(2016) Conditional Correlations and Vola- tility Spillovers between Crude Oil and Stock Index Returns of Middle East Coun- tries. Open Access Library Journal, 3: e3218.
http://dx.doi.org/10.4236/oalib.1103218
Received: November 9, 2016 Accepted: December 6, 2016 Published: December 9, 2016
Copyright © 2016 by author and Open Access Library Inc.
This work is licensed under the Creative Commons Attribution International License (CC BY 4.0).
http://creativecommons.org/licenses/by/4.0/
key role in industrial innovation [1].
However, the importance of oil exceeds its economic aspects and effects of social life in general. In this method, the fluctuations in oil prices will certainly have an effect on the costs, and change in expected costs further impacts the stock prices.
In recent years, the literature has identified a number of potential factors of oil price shocks. For instance: shocks to the supply arising from political events such as wars and revolutions in OPEC member countries, improvements in the technology of extracting crude oil, and the discovery of new fields. At the same time, product innovation can improve its position in the sector against alternative products that provide a response to the new requirements (Assis. Prof. Dr. Benli Tahir et al., 2013) [2] also are important steps in this regard. For example, in Taiwan “Renewable Energy Development Plan” of the installed capacity of solar power generation capacity planned between the years 2002-2020 in accordance with the aimed to reach 10% (see Assis. Prof. Dr. Benli Tahir and Oktik) [3]. In addition, shocks to the demand for crude oil associated with unex-pected movements in the global business cycle. As well, shocks to the demand for above-ground oil inventories, reflecting shifts in expectations about future shortfalls of supply relative to demand in the oil market.
The period includes much volatility and two sharp crashes. One crash, the last months of 2008 witnessed what is being called the worst financial crisis since the Great Depression.
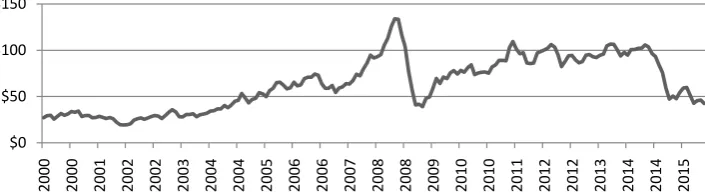
[image:2.595.197.550.578.675.2]Due to the expansion of financial derivative instruments, which have often been held accountable for giving rise to the financial crisis in 2008 (Assoc. Prof. Dr. Ulusoy Tolga, 2011, Page 9087) [4]. The WTI price has increased from $60 to cross the threshold of $100 reaching the record of $147 in July 2008, possibly a consequence of geopolitical tensions, Iranian missile tests, see Figure 1.
Figure 1 shows the drop in oil prices in August to reach only $115, and then fell again to $45 at the end of December 2008 in the midst of the financial crisis. The cycle was being launched again around March and April 2009 when oil traded at about $40 per barrel to reach by August 2009 the level of more than $70 per barrel [5].
The second crash, in 2014, oil prices fell sharply to reach over $100 per barrel since June 2014 to around $30 per barrel recently. The drop in oil prices will pose significant challenges for monetary, fiscal, and structural policies.
From a theoretical point of view, oil prices volatility can affect financial markets
Figure 1. Crude oil prices: West Texas intermediate (WTI). Source: [5]. Updated: Monthly|Last Updated: 07/31/2016. http://www.eia.gov/finance/markets/crudeoil/financial_markets.cfm
$0 $50 $100 $150
3/23 OALib Journal
through various channels. The rise and fall in oil prices from one of the serious factors that really may affect the aggregate stock prices through influencing negatively the real output, which, in turn, lowers corporate earnings, inflation, monetary policy has impli-cations for asset prices and hence also financial markets [6]. The relationship between oil prices and the stock can be explained by looking at the method of valuation based on discounted cash flow approach. However, the shocks create uncertainty and under-mine effective fiscal management of crude oil revenue (Prof. Dr. Erdoğan Murat, 2011: p. 6) Erdoğan [7]. Rise in oil prices leads to a depreciation in exchange rate in the long run, this implies that prices of oil are an important variable in determining the strength of the currency and its volatility (Nagmi, 2016) [8]. This impact, in general, is positive or negative depends on the nature of the relationship between oil-exporting economy and oil-importing economy [8], higher oil prices play a major role in transferring wealth from oil importing countries to oil exporting countries [9]-[11].
Increasing oil prices close to the general level of prices, the real interest rate increases may force an increase in the rate of return on investment for companies that in turn lead to a drop in stock price. Studying the conditional correlations and volatility spil-lovers between crude oil and stock index returns is important for investors to make ne-cessary investment decisions and for policy makers to regulate stock markets more ef-fectively. Marketable securities, which can be considered as an indicator of accounting standards increase refers to temporary investments that are bought or sold for compa-nies, the evaluation of the fair value method of marketable securities is another impor-tant issue (Prof. Dr. Erdoğan Murat et al., 2016: p. 181) [12]. All these reasons highlight for the sake of a study focus in Middle East countries. The stock markets of the Middle East countries are relatively new compared to the advanced markets. The study of the volatility spillover between the oil market and stock markets is crucial for energy policy planning, portfolio diversification and energy risk management [13]. The stock market is a complex network. The price fluctuations among different stocks have complicated relationships (Assoc. Prof. Dr. Ulusoy Tolga et al., 2012: p. 5121) [14].
Most of the literature on the impact of oil price shocks on the stock market returns in the developed countries which are mostly oil importing countries have found that there is a negative relationship exists between oil price shocks and the stock market returns
[15]-[21]. On the other hand, by [22][23]; Lescaroux and Mignon [24]; Park and Ratti
[15]; Hammoudeh and Choi [25] and Guesmi and Fattoum [26] a positive relationship between oil price shocks and the stock market returns exists in the oil-exporting coun-tries. Other economists thought that there is no relationship between oil price shocks and the stock market returns [27][28], and that there is a negative and positive rela-tionship between oil price shocks and the stock market returns [29].
evidence of interdependence effects among GCC stock markets. However, other econ-omists, for instance Hammoudeh, Dibooglu [31] they found evidence volatility spillov-ers from the oil futures market on the stocks of some oil sectors. Chiou and Lee [32]
they found that high fluctuations in oil prices have asymmetric unexpected effects on stock returns. In particular, oil price shocks seem to have a significant influence on the relationship between oil and stock indices of Middle East countries. This result reduces the gains of portfolios international diversification and explains why investors are turning to other various commodities (e.g. Gold, copper and other precious metals) during the oil and financial crisis period of 2008-2009. In this context, it is expedient for the country’s policymakers to provide the enabling policies that could lead to the diversification (Assis. Prof. Dr. Benli Tahir, 2013: p. 2) [33] of the nation’s economy from oil export (lessen its reliance on petroleum trade) to non-oil export products. Hierarchical structure may be useful in the detection of the theoretical description of financial markets and in the search of economic factors affecting special groups of stocks (Assoc. Prof. Dr. Ulusoy Tolga et al., 2012: p. 5121) [14].
The main aim of this paper is to investigate the conditional correlations and volatility spillovers between oil price shocks and stock markets indices of Middle East countries. The countries that are included in the analysis are oil-importing countries (Turkey, Egypt, Lebanon, and Jordan) and oil-exporting countries (Saudi Arabia, the United Arab Emirates, Qatar, Bahrain, Kuwait and Oman). By using two multivariate GARCH specifications specifically the BEKK-GARCH model and the DCC-GARCH model, us-ing monthly data from 3/2000 to 3/2015.
This paper is structured as follows. The second section provides an overview of the research conducted. The third section presents the methodology employed. The fourth section the variables and the data used in the analysis. The fifth section discusses the results and its implications. Concluding remarks are summarized in the sixth section.
2. Literature Review
Although, a number of empirical studies on conditional correlations and volatility Spillovers between crude oil prices and stock index returns exist, most of such studies have largely focused on developed countries. There are few studies that examine the conditional correlations and volatility spillovers between crude oil prices and stock in-dex returns of Middle East countries.
5/23 OALib Journal
oil market.
Chang, McAleer [27], this paper investigates the conditional correlations and volatil-ity spillovers between the crude oil and stock index returns. During the delay period from 2/1/1998 to 4/11/2009 of the Brent markets and WTI and crude oil spot, and the FTSE100, NYSE, Dow Jones and S&P500 stock index returns, by analyst the CCC, VARMA-GARCH, VARMA-AGARCH, and DCC model. The study found that the conditional shocks are correlated only in the same market and not across markets. However, the DCC estimates of the conditional correlations are always great. This means that constant conditional correlations are not supported empirically. Surpri-singly, based on the VARMA-GARCH and VARMA-AGARCH model the empirical results provide little evidence of volatility spillovers between the crude oil and financial markets. The evidence of asymmetric effects of negative and positive shocks of equal magnitude on the conditional the variances suggest that VARMA-AGARCH model is superior to VARMA-GARCH and CCC model.
Asteriou and Bashmakova [34], this paper investigates the relationship between oil price risk and stock market returns for the emerging capital markets of the Central and Eastern European Countries (CEECs), during the period 1999-2007, by using Model CAPM. The study showed that oil price beta is negative and significant in determining stock returns. Conditional models show the positive reaction of the returns to upward markets.
Guesmi and Fattoum [26], this study examines the links between Brent crude oil in-dex and stock market inin-dex in OECD countries, covering 10 OECD countries for the period of January 1990-September 2012. By employing Engle [35] dynamic conditional correlation (DCC), the study found that oil price shocks in periods of world turmoil and political events have an important impact on the relationship between oil and stock market prices.
Zhu, Li [36], this paper investigates the dynamic dependence between crude oil pric-es and stock markets in ten countripric-es across the Asia-Pacific region during the period from January 4, 2000, to March 30, 2012, by using the model GARCH. The results show that the dependence between crude oil prices and Asia-Pacific stock market returns are generally weak, that it was positive before the global financial crisis, except in Hong Kong, and that it increased significantly in the aftermath of the crisis. The lower tail dependence between oil prices and Asia-Pacific stock markets exceeds that of the upper tail dependence, except in Japan and Singapore in the post-crisis period.
Aydogan and Berk [38], this paper analyzes the effects of crude oil price variations on the Turkish stock market returns. Using vector autoregression model using daily ob-servations of crude oil prices and Istanbul stock exchange national index returns for the period from 1/2 1990 to 1/11 2011. They found that the variance decomposition test results suggest little empirical evidence that crude oil price shocks have been rationally evaluated on a stock market.
Balli, Hajhoj [39], this study investigates the return spillovers and volatility spillovers from developed markets (e.g., Europe, Japan and the US) into the financial markets of selected emerging countries in Asia and the Middle East and North Africa (MENA) re-gion. Based on constant and trend spillover models, they find evidence of significant spillover effects from developed markets to emerging markets. The results from va-riance ratios indicate the dominance of US shocks across all emerging markets, though the effect varies widely among countries. In addition, they found that bilateral factors such as trade volume, portfolio investment, and distance are significant in explaining the spillover effects.
Baumeister and Hamilton [40] used vector autoregressions to assess the conse-quences of supply and demand shocks. They found that oil price increases that result from supply shocks lead to a reduction in economic activity after a significant lag, whe-reas price incwhe-reases that result from incwhe-reases in oil consumption demand do not have a significant effect on economic activity.
Bouri and Demirer [41], this paper examines the volatility transmissions between the oil price and stock markets for Emerging countries (exporting and oil-importing). The volatility spillover causality tests generally rule out country-to-oil effects, suggesting unidirectional volatility transmissions from oil prices to emerging stock markets, par-ticularly in the case of the net exporting nations of Kuwait, Saudi Arabia, and UAE. Also significant volatility spillovers from oil prices to emerging importers during the post-global financial crisis period.
Amin, Amin [42] this research analyzes the dynamic relationship between oil price shocks and the stock market in the main countries of oil exporting (Iran, Russia, Saudi Arabia and, United Arab Emirates and Norway) during the weekly period from 16/1/ 2006-15/6/2011. The results reveal that the stock markets in Russia, Iran and Saudi are sensitive to the oil price shocks. Furthermore, there is strong evidence of an asymmetric impact of oil price shocks on the Iranian and Saudi markets.
7/23 OALib Journal
Li, Cheng [43] this paper investigates the impacts of these oil price shocks on the stock returns of China’s listed companies in the oil industrial chain using data from 2009 to 2014. The empirical results show that there is a gradual increase in the aggre-gate contributions of oil price shocks to the changes in stock returns.
Diaz, Molero [44], this study examines the relationship between oil price volatility and stock returns in the G7 economies (Canada, France, Germany, Italy, Japan, the UK and the US) using monthly data for the period 1970 to 2014. Using a vector autoregres-sive model. They found that world oil price volatility is more significant for stock mar-kets than the national oil price volatility.
Kendirli [45], this paper examines the volatility transmissions between the oil price and stock Index for BIST 100 and Bursa Istanbul transportation (XULAS) for Turkey. Granger Causality test results of significance was found BIST than 100 one-way rela-tionship to other variables. In addition, unidirectional relarela-tionship of the crude oil price to Bursa Istanbul Transportation Index has been determined.
The conflicting results of the many literatures referred to in the research conducted above shows the significance of studying each financial market independently.
Most of this literature discusses conditional correlations and volatility spillovers be-tween crude oil and stock index using standard linear frameworks such as the (VAR) and (VEC) models. Few literatures managed to use nonlinear techniques. These linear models, therefore, do not permit to capture the nonlinearity of the relationships, espe-cially over certain periods of financial stresses and crises like the 2008, 2014 crisis. Overall, compared to the previous literature, our investigation builds on the recent multivariate GARCH model. Finally, we see that the response is not fixed and it de-pends on the origin of the oil price shock. These are important results for traders and stock analysts to deal with the oil markets.
3. Empirical Methodology
In this section, we first present the model we employ to investigate the conditional cor-relations and volatility spillovers between oil prices (WTI) and stock index of Middle East countries, and then provide a brief description of the volatility impulse response methodology employed to analyze in depth the volatility dynamics operating between the involved variables. The volatility persistence using the standard GARCH model:
• The symmetric volatility spillovers using the BEKK-GARCH model Baba et al.
(1990)1.
• The dynamic conditional correlations using the symmetric DCC-GARCH model of
Engle [35].
Step 1: To investigate the volatility persistence we estimate the GARCH (p, q) model suggested by Bollerslev (1986) for stock indices:
2
, ,
1 1
, 1, 2, ,
p q
it i ij i t j ij i t j
j i
h ω α ε − β h − i k
= =
=
∑
+∑
= (1)1In case you wonder, BEKK means “Baba-Engle-Kraft-Kroner” and the acronym simply compacts the name
where, hi t, is the conditional volatility with information available to date t-j,
{
}
(
1, 2,)
t j t t
I− = ε− ε− of the innovation εt.
The degree of volatility persistence can be measured by the sum of the coefficients in the variance equation, α + β.
Step 2: We examine the volatility spillover between oil return and market index re-turns. To this end, we use a multivariate BEKK-GARCH model. We start the empirical spillover specification with a bivariate VAR-GARCH (1,1) model that accommodates oil price returns and the index returns of each stock market lagged one period. This model is as follows:
1
t t t
r = +µ λr− +ε (2)
(
)
1~ 0, t Ft N Ht
ε − (3)
1, 1 11 12 1, 11, 12,
2, 2 21 22 2, 21, 22,
, , , ,
t t t t
t t t
t t t t
r c h h
r H
r c h h
ε
λ λ
µ λ ε
ε λ λ = = = = =
where, r1,t represents the monthly oil returns and r2, t are index returns. The element
12
λ is the degree of mean spillover effects from the oil market to each stock market. The vector of random errors εt represents the innovation for each market at time t with its corresponding conditional variance-covariance matrix Ht. The market infor-mation available at time t − 1 is represented by the inforinfor-mation set Ft−1. The vector
µ represents the constant.
The h11,t represents the variance of oil price, h22,t is the variance of stock markets
and h12,t represents the covariance between crude oil and stock markets.
Given the above expression, and following Engle and Kroner [46] the conditional covariance matrix can be written as:
0 0 1 1 1
1 1
q q
t t t i t i
i i
H C C Aε ε− −A G H G−
= =
′ ′ ′ ′
= +
∑
+∑
(4)where 11 12 11 12 11 12 1
0
2
21 22 21 22 21 22
, , , t t
t
h
C A G H
h
ω ω α α β β
ω ω α α β β
= = = =
In the variance model, C0, Ai and Gi are k×k parameter matrices with C0 is a lower triangular matrix. where ωij are elements of a symmetric matrix of constants
0
C , the elements αij of the symmetric matrix A measure the degree of market shocks
from market i to market j, and the elements βij of the symmetric matrix G indicate
the persistence in conditional volatility between market i and market j. For an instant, 12
β represents the volatility spillover from the oil market to stock market. The model
ensures that the conditional variance-covariance matrices, Ht is positive definite if at least one of C0 or G is of full rank. Engle and Kroner [46] proved that the BEKK model is second-order stationary if and only if all the eigenvalues of (A⊗ + ⊗A G G)
are less than unity in modulus.
9/23 OALib Journal
(
)
(
)
(
)
(
)
2 2 2 2
22, 12 22 12 12 1, 1 22 1, 1 2, 1 22 12 1, 1 2, 1 22 2, 1 12 12 11, 1 22 21, 1 22 12 12, 1 22 22, 1
t t t t t t t
t t t t
h
h h h h
ω ω α α ε α ε ε α α ε ε α ε
β β β β β β
− − − − − −
− − − −
= + + + + +
+ + + + (5)
(
)
(
)
(
)
(
)
2 2 2 2
22, 12 22 12 12 1, 1 22 1, 1 2, 1 22 12 1, 1 2, 1 22 2, 1 12 12 11, 1 22 21, 1 22 12 12, 1 22 22, 1
t t t t t t t
t t t t
h
h h h h
ω ω α α ε α ε ε α α ε ε α ε
β β β β β β
− − − − − −
− − − −
= + + + + +
+ + + + (6)
(
)
(
)
(
)
(
)
2 2
12, 11 12 12 11 1, 1 21 1, 1 2, 1 21 11 1, 1 2, 1 21 2, 1 12 12 11, 1 21 21, 1 22 11 12, 1 21 22, 1
t t t t t t t
t t t t
h
h h h h
ω ω α α ε α ε ε α α ε ε α ε
β β β β β β
− − − − − −
− − − −
= + + + +
+ + + + (7)
where h12,t =h21,t.
Step 3: We estimate the Dynamic Conditional Correlation between crude oil returns and each stock index return of the Middle-East countries using the DCC-GARCH model introduced by Engle [35].
The variance-covariance matrix, H, in The DCC-GARCH (1.1) model may be writ-ten as:
(
)
1 0, , 1, 2, ,
t t t
r F− ≈ Q t= n (8)
t t t
Q = ΓD D where: Dt= diag h
( )
t 1 2 is the diagonal matrix of conditionalvari-ance and the elements of Dt are generated using a univariate GARCH process from Equation (1).
The ηit, with zero mean and unit variance, after standardization is (ηit =yit hit ), are used to estimate the dynamic conditional correlations, as follows:
( )
1 2( )
1 2t diag Qt Q diag Qt t
− −
Γ = (9)
Qt is the conditional covariance matrix
Thus, the DCC structure can be expressed as follows:
(
1 1 2)
1(
1 1)
2t t t t m
Q = − −θ θ Q+θ η η− ′− +θQ− (10)
where θ1 and θ2 are non-negative scalar parameters to capture the impacts of pre-vious shocks and prepre-vious dynamic conditional correlations on the current dynamic conditional correlation. As Qt is a conditional covariance matrix (conditional on the vector of standardized residuals) and Qt is k×k unconditional variance matrix of
t
η .
4. Variable and Data Description
The data employed in this study include the monthly Brent oil prices and stock market indices, of Middle East countries (Turkey, Egypt, Lebanon, Jordan, Saudi Arabia, United Arab Emirates, Qatar, Bahrain, Kuwait and Oman), a world stock market index, and crude oil prices of the West Texas Intermediate (WTI) in dollars per barrel, which accounts for the 65% of the world oil daily production (IMF, 2010). Using analyzing monthly data from 3/2000 to 3/2015. Using Energy Information Administration [5]
Kuwait and Oman).Oil-importing countries (Turkey, Egypt, Lebanon and Jordan). Stock price indices in the US dollar price for all countries are Thomson Reuters. We use the principal general index of markets. Saudi Tadawul All Share (TASI) is the gen-eral index of Saudi, Bahrain All Share [13] index depict the financial index of Bahrain, Muscat Securities Market 30 is the index of Oman, Qatar exchange index (QE) is the Qatar financial index, Abu Dhabi securities market index (ADSMI) is the general nancial index of Emirates and Kuwait stock exchange index (KWSE) represents a fi-nancial index of Kuwait.
The BIST National 100 represents the stock index of Turkey, EGX 30 is the principal index of Egypt, BLOM Stock index represents the Lebanon financial index and Amman SE represents the financial index of Jordan.
Oil price is taken as an index in the U.S. dollar price of West Texas Intermediate (WTI) crude oil from the Energy Information Administration [5].
We compute the stock price index between two consecutive trading Months, t − 1 and t, using the first difference in the natural logarithms of the stock market indices according to the following equation:
(
1)
ln t t
rt= p p− (11)
where Pt is the stock market index at the month t. In addition to, oil returns are
calcu-lated as the continuously compounded return on crude oil price (WTI).
5. Results and Discussion
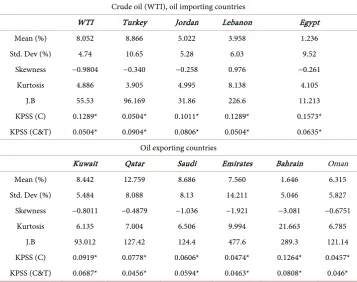
Table 1 reports summary statistics for oil returns and stock indexes returns of oil im-porting and oil exim-porting countries in the Middle East region. It is noted that the oil market presents the best risk-return (8.052%; 4.74%), the index returns of the Emirates have the higher risk (14.21%) and the low risk is observed for Jordan.
Crude oil and stock indexes of oil importing countries have mean positive returns where the stock index of Turkey (BIST) denotes the higher mean returns and risk dur-ing this period. The Turkish economy is highly integrated with the world economy and financial markets by trade and financial channels (Assoc. Prof. Dr. Ulusoy Tolga et al., 2012: p. 5121) [14]. One the other hand, Qatar index market have the highest mean re-turns and Bahrain index have the lowest mean rere-turns and risk for the oil exporting countries.
Table 1 shows that the stock indices of the oil exporting countries have higher risks than the oil importing countries identifying the effect of oil and 2008 crises on their stock markets. Oil returns and the Middle East financial index returns have kurtosis values higher than three. We also observe that the distribution of returns is negatively and positively skewed. Therefore, the assumption of Gaussian returns is rejected by the Jarque-Bera test for crude oil and all countries.
11/23 OALib Journal
Table 1. Descriptive statistics of oil returns and the Middle East indexes returns.
Crude oil (WTI), oil importing countries
WTI Turkey Jordan Lebanon Egypt
Mean (%) 8.052 8.866 5.022 3.958 1.236 Std. Dev (%) 4.74 10.65 5.28 6.03 9.52
Skewness −0.9804 −0.340 −0.258 0.976 −0.261 Kurtosis 4.886 3.905 4.995 8.138 4.105
J.B 55.53 96.169 31.86 226.6 11.213 KPSS (C) 0.1289* 0.0504* 0.1011* 0.1289* 0.1573* KPSS (C&T) 0.0504* 0.0904* 0.0806* 0.0504* 0.0635*
Oil exporting countries
Kuwait Qatar Saudi Emirates Bahrain Oman
Mean (%) 8.442 12.759 8.686 7.560 1.646 6.315 Std. Dev (%) 5.484 8.088 8.13 14.211 5.046 5.827 Skewness −0.8011 −0.4879 −1.036 −1.921 −3.081 −0.6751
Kurtosis 6.135 7.004 6.506 9.994 21.663 6.785 J.B 93.012 127.42 124.4 477.6 289.3 121.14 KPSS (C) 0.0919* 0.0778* 0.0606* 0.0474* 0.1264* 0.0457* KPSS (C&T) 0.0687* 0.0456* 0.0594* 0.0463* 0.0808* 0.046* Notes: KPSS is the Kwiatkowski-Phillips-Schmidt-Shin test statistic (1992); C is constant; T is the trend. Super-scripts*denote acceptation of the null hypothesis of no unit root at the 1% level of significance [47]. Source: re-searcher’ computations, E-views, 7.
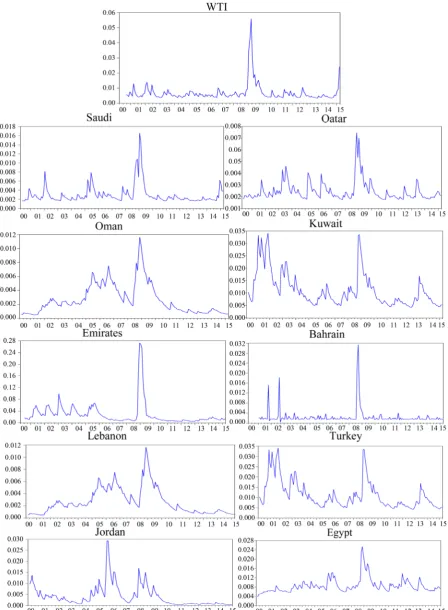
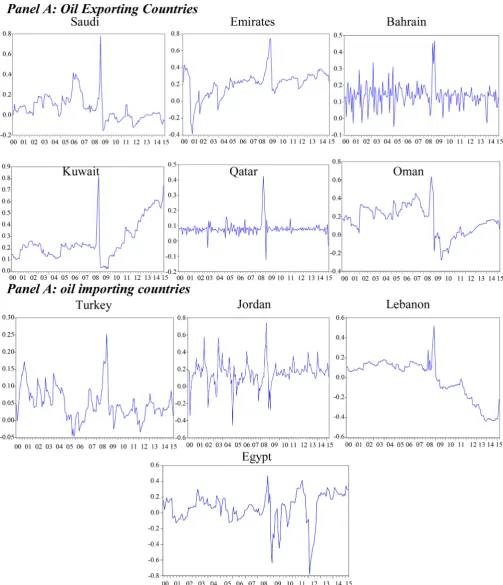
Figure 2 plots the volatility of oil returns and the volatility of stock index returns. Also, oil prices displayed sharp volatility throughout much of 2008, setting record highs on a consistent basis during the early part of the year and jumping to a high of over $147 per barrel in July. Consequently, a peak of volatility during mid-2008 and 2009 can be noted.
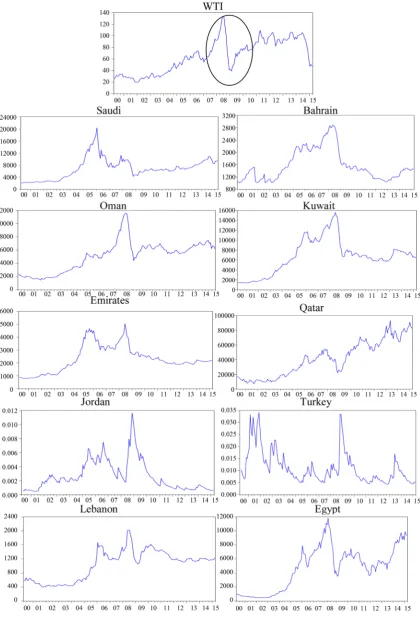
Figure 3 plots crude oil price (WTI) and stock indexes of some oil exporting and importing countries from the Middle East region during the 2000-2015 period. We clearly show that the oil price has a significantly sharp increasing, jumping to his maximum value in July 2008 (134$/barrel), reaching a peak of the 2008 global crisis. Then, the oil price showed a significantly sharp decrease suffering the consequences of the oil and financial crises.
For Middle East countries, we clearly show that the stock indices of oil importing and oil exporting countries have a significantly sharp decrease between mid-2007 and 2009. Over this period, index prices in all countries, have followed the same downward trend as the oil price. This behavior can be caused by the occurrence of subprime crisis who created the oil shock of 2008 and transformed after that on global financial crisis.
13/23 OALib Journal
jumping to a high of over $130 per barrel in July.Consequently,a peak of volatility dur-ing mid-2008 and 2009 can be noted.
From Figure 3, we show an increasing of volatility in some stock indexes on 2004- 2005 year due to the second Gulf Wars and especially in 2008-2009, a period character-ized by the of the global financial crisis and oil choc of 2008, all indexes depicts an in-crease in the volatility until reaching peaks. For the oil exporting countries (Saudi, Qatar, Bahrain, Kuwait, Oman, and Emirates), we illustrate a high volatility of the in-dexes, during the 2006-2009 period, correlated with the rise in oil volatility and suffer-ing the consequences of the U.S subprime crisis. In fact, the financial markets of Saudi, Qatar and Emirates are open to foreign direct investment and depend on a fluctuation of the economic world and oil price (see [48]).
In Figure 3, we detect another peak of volatility in some indexes which representing specific crises in their countries.
For Turkey stock index, the high volatility of 2001-2002 identifies the effect of the Turk monetary crisis. That GM generates the highest significant daily returns for the period 2001-2006 (Assoc. Prof. Dr. Ulusoy Tolga, 2009, Page 125) [49]. Except for the January effect or other seasonal effects, the Turkey 2001 economy crisis and beyond has engendered important deviation. However, the most important factor triggering the economic crisis, financial and negative developments in the banking sector is a fact known to occur with the cause, the abolition of the pegged exchange rate system in February 2001 [50].
In the Lebanon stock index, we show a peak of volatility in 2005 due to political dis-turbances (the assassination of Prime Minister). After 2012, we observe the increase in volatilities of Egypt and Turkey stock indexes related to social and political instability in some countries of the Middle East region (specially the revolution of Egypt and the war in Syria).
5.1. The Volatility Persistence
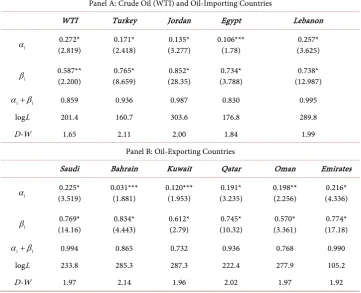
Table 2 provides the results for the GARCH (1,1) model for oil returns and stock in-dexes of oil-exporting and oil-importing countries in the Middle East region, the sensi-tivity to past own conditional volatility (β) appears to be significant for oil price and all stock indexes of the Middle East region. The volatility persistence is measured by the sum of the estimated coefficients α1+β1 gives an indication about.
The sign positive of the ARCH (α1) and GARCH (β1) parameters suggests a ten-dency for shocks to increase over time, and that volatility has some memory for its his-torical levels. In fact, the volatilities of oil and stock indexes depend on their past news and historical volatilities witch identifying the persistence of shocks and volatility.
The volatility of each index return is observed to be explosive as throughout the sum of the estimated coefficients α1+β1 is greater than 0.7 for most stock market indices. For oil returns, the volatility is less persistent, so, the oil shocks dissipate quickly despite their strong initial impact on stock markets.
15/23 OALib Journal
Table 2. Estimate volatility persistence by garch (1,1) model.
Panel A: Crude Oil (WTI) and Oil-Importing Countries
WTI Turkey Jordan Egypt Lebanon
1 α 0.272* (2.819) 0.171* (2.418) 0.135* (3.277) 0.106*** (1.78) 0.257* (3.625) 1 β 0.587** (2.200) 0.765* (8.659) 0.852* (28.35) 0.734* (3.788) 0.738* (12.987) 1 1
α +β 0.859 0.936 0.987 0.830 0.995
logL 201.4 160.7 303.6 176.8 289.8
D-W 1.65 2.11 2.00 1.84 1.99
Panel B: Oil-Exporting Countries
Saudi Bahrain Kuwait Qatar Oman Emirates
1
α 0.225*
(3.519) 0.031*** (1.881) 0.120*** (1.953) (3.235) 0.191* 0.198** (2.256) (4.336) 0.216*
1 β 0.769* (14.16) 0.834* (4.443) 0.612* (2.79) 0.745* (10.32) 0.570* (3.361) 0.774* (17.18) 1 1
α +β 0.994 0.865 0.732 0.936 0.768 0.990 logL 233.8 285.3 287.3 222.4 277.9 105.2
D-W 1.97 2.14 1.96 2.02 1.97 1.92
Note: t-statistics are reported in the parentheses. *, **, and *** denote significance at 1%, 5% and 10% level, respec-tively. Log L is the Log likelihood and D-W is the Durbin-Watson statistic. Source: researcher’ computations, E-views, 7.
persistence in the oil and stock markets. This does not confirm Gorton and Rouwenhorst [51] results that indicate the fact that returns on commodities are less vo-latile than those on stock markets, because the pairwise correlations between the re-turns on contracts for various commodities (e.g. Oil and copper, or oil and maize) tra-ditionally have been relatively low. With evidence of volatility persistence in oil and stock markets, it is possible to proceed to the second step of the empirical analysis fo-cused on the volatility spillover.
5.2. The Volatility Spillover
Table 3 presents the estimated parameters of the BEKK-GARCH (1,1) model from Equations (5)-(7).
Table 3. Volatility spillovers between crude oil and stock indices of Middle East.
Panel A: Oil-Importing Countries
Turkey Jordan Egypt Lebanon
11 α 0.4283* (5.38) 0.5484* (5.042) 0.6462* (6.586) −0.1855*** (−1.67) 12 α 0.0603***
(1.84) (−0.018) −0.0008 (0.513) 0.0612 (1.321) 0.0626
21
α −0.136**
(−2.365) (−1.27) −0.317 −0.2283* (−3.16) 0.4869** (2.50)
22 α −0.330** (−3.6) 0.3699* (6.49) −0.3026* (−3.27) 0.6565* (6.47) 11 β 0.5109*
(5.84) (0.391) 0.0988 0.2413 (1.19) 0.7691* (20.4)
12 β 0.9307* (7.91) 0.0103** (2.17) 0.5874** (2.529) −0.2608* (−9.72) 21 β −0.5344*
(−7.34) 0.5446* (3.036) 0.3972*** (1.746) 0.4902* (3.207)
22 β 0.489* (5.61) 0.916* (24.2) −0.358** (−2.05) 0.7164* (11.8)
Panel B: Oil-Importing Countries
Emirates Saudi Bahrain Kuwait Qatar Oman
11 α 0.2324* (3.05) 0.0172 (0.183) 0.3271** (2.54) 0.157 (1.38) 0.179* (1.911) −0.0458 (0.477) 12 α 0.3294* (3.107) 0.0908*** (1.76) 0.3321* (3.694) 0.0421** (2.48) −0.4012* (−4.42) 0.064*** (1.76) 21 α 0.1921* (3.43) −0.175** (−2.19) 0.1706 (0.64) 0.2995** (2.43) 0.1672** (2.29) −0.5328* (−3.64) 22 α 0.3661*
(4.08) 0.6354* (6.559) 0.866* (5.52) (5.106) 0.376* 0.448* (5.42) 0.4442* (5.83)
11 β 0.8993* (18.82) 0.7387* (5.753) 0.7699* (4.77) 0.8662* (14.47) 0.9016* (13.41) 0.4892* (4.24) 12 β 0.5477*
(6.707) 0.3710* (6.897) 0.0491** (2.37) 0.0906* (2.58) 0.0879*** (1.82) 0.2779* (4.51)
21 β −0.2057* (−6.699) 0.5565* (4.069) 0.2047 (0.52) 0.3736* (3.88) 0.0260** (2.336) 1.016* (12.2) 22 β 0.7733*
(14.13) 0.674* (8.95) 0.003** (2.027) 0.8213* (8.53) 0.7365* (8.34) 0.7535* (9.56)
Notes: t-values given in parentheses. * significant at 1%, ** significant at 5% and *** significant at the 10% level. The Results of estimated mean equation and constants of each variance equation are not reported for the sake of brevity. Source: researcher’ computations, E-views, 7.
17/23 OALib Journal
12
α is only significant for Turkey, suggesting that oil shocks affect significantly the
stock index volatility of Turkey.
By focusing on GARCH parameters, we show that there is a strong evidence of sig-nificant transmission of volatility (β12) from the oil market to stock markets for all oil importing countries (Turkey, Jordan, Egypt and Lebanon).
The analyzing shock transmissions from stock indexes to the oil market by α21, shows that the oil market is significantly affected by the stock market shocks of Turkey, Egypt and Lebanon. The GARCH parameter β21 illustrates a significant volatility spillover from all oil importing countries to oil market.
For oil exporting countries, The ARCH coefficient α12 is significant for all stock indexes (Saudi, Qatar, Bahrain, Kuwait, Oman and Emirates), suggesting that oil shocks affect significantly the stock index volatilities of oil exporting countries. In fact, the oil shock is automatically transmitted to stock markets of oil exporting countries in the Middle East region.
The estimation results of the GARCH parameter (β12) show that there is a strong evidence of significant transmission of the volatility of the oil market to stock indexes of oil exporting countries. The GARCH coefficient is positively significant, indicating that the rise in oil volatility causes the increase in stock index volatilities. These confirm the results of Filis, Degiannakis [19] when the rise in oil volatility would directly in-crease the volatility of GCC stock markets.
The analyzing shock transmissions from stock indexes to oil market by α21, shows that the oil market is significantly affected by the stock market shocks of all oil export-ing countries, except for Bahrain.
From GARCH parameters (β31), we show that there is an evidence of significant transmission of volatility of stock markets of oil exporting countries to the oil market, except for Bahrain.
Overall, our results support the presence of significant volatility spillover, in ARCH effect and/or in GARCH effect, from oil to stock markets for all importing and export-ing countries of the Middle East region. A bidirectional volatility transmission between oil and stock indexes is significantly observed with ARCH and GARCH parameters only for all importing and exporting countries, except for Bahrain. This result proves the interdependence of the stock markets of Middle East countries to oil price volatility.
5.3. Dynamic Conditional Correlation between Oil Market and Stock Markets
Figure 4 plots the graphs of the dynamic conditional correlation as computed from Equation (10) between oil returns and each stock index returns of oil exporting and importing countries for the Middle East region.
Figure 4. Dynamic conditional correlation between oil and stock indexes of Middle East. Source: researcher’ computations, E-views, 7.
19/23 OALib Journal
of oil exporting and importing countries increase, until reaching peaks, in 2008-2009 a period characterized by the oil shock of 2008 and the global financial crisis. This find-ing provides strong evidence in favor of contagion effect of the oil market crash to stock markets of the Middle East countries.
Following the global financial crisis, the dynamic correlation between oil and stock indexes of oil importing countries showed a decreasing because the sharp decline in world production due to economic recession. During this period 2009-2010, the stock markets of oil importing countries exhibited a negative correlation and showed a nega-tive peak. Also, the declining correlation is explained by the stability of oil prices at low levels following the decision of some countries of OPEC to not reduce their production. For oil importing countries, the correlation between oil prices and stock markets is affected by the war in Iraq. The correlation coefficients between oil prices and stock markets increased and a peak in correlation coefficient is observed around the year of 2003 in oil importing countries.
Table 3 illustrates that the social and political instability in some countries of the Middle East region (specially the revolution of Egypt and the war with Syria) has af-fected significantly the correlation between oil prices and stock markets of Egypt and Turkey in 2012. The correlation coefficients between oil prices and stock markets de-creased and a peak in correlation coefficient is observed around the year 2012.
After 2012, we notice the increase in volatilities of Turkey and Egypt stock indexes related to social and political instability in some Middle East countries (specially the revolution of Egypt and the war with Syria). Summarizing the major event that influ-ences the dynamic conditional correlation between crude oil and stock indices of Mid-dle East countries is the oil and financial crises of 2008 which led to a high level of cor-relation during the 2008-2009 period. We reveal the extent of the oil shock of 2008 and the economic effect of global financial crisis on the correlation between crude oil and stock indices by the magnitude of the estimated coefficients, which were significantly higher than those of the previous events and crises. Accordingly, to the results of BEKK-GARCH model which showed the transmission of oil shock and volatility to stock indices of Middle East countries, the estimated results of DCC-GARCH which detecting the higher correlation during the oil crisis of 2008, confirm the volatility spillover and prove the contagion effect between oil and stock indices of Middle East countries.
6. Conclusions
The paper investigates the volatility spillovers and the conditional correlations between oil price shocks returns and stock index returns using multivariate GARCH models, namely the BEKK-GARCH model and the DCC-GARCH model. The sample contains both oil importing and oil exporting countries that depend heavily on oil production and exports.
All Share (TASI) is the general index of Saudi, Bahrain All Share [13] index depict the financial index of Bahrain, Muscat Securities Market 30 is the index of Oman, Qatar exchange index (QE) is the Qatar financial index, Abu Dhabi securities market index (ADSMI) is the general financial index of Emirates and Kuwait stock exchange index (KWSE) represents financial index of Kuwait, the BIST National 100 represents the stock index of Turkey, EGX 30 is the principal index of Egypt, BLOM Stock index represents the Lebanon financial index and Amman SE represents the financial index of Jordan, from 3/2000 to 3/2015.
The empirical results from GARCH model indicate a high degree of volatility persis-tence in the oil and stock markets. This does not confirm Gorton and Rouwenhorst
[51] results that indicate the fact that returns on commodities are less volatile than those on stock markets, because the pairwise correlations between the returns on con-tracts for various commodities (e.g. oil and copper, or oil and maize) traditionally have been relatively low.
The results from the BEKK-GARCH model support the presence of significant vola-tility spillover of oil in stock markets for all oil importing and exporting countries of the Middle East region. In addition, oil market is significantly affected by the stock market shocks of the most oil importing and exporting countries. This indicates a bidirectional volatility transmission between oil and stock markets, which confirming the spillover influence and the interdependence of stock indices Middle East countries to oil market.
According to the DCC-GARCH model, the dynamic conditional correlations be-tween crude oil returns and index returns vary dramatically over time. During the 2008 oil and financial crises, the pattern shows the increase in correlation for all stock indices until reaching a peak. The extent of the effect of the 2008 crises on the correlation coef-ficients is significantly more important than those of the previous events. Also, we find that the dynamic conditional correlation between oil and stock indices do not differ from oil-importer or oil-exporter countries in the 2008-2009 period. This confirms the results of BEKK-GARCH model which showed the volatility spillover and establish the contagion influence of oil price shock and volatility to stock indices of Middle East countries, especially during the oil crisis of 2008.
Finally, oil price shocks seem to have a significant influence on the relationship be-tween oil and stock indices of Middle East countries. This result reduces the gains of portfolios international diversification and explains why investors are turning to other various commodities (e.g. Gold, copper and other precious metals) during the oil and financial crisis period of 2008-2009. The investors prefer to investigate in the domestic market to avoid the influence of crisis.
References
[1] Malatyali, Ö. (2016) Teknoloji Transferinin Ekonomik Büyüme Üzerine Etkisi: Türkiye Örneği 1989-2014. 62-73.
21/23 OALib Journal
[3] Oktik, Ş., et al. Güneş-Elektrik Enerjisi Dönüşüm Sistemlerinin Anket Değerlendirmeleri. [4] Ulusoy, T. (2011) Financial Power Analysis of Countries: Transmitters (Adsorbents),
Set-ters and Unresistants. African Journal of Business Management, 5, 9087-9105. [5] U.S. Energy Information Administration Home Page. www.eia.gov
[6] Cologni, A. and Manera, M. (2008) Oil Prices, Inflation and Interest Rates in a Structural Cointegrated Var Model for the G-7 Countries. Energy Economics, 30, 856-888.
http://dx.doi.org/10.2139/ssrn.843505
[7] Erdoğan, M. (2012) Vuk’ndan Tfrs’na Geçiş Rehberi. Mumeyek Vakfı Yayının 01, İstanbul, 6-14.
[8] Aimer, N. (2016) The Impact of Oil Price Fluctuations on the Exchange Rate in Libya. Im-perial Journal of Interdisciplinary Research, 2, 599-609.
[9] Zorina, Z.A. and Obozova, T.A. (2011) New Data on the Brain and Cognitive Abilities of Birds. Zoologichesky Zhurnal, 90, 784-802.
[10] Bjørnland, H.C. (2009) Oil Price Shocks and Stock Market Booms in an Oil Exporting Country. Scottish Journal of Political Economy, 56, 232-254.
[11] Balcilar, M. and Ozdemir, Z.A. (2013) The Causal Nexus between Oil Prices and Equity Market in the US: A Regime Switching Model. Energy Economics, 39, 271-282.
https://doi.org/10.1016/j.eneco.2013.04.014
[12] Erdoğan, M., İbrahim, K. and Salih, G. (2016) Transferıng Marketable Securıtıes Account Group of Tucoa to Opennıng Fınancıal Statements according to New Turkısh Trade Code as of Tfrs. Kastamonu Üniversitesi, İktisadi Veİdari Bilimler Fakültesi Dergisi, 11, 181-232. [13] Awartani, B. and Maghyereh, A.I. (2013) Dynamic Spillovers Between Oil and Stock
Mar-kets in the Gulf Cooperation Council Countries. Energy Economics, 36, 28-42.
https://doi.org/10.1016/j.eneco.2012.11.024
[14] Ulusoy, T., et al. (2012) Complexity of Major UK Companies between 2006 and 2010: Hie-rarchical Structure Method Approach. Physica A: Statistical Mechanics and Its Applica-tions, 391, 5121-5131. https://doi.org/10.1016/j.physa.2012.01.026
[15] Park, J. and Ratti, R.A. (2008) Oil Price Shocks and Stock Markets in the US and 13 Euro-pean Countries. Energy Economics, 30, 2587-2608.
https://doi.org/10.1016/j.eneco.2008.04.003
[16] Driesprong, G., Jacobsen, B. and Maat, B. (2008) Striking Oil: Another Puzzle? Journal of Financial Economics, 89, 307-327. https://doi.org/10.1016/j.jfineco.2007.07.008
[17] Miller, J.I. and Ratti, R.A. (2009) Crude Oil and Stock Markets: Stability, Instability, and Bubbles. Energy Economics, 31, 559-568. https://doi.org/10.1016/j.eneco.2009.01.009
[18] Ghorbel, A. and Younes, B. (2010) Response of International Stock Markets to Oil Price Shocks. Department of Economics in University of Sfax-Tunisia, 1-27.
[19] Filis, G., Degiannakis, S. and Floros, C. (2011) Dynamic Correlation between Stock Market and Oil Prices: The Case of Oil-Importing and Oil-Exporting Countries. International Re-view of Financial Analysis, 20, 152-164. https://doi.org/10.1016/j.irfa.2011.02.014
[20] Eryiğit, M. (2012) The Dynamical Relationship between Oil Price Shocks and Selected Ma-croeconomic Variables in Turkey. Economic Research, 25, 263-276.
[21] Basher, S.A., Haug, A.A. and Sadorsky, P. (2012) Oil Prices, Exchange Rates and Emerging Stock Markets. Energy Economics, 34, 227-240. https://doi.org/10.1016/j.eneco.2011.10.005
[22] Mohanty, S.K., Nandha, M., Turkistani, A.Q. and Alaitan, M. (2011) Oil Price Movements and Stock Market Returns: Evidence from Gulf Cooperation Council (GCC) Countries.
[23] Fayyad, A. and Daly, K. (2011) The Impact of Oil Price Shocks on Stock Market Returns: Comparing GCC Countries with the UK and USA. Emerging Markets Review, 12, 61-78.
https://doi.org/10.1016/j.ememar.2010.12.001
[24] Lescaroux, F. and Mignon, V. (2008) On the Influence of Oil Prices on Economic Activity and Other Macroeconomic and Financial Variables. OPEC Energy Review, 32, 343-380.
https://doi.org/10.1111/j.1753-0237.2009.00157.x
[25] Hammoudeh, S. and Choi, K. (2006) Behavior of GCC Stock Markets and Impacts of US Oil and Financial Markets. Research in International Business and Finance, 20, 22-44.
https://doi.org/10.1016/j.ribaf.2005.05.008
[26] Guesmi, K. and Fattoum, S. (2014) Measuring Contagion Effects Between Crude Oil and OECD Stock Markets. 1-11.
[27] Chang, C.-L., Mcaleer, M. and Tansuchat, R. (2013) Conditional Correlations and Volatility Spillovers between Crude Oil and Stock Index Returns. The North American Journal of Economics and Finance, 25, 116-138. https://doi.org/10.1016/j.najef.2012.06.002
[28] Maghyereh, A., Awartani, B. and Jahera, J. (2016) Oil Price Uncertainty and Equity Re-turns: Evidence from Oil Importing and Exporting Countries in the Mena Region. Journal of Financial Economic Policy, 8, 64-79. https://doi.org/10.1108/JFEP-06-2015-0035
[29] Fang, C.-R. (2010) The Impact of Oil Price Shocks on the Three Bric Countries’ Stock Pric-es. Department of Economics, National Cheng-Chi University, Taiwan, 1-28.
[30] Assaf, A. (2003) Transmission of Stock Price Movements: The Case of GCC Stock Markets.
Review of Middle East Economics and Finance, 1, 171-189.
[31] Hammoudeh, S., Dibooglu, S. and Aleisa, E. (2004) Relationships among US Oil Prices and Oil Industry Equity Indices. International Review of Economics & Finance, 13, 427-453.
https://doi.org/10.1016/S1059-0560(03)00011-X
[32] Chiou, J.-S. and Lee, Y.-H. (2009) Jump Dynamics and Volatility: Oil and the Stock Mar-kets. Energy, 34, 788-796. https://doi.org/10.1016/j.energy.2009.02.011
[33] Kizgin, Y. and Benli, T. (2013) The Examining of GSM Operators’ Customer Complaint Management (CCM) Applications in Turkey with Discriminant Analysis. International Journal of Business and Management, 8, 1-17. https://doi.org/10.5539/ijbm.v8n3p1
[34] Asteriou, D. and Bashmakova, Y. (2013) Assessing the Impact of Oil Returns on Emerging Stock Markets: A Panel Data Approach for Ten Central and Eastern European Countries.
Energy Economics, 38, 204-211. https://doi.org/10.1016/j.eneco.2013.02.011
[35] Engle, R. (2002) Dynamic Conditional Correlation: A Simple Class of Multivariate Genera-lized Autoregressive Conditional Heteroskedasticity Models. Journal of Business & Eco-nomic Statistics, 20, 339-350. https://doi.org/10.1198/073500102288618487
[36] Zhu, H.-M., Li, R. and Li, S. (2014) Modelling Dynamic Dependence Between Crude Oil Prices and Asia-Pacific Stock Market Returns. International Review of Economics & Finance, 29, 208-223. https://doi.org/10.1016/j.iref.2013.05.015
[37] Guesmi, K. and Fattoum, S. (2014) Return and Volatility Transmission between Oil Prices and Oil-Exporting and Oil-Importing Countries. Economic Modelling, 38, 305-310.
https://doi.org/10.1016/j.econmod.2014.01.022
[38] Aydogan, B. and Berk, I. (2015) Crude Oil Price Shocks and Stock Returns: Evidence from Turkish Stock Market under Global Liquidity Conditions. International Journal of Energy Economics and Policy, 5, 54-68.
[39] Balli, F., Hajhoj, H.R., Basher, S. and Ghassan, H. (2015) An Analysis of Returns and Vola-tility Spillovers and Their Determinants in Emerging Asian and Middle Eastern Countries.
23/23 OALib Journal
https://doi.org/10.1016/j.iref.2015.04.013
[40] Baumeister, C. and Hamilton, J.D. (2015) Structural Interpretation of Vector Autoregres-sions with Incomplete Identification: Revisiting the Role of Oil Supply and Demand Shocks. Manuscript, University of Notre Dame and Ucsd, San Diego, 1-47.
[41] Bouri, E. and Demirer, R. (2016) On the Volatility Transmission between Oil and Stock Markets: A Comparison of Emerging Importers and Exporters. Economia Politica, 33, 63- 82. https://doi.org/10.1007/s40888-016-0022-6
[42] Amin, M.Y., Amin, Z.Y. and Zadeh, H.R. (2016) Oil Price Shocks, Asymmetric Effect and Volatility Spillover. Case of Stock Market in Oil Exporting Countries. Journal of Insurance and Financial Management, 1, 35-61.
[43] Li, Q., Cheng, K. and Yang, X. (2016) Response Pattern of Stock Returns to International Oil Price Shocks: From the Perspective of China’s Oil Industrial Chain. Applied Energy, 185,1821-1831. https://doi.org/10.1016/j.apenergy.2015.12.060
[44] Diaz, E.M., Molero, J.C. and De Gracia, F.P. (2016) Oil Price Volatility and Stock Returns in the G7 Economies. Energy Economics, 54, 417-430.
https://doi.org/10.1016/j.eneco.2016.01.002
[45] Kendirli, S. and Çankaya, M. (2016) Ham Petrol Fiyatlarinin Bist 100 Ve Bist Ulaştirma Endeksleri İle İlişkisi. 137-141. https://doi.org/10.21180/kuiibf.20161218251
[46] Engle, R.F. and Kroner, K.F. (1995) Multivariate Simultaneous Generalized ARCH. Eco-nometric Theory, 11, 122-150. https://doi.org/10.1017/S0266466600009063
[47] BIST (2016) Endeks Verileri.
[48] Özdamar, G. (2016) Doğrudan Yabanci Yatirimlarin Gelir Düzeyi Ve Döviz Kuru İle İlişkisi: Türkiye Üzerine Ekonometrik Bir İnceleme. 98-117.
https://doi.org/10.21180/kuiibf.20161218248
[49] Ulusoy, T. (2009) Analysis of Government Bonds’ Compound Interest Rates between 1996- 2006 in the ISE Bonds and Bills Secondary Market Using Grey System Theory. The Journal of American Academy of Business, 14, 125-132.
[50] Nuray, T. (2011) Finansal Entegrasy on Sürecinde Türkiye’deki Bankacilik Sektörünün Ab Bankacilik Sektörü Ile Karşilaştirilmasi. Bilimler Fakültesi Dergisi, 5.
[51] Gorton, G. and Rouwenhorst, K.G. (2006) Facts and Fantasies about Commodity Futures.
Financial Analysts Journal, 62, 47-68. https://doi.org/10.2469/faj.v62.n2.4083
Submit or recommend next manuscript to OALib Journal and we will provide best service for you:
Publication frequency: Monthly
9 subject areas of science, technology and medicine Fair and rigorous peer-review system
Fast publication process
Article promotion in various social networking sites (LinkedIn, Facebook, Twitter, etc.) Maximum dissemination of your research work