http://dx.doi.org/10.4236/jcc.2015.35019
Fuel Consumption System
Yen-Jen Chen, Chia-Hung ChienMing Chi University of Technology, 84 Gungjuan Rd., Taishan Dist., New Taipei City 24301, Taiwan Email: [email protected], [email protected]
Received April 2015
Abstract
Fleet Management System (FMS) is a highly applicable system which gets more and more attention among industrial field. Recent years, fuel consumption has become one of the most concerned topics, hence, establishment of a fuel consumption monitoring system is required. In this study, based-on the FMS, a system which was capable of precisely monitoring and calculating the fuel consumption was designed. This FMS was composed of the front end Vehicle Tracking System (VTS) and the back end Management Server (MS). VTS was established and installed into the vehicles, based on several well-known technologies, such as Mobile Telecommunications Technology of GPRS or 3G, Global Positioning System (GPS), and On-Board Diagnostics II (OBD-II). In addition, VTS was also connected with the Vehicle Electronic Control Unit (VECU) through the OBD-II inter-face. By using GPRS/3G technology and the TCP/IP communication protocol, real-time vehicle op-eration data obtained from the OBD-II and positioning information from the GPS could be sent backward to the MS. The MS was designed through JBoss Developer Studio, and included the Data Collector (DC) and Web server. The DC gathers data sent back from VTS and the Web server calcu-lates and decides the vehicle's present situation according to the data. The result can also be pre-sented on websites by the Web server. In this study, the fuel consumption status of vehicles could be performed. Furthermore, the Web service also provided the users instant online manipulation.
Keywords
Fleet Management System, Vehicle Tracking System, Fuel Consumption, Mobile Telecommunications, GPS, OBD-II
1. Introduction
Y.-J. Chen, C.-H. Chien
Price is often fluctuated, which results in the high gasoline price. Therefore, a system that could provide fuel consumption calculation and analysis is highly essential for the fleet managers.
On-Board Diagnostics (OBD) technique was first developed in 1975, called OBD-I, which is used for ex-tracting data of fuel consumption and air pollution of vehicles; however, it is not widely used not only due to its connection interface set in the engine bay but also the insufficiency of error codes. In 1996, the more functioned version, OBD-II [3] was developed, which put its connection panel beneath the steering wheel and added many error codes, hence the OBD-II diagnosis panel was requested for all newly manufactured vehicles by the US government. In 2008, a mandate declared by government of R.O.C. indicated that all commercial vehicles should be equipped with OBD-II panel. Therefore, in Taiwan, cars manufactured after the year 2008 could ob-tain real-time fuel consumption data of the vehicles through the OBD-II and thus the acquirement of data were simplified and standardized.
Recent years, people increasingly rely on intelligent living style due to the maturation of GPS technique and the rapid development and improvement of communication technology. The technologies also improve the effi-ciency of enterprise management, in which the FMS is one of the benefited systems. Before the GPRS/3G and GPS technique applied in FMS, the fleet managers could only record, calculate and analysis car-driving data by paper-works. But after these two techniques applied in FMS, they could use VTS to read the VECU and ex-tracted the detailed and precise information of a vehicle.
Meanwhile, the data could also be sent back to MS immediately and provide the fleet manager the first-hand report. This method not only increases the efficiency and preciseness of mobile data, but also decreases the prime cost of management through the M2M manner.
In this study, the calculation, analysis and data proof of fuel consumption were the most important parts and advantages. In Section 2, it will explain some methods about vehicle consumption calculation. In Section 3, it will introduce how Fuel Consumption System (FCS) integrates the VTS and MS and how VTS structure com-prises the GPRS/3G, GPS and OBD-II system. The Section 4 will describe how to calculate and proof the fuel consumption right. The Section 5 will present the results of calculation and analysis and there is a summary of this study in Section 6.
2. Related Works
Recent years, due to the highly raised fuel price, more and more study tried to develop a system for calculation and analysis of fuel consumption. In the past, most FMSs conducting the calculation and analysis of fuel con-sumption was based on paper-records and mileage of the cars or the emission of carbonic molecules [4]. How-ever, these two methods cannot provide instant and highly precise results. Calculating the fuel consumption through paper-records is a labor-intensive work and also hard to reach instantiation. Besides, this method might result in inaccuracy due to the lack of real-time data. Calculation of fuel consumption through detecting the car-bon emission is more precise and useful, but the carcar-bon emission may distinct from different types and ages of the engines; furthermore, application of different kinds of fuel can also result in distinctive carbon emission. Therefore, the types of engine, ages of engine and kinds of fuel can not only influence the amount of carbon emission but also affect the calculation results of fuel consumption.
OBD-II is an advanced technique applied for vehicle diagnosis. Most of recent studies used OBD-II to con-nect VECU and obtained the error code [5]. According to the error code, the managers could know the point of breakdown and could repair it. In addition, the OBD-II panel could also provide other detail information of the vehicle simultaneously, such as fuel status, coolant temperature, timing advance, absolute throttle position, etc. Based on the information, it could provide more precise and real-time analysis of fuel consumption.
3. Architecture
3.1. Overall Architecture
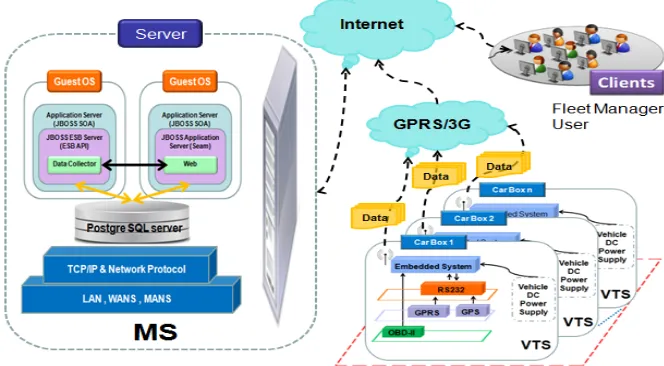
Overall architecture and application in this study is shown in Figure 1, and through the combination of VTS and MS, it provided remote monitoring and online calculation of fuel consumption. The following components are included to construct this system:
• VTS: is response to vehicle telematics monitoring and return vehicle information; • Data Collector(DC): is for receiving and storing data;
Figure 1. Overall architecture (VTS, MS).
The VTS sends the data backward to the DC of MS by the conduction of GPRS/3G, and the data format is transformed before being saved in the Database (DB), where Postgre SQL server is used to construct DB. Users could link to the Web Server through Internet and demand for the current fuel consumption information of their vehicles. The server would retrieve the data from DB for the demand of users and provide calculation and data analysis service. The results would all present on the website. The whole of MS was designed through JBoss Developer Studio [6].
3.2. VTS Architecture
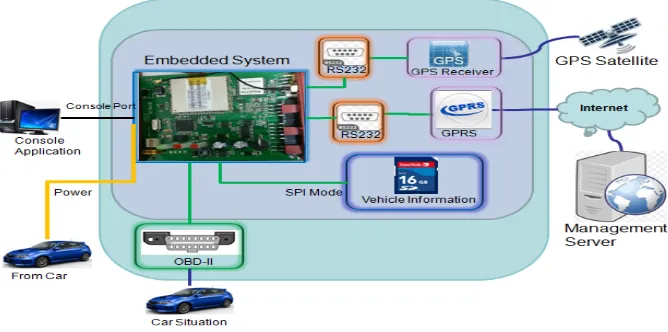
VTS is used to achieve Vehicle telematics monitoring and vehicle information data return. The system compo-nents of VTS are shown in Figure 2.
• Embedded System (ES): is implemented by MCU (Micro Controller Unit) and responsible to the role of con-trolling and coordinating of other components;
• GPS receiver: is to receive GPS data and compute latitude and longitude position and time; • OBD-II interface: is for the access to vehicle information (e.g., fuel status);
• GPRS/3G module: is to send vehicle information to server; • SD card: is to store vehicle information.
ES connects to a vehicle by OBD-II interface, for obtaining fuel status. ES is integrated with GPS receiver and GPRS/3G module by RS232 interface and with SD card by SPI. Through GPS receiver, ES can obtain lati-tude and longilati-tude position and GPS time. All vehicle information data is stored by SD card controlled by ES, and is sent to server through GPRS/3G module.
4. Algorithm
4.1. Fuel Consumption Calculation Algorithm
OBD-II is a national standard system for diagnosis of vehicles' fuel consumption and exhausts. It defines several numerical values, including coolant temperature, timing advance, absolute throttle position, fuel consumption, etc. Since January 2008, newly manufactured vehicles in Taiwan must be equipped with OBD-II panel, and this mandate has been performed much earlier in US. The OBD-II system is an event data recorder and connected to VECU to obtain internal data.
Y.-J. Chen, C.-H. Chien
Figure 2. VTS architecture (GPRS, GPS, OBD-II, embedded system).
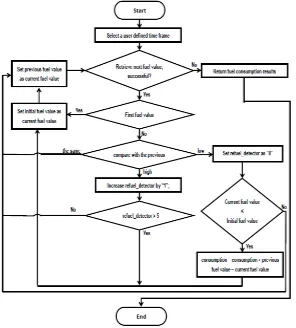
with the previous fuel value and the current fuel value, if the current fuel value is low, system will calculate the difference between current fuel and initial fuel values, and calculate fuel consumption. If the current fuel value is high, system will need to determine whether the fuel status is in refuelling or not. When the vehicle drives on the slope, the detected fuel amount may be higher or lower than the actual fuel amount, hence a variable, refuel detector, is applied for this circumstance. The refuel detector could be used for refuelling detection in order to rule out the false increase of the fuel. The threshold of refuel detector was set in 5 times, which indicates the fuel status is in refuelling when consecutive five times of increase of the fuel happens. According to the result in this study, five times was an acceptable and precise number for the refuel detector.
4.2. Fuel Consumption Analysis Algorithm
Single vehicle consumption analysis algorithm (Figure 4(a))
1) Set the query conditions: license number (single), time, fuel type, compute cycles 2) Get corresponding to the vehicle information from the database, and sort by time of data
3) According to the user specified time range, calculate and analyse the vehicle related to fuel consumption in-formation (average speed, average Revolution(s) Per Minute (RPM), fuel consumption, efficiency of fuel consumption (Km/L), driving distance…)
4) Show the calculation and analysis of the results to chart 5) Multiple vehicle consumption analysis algorithm (Figure 4(b))
6) Set the query conditions:license number (plurality), time, fuel type, compute cycles 7) Get corresponding to the vehicle information from the database, and sort by time of data 8) In accordance with license number, transmits the acquired data to classify
9) Separate calculation and analysis of each vehicle related to fuel consumption information (average speed, average RPM, fuel consumption, efficiency of fuel consumption (Km/L), driving distance…)
10)Show the calculation and analysis of the results to chart
5. Results of Fuel Consumption Analysis
5.1. Single Vehicle Consumption Analysis
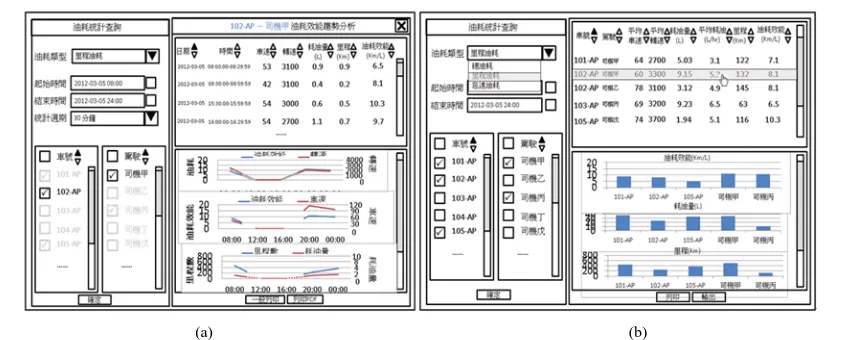
In Figure 5(a), according to the analysis of fuel consumption, especially for the different types of consumption including total fuel consumption, fuel consumption for mileage and fuel consumption for idle, the results can provide the information about the driver’s driving habit. The analysis of fuel consumption for idle can reveal that if the driver performed improper engine idling which largely increased fuel consumption as well as the en-vironmental pollution and fuel wasting.
5.2. Multiple Vehicle Consumption Analysis
Figure 3. Fuel consumption calculation algorithm.
[image:5.595.147.480.438.710.2](a) (b)
Y.-J. Chen, C.-H. Chien
[image:6.595.103.531.80.250.2](a) (b)
Figure 5. Results of fuel consumption analysis: (a) for a single vehicle; (b) for multiple vehicles.
problematic driver or vehicle by the analytic charts. If different drivers drive the same car and the results always show more fuel consumption for the car, the excessive consumption should come from the poor vehicle. Whe-reas, if the same driver drives different cars and the results always exhibit more fuel consumption for the driver, the excessive consumption is more likely coming from the inadequate driving habit of the driver.
6. Summary
Due to the rapid development of M2M technique, it is cost-saving and can also provide data instantaneity and preciseness to use M2M as the core structure. In this study, the designation comprises not only the M2M tech-nique, but also the commonly applied GPRS/3G, GPS, and OBD-II, which improves the function of FMS and increases the efficiency of industrial management.
The GPRS/3G sends back the real-time OBD-II data to FMS Management Server (MS). The MS combined with the Fuel Consumption calculating system developed in this study can calculate and analyse the fuel con-sumption precisely in real time. By using this system, the fleet manager can provide proper adjustment to each vehicles and drivers according to the results analysis, and decrease the managing costs and increase the effi-ciency of management.
The further study will focus on extracting much more mobile data from this system and use the MS to analy-sis the mobile status, which will much improve the vehicle management and road safety.
References
[1] Gutiérrez, V., Izaguirre, M., Pérez, J., Munoz, L., López, D. and Sánchez, M. (2010) Ambient Intelligence in Inter-modal Transport Services: A Practical Implementation in Road Logistics. The 4th International Conference on Sensor Technologies and Applications (SENSORCOMM), Venice,18-25 July 2010, 203-209.
[2] Thong, S.T.S., Han, C.T. and Rahman, T.A. (2007) Intelligent Fleet Management System with Concurrent GPS & GSM Real-Time Positioning Technology.The7th International Conference on ITS Telecommunications, Sophia An-tipolis, 6-8 June 2007, 1-6.
[3] OBD-II (On-Board Diagnostics-II) on http://www.obdii.com/
[4] Liu, J. and Wang, Y. (2011) Development on Automobile Fuel Consumption Intelligent and Rapid Testing System. In-ternational Conference on Electric Information and Control Engineering (ICEICE),Wuhan, 15-17 April 2011, 4942- 4945.
[5] Jhou, J.-S., Chen, S.-H., Tsay, W.-D. and Lai, M.-C. (2013) The Implementation of OBD-II Vehicle Diagnosis System Integrated with Cloud Computation Technology. The 2nd International Conference on Robot, Vision and Signal Processing (RVSP),Kitakyushu, 10-12 December 2013, 9-12. http://dx.doi.org/10.1109/RVSP.2013.55