SPECTROCOPIC METHOD DEVELOPMENT AND VALIDATION OF
VALSARTAN BY USING PH 6.4 BUFFER
Surwade Kunal S.*1, Gawai Mamta N.1 and Raut Abhijit R.2
1
R. G. Sapkal Institute of Pharmacy, Nasik.
2
Kamal Prakash Pharmacy College and Research Centre, Kherda Tal. Karanja Dist. Washim.
ABSTRACT
Simple precise accurate UV Spectroscopic method has been developed
and validated for estimation of valsartan in bulk and pharmaceutical
dosage form. It is approved for the treatment of hypertension. It is an
angiotensin II receptor antagonist. UV Spectroscopic method which is
based on measurement of absorption of UV light, the spectra of
valsartan in Phosphate buffer PH 6.4 showed maximum wavelength at 252 nm and calibration curve were plotted over the concentrations
ranging from 2-20μg/ml of valsartan with correlation coefficient 0.998
validation was performed as per ICH Q2 (R1) guidelines for linearity, accuracy, precision
and recovery. The limit of detection (LOD) and limit of quantification (LOQ) were found to
be 0.1224 and 0.3785 respectively by simple UV Spectroscopy. The proposed method was
validated.
KEYWORDS: Valsartan, Phosphate buffer PH 6.4, spectrophotometry and validation.
INTRODUCTION
Valsartan is chemically (2S) - 3-methy l-2- [N- ({4- [2 -(2H-1,2,3,4- tetrazol-5-yl)phenyl]
phenyl} methyl) pentanamido] butanoic acid. It is white fine powder, slightly soluble in
water, soluble in alcohol. It acts as antihypertensive Agent (Angiotensin II Receptor
Antagonist). Structure of Valsartan is shown in figure – I. Here calibration curve method was
employed by using phosphate buffer for the estimation of Valsartan in bulk and tablet dosage
forms. “Phosphate buffer is aqueous solutions which are used to increase the aqueous
solubility of another solute (poorly water soluble drug)”. In the present investigation,
phosphate buffer as solublizing agent, PH 6.4 was employed to solubilize Valsartan fine
Volume 8, Issue 2, 1278-1284. Research Article ISSN 2277– 7105
Article Received on 12 Dec. 2018,
Revised on 01 Jan. 2019, Accepted on 22 Jan. 2019
DOI: 10.20959/wjpr20192-14173
*Corresponding Author
Surwade Kunal S.
R. G. Sapkal Institute of
powder and its tablet dosage form to carryout spectrophotometric analysis. UV spectrum of
Valsartan in phosphate buffer PH 6.4 shown in figure-II.
Fig. 1: Structure of Valsartan.
MATERIALS AND METHODS
Materials: Valsartan working standard drug was obtained from Dr. Reddy’s Laboratories Ltd. (India), Mumbai, India. Distilled water was used to prepare phosphate buffer. Freshly
prepared solutions were always employed.
Equipment: The UV-spectrophotometry (Jasco V630) with data processing system (UV Probe Software 2.31) was used. The sample solution Mumbai. All analytical grade chemicals
and solvents were supplied by S.D. Fine chemicals, was recorded in 1 cm quartz cell against
solvent blank over the range 200-400 nm. The citizen electronic balance (Schimadzu 220h)
was used for weighing the sample. An ultrasonicator bath (PCI Analytics Pvt. Ltd) was used
for sonicating the drug sample.
Preparation of standard stock solution
Standard drug solution of valsartan was prepared by dissolving 10 mg pure valsartan in
phosphate buffer PH 6.4 and transferred into 100 ml volumetric flask to obtain 100 μg/ml of stock solution from which desired concentrations of solutions were prepared.
Preparation of test solution
20 Tablets were weighed and its average weight was determined. An accurately weighed
dissolved in 100 ml of phosphate buffer and sonicated for 15 min and volume was made upto
the mark and solution was filtered using whattman filter paper to obtain 100μg/ml stock
solution.
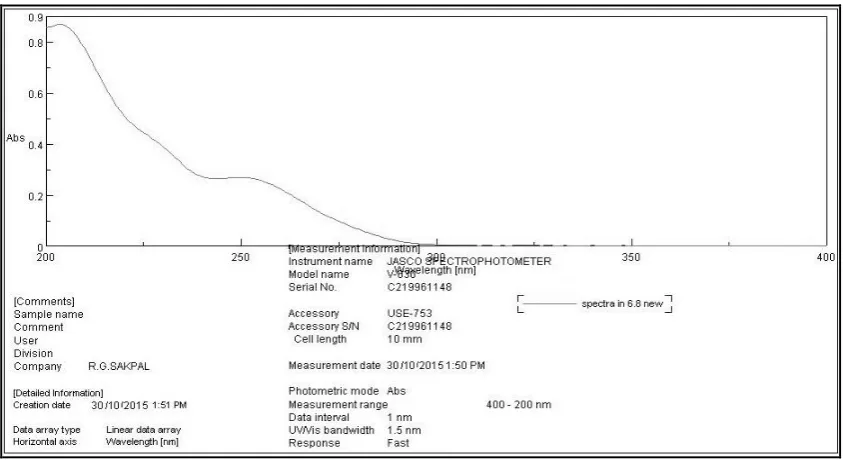
Determination of λmax
10 μg/ml solution of valsartan was prepared and scanned in UV range of 200-400nm and
spectrum was obtained. The λmaxwas found to be at 252 nm wavelength where absorbance
was maximum at this wavelength. Hence this is considered as absorbance maxima (λmax)
shown in figure 1.
Fig. 2: Determination of λmax.
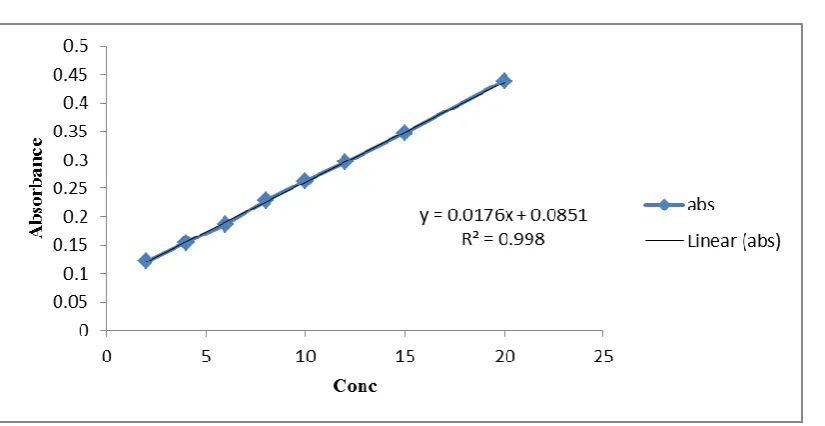
Preparation of calibration curve
Standard stock solution was suitably diluted with phosphate buffer to obtain concentrations
ranging from 2-20 μg/ml. Absorbance of these solutions was measured at 252 nm (λmax
valsartan) using UV, calibration curve was obtained by plotting graph between concentration
[image:3.595.87.509.263.493.2]Fig. 3: Calibration Curve of Valsartan In Phosphate Buffer pH 6.4.
Method Validation
Validation of the Proposed Method
The proposed method was validated according to the (ICH) guidelines.
Linearity
The linearity of the proposed UV methods were evaluated by analysing different
concentration of standard solution of Valsartan and by plotting Area under curve of analyte
against concentration of analyte. Beer’s law was obeyed for the method in the concentration
range 2-20μg/ml. Graph was plotted for concentration and absorbance. A good linear
relationship (R² = 0.998) was observed between the concentrations of Valsartan and
corresponding Area under curve. The regression analysis was made for slope, intercept and
correlation coefficient values. The equation of calibration curve obtained was
Y=0.0176x+0.0851.
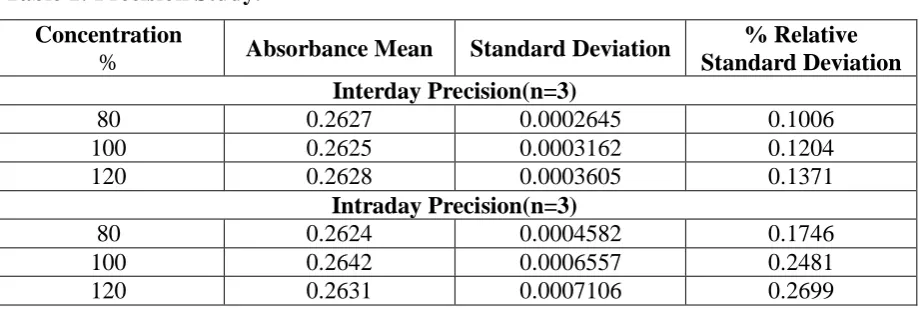
Precision
Precision is the measure of closeness of values between each concentration under same
analytical conditions. It is determined by performing Interday and intraday precision studies.
In intraday studies three standard raplicates injection of three different concentration were
injected on same day and same standard different concentration were injected on three
successive days in inter day precision studies. Where, the % RSD was found to be within
Table 1: Precision Study. Concentration
% Absorbance Mean Standard Deviation
% Relative Standard Deviation Interday Precision(n=3)
80 0.2627 0.0002645 0.1006
100 0.2625 0.0003162 0.1204
120 0.2628 0.0003605 0.1371
Intraday Precision(n=3)
80 0.2624 0.0004582 0.1746
100 0.2642 0.0006557 0.2481
120 0.2631 0.0007106 0.2699
Accuracy
The accuracy of an analytical procedure expresses the closeness of agreement between the
value which is accepted either as a conventional true value or an accepted reference value and
the value found. The accuracy of the method was determined by performing recovery studies
at three different levels of standard additions. Accuracy was checked by adding 80, 100 and
120% amount of Valsartan to pre-analyzed sample. Result are shown in Table 2.
Table 2: Accuracy Study.
Recovery Conc. of Sample Recovery in (μg/ml) % Recovery
80% 8 8.11 99.91
100% 10 10.07 99.84
120% 12 11.97 99.96
LOD and LOQ
The limit of detection (LOD) and limit of quantification (LOQ) of the drug were separately
determined based on method of the intercept and the average value of slope. (i.e. 3.3 for LOD
and 10 for LOQ) ratio using the following equations designated by ICH guideline.
LOD = 3.3 σ/S LOQ = 10 σ /S.
Where, σ = the standard deviation of the response, S = slope of the calibration curve.
Table 3:
LOD (μg/ml) LOQ (μg/ml)
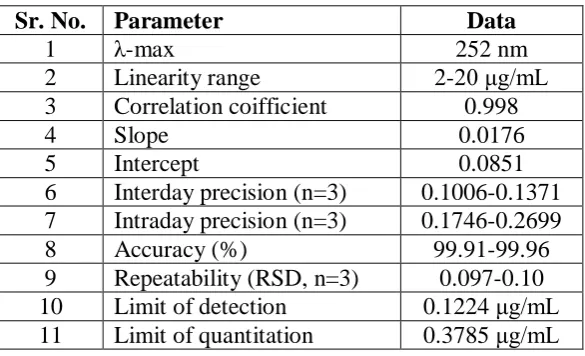
Table 4: Summary of Validation Parameters.
Sr. No. Parameter Data
1 λ-max 252 nm
2 Linearity range 2-20 μg/mL
3 Correlation coifficient 0.998
4 Slope 0.0176
5 Intercept 0.0851
6 Interday precision (n=3) 0.1006-0.1371 7 Intraday precision (n=3) 0.1746-0.2699
8 Accuracy (%) 99.91-99.96
9 Repeatability (RSD, n=3) 0.097-0.10 10 Limit of detection 0.1224 μg/mL 11 Limit of quantitation 0.3785 μg/mL
RESULTS AND DISCUSSION
Beer’s law is obeyed over the concentration range of 2-20 μg/ml, using regression analysis
the linear equation y = 0.0176x + 0.0851 with a correlation coefficient of 0.998. The limit of
detection was found to be 0.1224 μg/mL. The limit of quantification was found to be 0.3785
μg/ml. Precision was calculated with intra and interday variation. Recovery study was
performed on formulations and % RSD was found. The optical parameters such as Beer’s law
limit, slope, and intercept values were calculated and given in table 3. Method was validated
for accuracy and precision. The accuracy of method was proved by performing recovery
studies in prepared formulation. The results were given in table 2 and shows relative standard
deviation was observed for analysis of three replicate samples, indicating precision and
reproducibility.
CONCLUSION
The organic solvents such as ethanol, methanol, acetonitrile used widely in
spectrophotometric analysis of poorly water soluble drugs are toxic in nature, costlier and
responsible for pollution. Inaccuracy in spectrophotometric analysis due to volatility of
organic solvents is another drawback. These problems are maximum minimized by
development of UV method with phosphate buffer. It has UV cut off value 252 nm, since it
do not interfere above 252 nm. The results concluded that the developed spectrophotometric
method for determination of Valsartan in bulk and formulations using phosphate buffer PH 7.4 is reliable, accurate, precise, sensitive and ecofriendly. This method can be successfully
REFERENCES
1. Q2A: Text on; Validation of Analytical Procedures. In International Conference on
Harmonization. Federal Register, 1995; 60(40): 11260–11262.
2. Q2B: Validation of Analytical Procedures: Methodology, Availability. In International
Conference on Harmonization. Federal Register, 1997; 62(96): 27463–27467.
3. Goodmanand Gilman’s The pharmacological basis of therapeutics. 10th ed. New-york; McGraw Hill medical publishing division.
4. Daneshtalab N, Lewanczuk Rz and Jamali F. High performance liquid chromatographic
analysis of Angiotensin II receptor antagonist valsartan using liquid extraction method. J
Chromatography B Analyst Technol Biomed Life Sci., 2002; 766: 345-359.
5. Hillaert S and Bossche VW. Simultaneous determination of hydrochlorothiazideand
several angiotensin II receptor antagonists by capillary electrophoresis. J Pharm.
6. Ananda Kumarand Jayamariappan M. Int J Pharm Pharm Sci, 3(1): 23-27.
7. Mrunalini Madhusudhan Deshpande et al. Journal of Pharmacy Research, 2011; 4(3):