Original citation:
Azmat, F., Chen, Yunfei and Stocks, N. G.. (2015) Analysis of spectrum occupancy using machine learning algorithms. IEEE Transactions on Vehicular Technology.
Permanent WRAP url:
http://wrap.warwick.ac.uk/76672
Copyright and reuse:
The Warwick Research Archive Portal (WRAP) makes this work by researchers of the University of Warwick available open access under the following conditions. Copyright © and all moral rights to the version of the paper presented here belong to the individual author(s) and/or other copyright owners. To the extent reasonable and practicable the material made available in WRAP has been checked for eligibility before being made available.
Copies of full items can be used for personal research or study, educational, or not-for profit purposes without prior permission or charge. Provided that the authors, title and full bibliographic details are credited, a hyperlink and/or URL is given for the original metadata page and the content is not changed in any way.
Publisher’s statement:
“© 2015 IEEE. Personal use of this material is permitted. Permission from IEEE must be obtained for all other uses, in any current or future media, including reprinting
/republishing this material for advertising or promotional purposes, creating new collective works, for resale or redistribution to servers or lists, or reuse of any copyrighted component of this work in other works.”
A note on versions:
The version presented here may differ from the published version or, version of record, if you wish to cite this item you are advised to consult the publisher’s version. Please see the ‘permanent WRAP url’ above for details on accessing the published version and note that access may require a subscription.
Analysis of Spectrum Occupancy Using
Machine Learning Algorithms
Freeha Azmat, Yunfei Chen, Senior Member, IEEE, and Nigel Stocks
Abstract
In this paper, we analyze the spectrum occupancy in cognitive radio network (CRN) using different
machine learning techniques. Both supervised techniques (naive Bayesian classifier (NBC), decision
trees (DT), support vector machine (SVM), linear regression (LR)) and unsupervised algorithm (hidden
markov model (HMM)) are studied to find the best technique with the highest classification accuracy
(CA). A detailed comparison of the supervised and unsupervised algorithms in terms of the
computa-tional time and classification accuracy is performed. The classified occupancy status is further utilized to
evaluate the blocking probability of secondary user for future time slots, which can be used by system
designers to define spectrum allocation and spectrum sharing policies. Numerical results show that SVM
is the best algorithm among all the supervised and unsupervised classifiers. Based on this, we proposed
a new SVM algorithm by combining it with fire fly algorithm (FFA), which is shown to outperform all
other algorithms.
Index Terms
I. INTRODUCTION
A cognitive radio network (CRN) is composed of two types of users, namely, the licensed
primary users (PU’s) and the unlicensed secondary users (SU’s). The core idea behind CRN
is to allow unlicensed user’s access to the licensed bands in an opportunistic manner to avoid
interference with the licensed users. To achieve this, a realistic understanding of the dynamic
usage of the spectrum is required. The spectrum measurement is an important step towards
the realistic understanding of the dynamic spectrum usage. Various spectrum measurement
campaigns covering a wide range of frequencies have been performed [1]. These spectrum
measurement studies have found significant amount of unused frequency bands in the case of
normal usage due to the static spectrum regulations. This has led researchers to understand the
spectrum occupancy characteristics in depth for exploiting the free spectrum.
A. Problem definition
Many studies have been performed to understand the occupancy statistics. For instance, the
statistical and spectral occupation analysis of the measurements was presented in [2] in order to
study the traffic density in all frequency bands. In [3], auto-regressive model was used to predict
the radio resource availability using occupancy measurements in order to achieve uninterrupted
transmission of secondary users. In [4], the occupancy statistics were utilized to select the best
channels for control and data transmission purposes, so that less time is required for switching
transmission from one channel to the other in the case when the PU appears. Further, in [5],
[6], the bandwidth efficiency was maximized by controlling the transmission power of cognitive
radio using spectrum occupancy measurements.
In [7], different time series models were used to categorize specific occupancy patterns in the
spectrum measurements. In [8], a novel time-varying statistical model for spectrum occupancy is
proposed that uses real time wireless frequency measurements for predicting the arrival rate of
PUs in each frequency bin by assuming the Poisson distribution on the arrival rates of PUs and
the spectrum occupancy models by using conventional probabilistic or statistical tools. These
tools are often limited due to assumptions required to derive their theories. For example, one
has to determine whether the value is a random variable or a random process in order to use the
probabilistic and statistical tools. On the other hand, machine learning (ML) is a very powerful
tool that has received increasing attention recently [9]. The machine learning algorithms are often
heuristic, as they don’t have any prerequisites or assumptions on data. As a result, in many cases,
they provide higher accuracy than conventional probabilistic and statistical tools. There are very
few works on the use of ML in spectrum occupancy. The ML works related to cognitive radio
(CR) in [10]- [24] discussed cooperative spectrum sensing and spectrum occupancy variation.
However, in this paper, we aim to provide a comprehensive investigation on the use of ML for
analyzing spectrum occupancy. The motivation is that different ML algorithms are often suitable
for different types of data. Thus, one needs to try different ML algorithms in order to find the
one that suits the spectrum data best, not just one ML algorithm.
B. Contributions
The contributions of this work can be listed as follows:
1. We propose the use of ML algorithms in spectrum occupancy study. Both supervised and
unsupervised algorithms are used. In [10] and [11], ML was used for cooperative spectrum
sensing. However we use ML for spectrum occupancy modelling that may be used in all CR
operations, including spectrum management, spectrum decision and spectrum sensing. In [12],
authors have discussed call-based modelling for analyzing the spectrum usage of the dataset
collected from the cellular network operator. However, we use ML to model spectrum occupancy
in time slots for all important bands.
2. We have utilized four supervised algorithms, naive Bayesian classifier (NBC), decision trees
(DT), support vector machine (SVM), linear regression (LR), and one unsupervised algorithm,
hidden markov model (HMM), to classify the occupancy status of time slots. The classified
used to predict the channel status. Our supervised algorithms and modified HMM all perform
better than HMM. In [24], LR was used to investigate the spectrum occupancy variation in time
and frequency. Our approach outperforms LR as well.
3. We propose a new technique that combines SVM with fire fly algorithm (FFA) to
outper-forms all supervised and unsupervised algorithms.
The rest of the paper is organized as follows: Section II explains the system model, followed
by the detailed explanation of classifiers in Section III. The numerical results and discussion are
presented in Section IV.
II. SYSTEM MODEL
A. Measurement setup and data
We have measured the data from 880 MHz to 2500 MHz containing eight main radio frequency
bands for approximately four months (6th Feb-18th June 2013) at the University of Warwick
using radiometer. The eight bands are: 880-915 MHz, 925-960 MHz, 1900-1920 MHz, 1920-1980
MHz, 1710-1785 MHz, 1805-1880 MHz, 2110-2170 MHz and 2400-2500 MHz. The number
of the frequency bins in each band varies. For example, the band 925-960 MHz contains 192
frequency bins, each occupying a bandwidth of 0.18 MHz, while the band 1710-1785 MHz
contains 448 frequency bins, each occupying a bandwidth of 0.167 MHz. The data is arranged
in a two dimensional matrix (ti, fj) for each band; where each row ti represents the measured
data at different frequencies in one minute while each column fj represents the data at different
time instants of each frequency bin. As we have measured the data for four months which
constitute 131 days (188917 minutes), the numbers of rows are 188917 while the number of
columns varies according to the number of the frequency bins in a particular band.
B. SU Model
In a network of licensed users, SU is allowed to access the licensed band without causing
where i = 1,2, ..n, j = 1,2, ...k, n represents the total number of time slots and k represents
the total number of frequency bins. Using energy detection [15], if yi(j) is the sample sensed
at the ith time slot in the jth frequency bin. One has
yi(j) =xi(j) +wi(j) (1a)
or yi(j) = wi(j) (1b)
where xi(j) represents the received PU signal and wi(j) represents the additive white Gaussian
noise (AWGN) with zero mean and varianceσ2
w. Each sample is compared with a threshold (γ).
The selection ofγ is very important because small values ofγwill cause false alarms while large
values will miss spectrum opportunities. The computation of γ was explained in [16]. In our
approach, the threshold is dynamic and its selection is explained in Section IV-B. The spectrum
status is given as
Si(j) =
1, yi(j)> γ
0, yi(j)< γ.
(2)
The occupancy for the ith time slot is defined as
OCi =
Pk
j=1Si(j)
k . (3)
For example, a three-minute interval for the band 880 - 890 MHz having 9 frequency bins
as shown in Fig.1, where each bin occupies 1 MHz. For each frequency bin, Si(j) is decided.
Once Si(j) is evaluated, the occupancy OCi is calculated using (3). It is observed that more
frequency bins are occupied for the first minute than for the second and third minutes, so SU
has less chance to transmit in the first minute. Following the discussion above, we need to set
Fig. 1. Occupancy for different time slots in the band.
C. PU Model
As per our approach, the status of PU (Pi) for the ith time slot can be decided using the
following rules:
Pi =
1, OCi > U
oc (Condition1)
1, Loc <=OCi <=Uoc AN D coni < B (Condition2)
0, Loc <=OCi <=Uoc AN D coni >=B (Condition3)
0, OCi < L
oc (Condition4)
(4)
where Uoc and Loc represent the maximum and minimum values of occupancy for all n time
slots, coni represents the number of consecutive free frequency bins in the ith time slot and
B represents the maximum value of coni, when PU is considered present. Each condition is
explained as follows:
day and the threshold. Our test show thatUoc should not be less than 75%andLoc should not be
greater than 40%. For fixed frequency band and day, we have evaluatedUoc andLoc for different
thresholds in Section IV-B. In order to guarantee PU protection and ensure SU transmission,
when the values of OCi lie in the range between L
oc and Uoc, further criterion is applied.
2. Condition 2 and Condition 3: It is difficult to apply Condition 1 and Condition 4 when
Loc<=OCi <=Uoc, so we evaluateconi for each time slot. Ifconi > B forLoc <=OCi <=
Uoc , there exists at least B consecutive free frequency bins in the ith time slot; thus SU can
transmit and vice versa when coni > B. The value of B is selected to provide PU protection.
This will be explained in Section IV-B.
D. Machine Learning Framework for SU and PU Model
ML constructs a classifier to map Si to Pi, where Si = [Si(1), Si(2), ..Si(k)] represents the
feature vector and Pi is the corresponding response to the feature vector. There are two steps
for constructing a classifier:
1) Training: Let Sitrain = [Si(1)
train, Si(2)train..., Si(k)train]T denote the training spectrum
status and Pi
train represent the training PU status for the ith time slot, respectively, where i=
1,2, ..n1 and n1 represents the number of training time slots fed into the classifier.
2) Testing: Once the classifier is successfully trained, it is ready to receive the test vector for classification. LetSitest = [Si(1)
test, Si(2)test..., Si(k)test]T denote the testing spectrum status and
Ptesti represent the testing PU status for theithtime slot, respectively, wherei=n1+1, n1+2, ..n2
andn2 represents the length of testing sequence. It is assumed thatn=n1+n2. For our proposed
approach, the matrix of size n∗k is divided into 15% training data matrix of size n1 ∗k and
85% testing data matrix of size n2 ∗k. The value Ptesti is not used during the testing but as a
reference for computing the classification error.
3) Classification Accuracy (CA): Let Pevali denote the PU status determined by the classifier for the ith time slot. The classifier categorizes the testing vector Sitest as ’occupied class’ (i.e.,
when Pi
eval= Ptesti , giving CAi = 1. The misdetection occurs when Pevali = 0 and Ptesti = 1,
while false alarm occurs when Pi
eval = 1 and Ptesti = 0, both givingCAi = 0.
E. Blocking Probability
Let Pieval be a vector evaluated by each classifier, and Pi
eval represent the presence/ absence
of PU for the ith time slot. When Pi
eval = 0, SU is allowed to utilize the ith time slot. Define
outsu as the minimum value of consecutive free time slots required by SU for transmission. The
blocking probability measures the chance when SU cannot findoutsu consecutive free time slots
for transmission given as [17]:
P(SUblocking) = 1−P(SUtransmit) (5a)
where
P(SUtransmit) = C X
c=1
P(F Bc) (5b)
where F Bc is the block of free consecutive time slots of length outsu, c = {1,2, ..C} and C
represents the total number of free blocks in Pieval. The probability for a free block starting at
index, say r, in Pieval is evaluated using the following equation
P(F Bc) =
r+outsu
Y
i=r
OCi. (5c)
III. PROPOSED ALGORITHMS
In the proposed approach, five machine learning algorithms are utilized to predict the future
PU status using the occupancy data, which is a function of time, frequency and threshold.
Among them, four are supervised learning algorithms: NBC, DT, SVM and LR, while one is an
unsupervised algorithm, HMM. The motivation to use five different algorithms is to find the best
A. Naive Bayesian Classifier
A naive Bayesian classifier is a generative model based on the Bayes theorem. It is also called
’independent feature model’ because it does not take dependency of features into account. The
feature vector for theithtime slot in our model contains all the samples which are independent of
each other, since every feature represents a specific frequency bin. For example, the status vector
of the ith time slot is given as Si =Si(1), Si(2), Si(3), .., Si(k), where Si(1) is independent of
Si(2). However, the response variable in our approach i.e. PU status (Pi) is a dependent variable
which is affected by each frequency bin.
The probability of Si belonging to the classPi evaluated using the Bayes theorem is formally
defined as [18]
p(Pi,Si) =p(Pi)∗p(Si|Pi). (6)
When Pi = 0, Si
will be classified as ’idle’ class, while when Pi = 1, Si
will be classified
as ’occupied’ class. The goal is to find the class with the largest posterior probability in the
classification phase. The classification rule is given as
classif y( ˆSi) =argmaxSi{p(Pi,( ˆSi)} (7) where Sˆi = {Siˆ(1),Siˆ(2)...Siˆ(k)}. NBC is sensitive to the choice of kernel and the prior
probability distribution of classes. This will be explained in Section IV-B.
B. Decision Trees
Decision tree builds classification or regression models in the form of a tree structure. The
decision trees used in this approach are classification trees whose leaf represents the class labels.
Unlike NBC, it can handle feature interactions and dependencies. In DT, the decision is made
on each internal node, which is used as a basis for dividing the data into two subsets while leaf
nodes represent the class labels (in the case of classification trees) or the real numbers (in the
(Si, Pi) = (Si(1), Si(2), Si(3).., Si(k), Pi). (8)
where Pi is the dependent variable representing the class label of the ith time slot. The class
labels Pi are assigned by calculating the entropy of the feature, as [19]
Entropy(t) =− Z X
id=0
p(id|t)log2p(id|t). (9)
Where p(id|t) denote the fraction of records belonging to class id at a given node t and Z
represents the total number of classes. In our approach,Z = 1. The smaller entropy implies that
all records belong to the same class. It will be discussed in Section IV-C on how fraction of
records per node affects the classification accuracy of DT.
C. Support Vector Machines
SVM is a discriminative classifier with high accuracy. The phenomenon of over fitting1 often
happens in DT, however SVM tends to be resistant to over-fitting and can be used for online
learning 2. There are two types of classifiers in SVM: linear SVM for separable data 3 and
non-linear SVM for non-separable data . Linear SVM is used in our approach.
The training feature and response vectors in our system is represented asD= (Pi,Si
) where
Pi ∈ {0,1}. Following the definition of linear SVM, the two classes are separated by defining a
hyper plane H, represented as w.Si =ρ, where w represent the normal vector and ρ represents
the constant separating occupied and idle classes (Pi ∈ {0,1}) given as [22]:
Pi = +1 when w.Si > ρ (Occupied class) (10a)
1
It is a condition when the ML model fits the training set very well but fails to generalize to the unseen examples [20].
2
It is learning scenario in which training data is provided one example at a time, as opposed to the batch mode in which all
examples are available at once. [21].
3
Two sets of pointsAandB are linearly separable if there exists nreal numbersw1, w2, w3, .., wn, such that every point
ai∈AsatisfiesPni=1wi.ai> ρand every pointbi∈Bsatisfies
Pn
i=1wi.bi< ρ, whereρrepresents the constant separating
Pi = 0 when w.Si < ρ (Idle class) (10b)
Two margins are defined on both sides of H to maximize the gap between two classes. The
length of the margins is controlled by a parameter called box constraintBoxct. We will evaluate
the optimal value of Boxct using a bio-inspired technique i.e. FFA in our approach.
D. SVM with Fire Fly Algorithm
In FFA, let X be a group of fire flies, X = [l1, l2, ..lX], initially located at specific positions
aX = [al1, al2, ..alX]. Each fire fly moves and tries find a brighter fire fly, which has more light
intensity than its own. The objective function f(x) used for evaluating the brightness of the fire
fly in our approach is the classification accuracy i. e. f(x) = CA(aX). When a fire fly, say l1
finds another brighter fire fly l2 at another location having more intensity compared to its own,
it tends to move towards fire fly l2. The change in position is determined as [23]
av+1l1 =avl1 +β0e
−ψl1l2r
2
l1l2(av
l2 −a
v
l1) +α(rand−0.5) (11)
where v represents the number of iterations,al1 and al2 represents the position of fire fly l1 and
l2 respectively,α,β0 andψl1l2 are constants,randis a uniformly distributed random number and
rl1l2 represents the euclidean distance between l1 and l1. For our approach, the starting positions
of the X fire flies are initialized, while the position of each fire fly represents the value of box
constraints Boxct.
E. Linear Regression
The flexibility of linear regression to include mixture of various features in different dimensions
e. g. space, frequency, time and threshold as a linear combination is the main motivation of using
it for modeling in this approach. The linear regression model for our approach is given by [24]:
Pi =e0+e1Si(1) +e2Si(2) +...+ekSi(k) = e0+ k X
j=1
ejSi(j). (12)
where the class label Pi is represented as a linear combination of parameters e
1, e2, , ek and
approach. In each step, the optimal term based on the value of defined ’criterion’ is selected. The
’criterion’ can be set as the sum-of-squares error (SSE), deviance, akaike information criterion
(AIC), Bayesian information criterion (BIC) or R-squared etc. SSE is used in this approach.
It is observed from (12), that the computational time for evaluating the response of the model
linearly increases with the number of frequency bins/ predictors involved. So we need to select
an appropriate number of predictors for linear regression.
F. Hidden Markov Models
It is an unsupervised algorithm for modeling the time series data. The motivation to use the
unsupervised algorithm is that it does not need the training phase. In HMM, the sequence of
states can be recovered by an analysis of the sequence of observations. The set of states and
observations are represented by U and G given as, U = (u1, u2, ...uN), G = (g1, g2, ...gM),
where u1 and u2 represent the states when Pi = 0 and Pi = 1, respectively. The observations
g1 and g2 represent the value of OCi corresponding to each Pi. HMM is defined as
λ= (Ch, Dh, π) (13)
where the transition array Ch is the probability of switching from state u1 to state u2 given as
[25], Ch = [c12] = P(qt = u2|qt−1 = u1). The Dh is the probability of observation g1 being
produced from state, Dh = [d1,2] = P(ot = g1,2|qt = u2) and π is the initial probability array,
π =P(q1 =u2).
HMM has two main steps. In the first step, the sequence of observations O = (o1, o2, ...oT),
transition probability matrixChand emission probability matrixDh are utilized to find the
proba-bility of observationsOgiven hmm modelλusing ( [25], Eq.13) as,P(O|λ) =P
QP(O|Q, λ)P(Q|λ),
where Q = (q1, q2, ...qT) and P(O|Q, λ) = QT
t=1P(ot|qt, λ) = gq1(o1)∗gq2(o2)..gqT(oT). The
probability of the state sequence is given asP(Q|λ) =πq1cq1q2cq2q3...cqT−1qT. In the second step,
the hidden state sequence, that is most likely to have produced an observation is decoded using
is matched with the expected fixed state sequence Q to compute classification accuracy. HMM
can be also be supervised by adding two extra steps as
Step(a): Use the initial guesses ofCh andDh to compute Q andO, that are used for computing
P(O|λ) in forward algorithm
Step(b): Use O, Dh and Ch in Step(a) to estimate the transition probability matrix Ch′ and
emission probability matrix Dh′ using maximum likelihood estimation [26].
The Ch′ and Dh′ collectively form the estimated HMM model (λe) that can be further used for
evaluating P(O|λ) and QL using the forward algorithm and the Viterbi algorithm respectively.
IV. NUMERICAL RESULTS ANDDISCUSSION
In order to analyze the occupancy of the eight bands, the statistics of data in all bands from 880
to 2500 MHz are presented in Section IV-A. The classification criteria are explained in Section
IV-B. The selection of the best parameters for each model using the classification criteria are
discussed in Section IV-C. The classification models with the optimal parameters are compared
to find the best classifier in terms of the CA, defined as CA= No. of correct classfications Total number of test samples
A. Statistics of Data
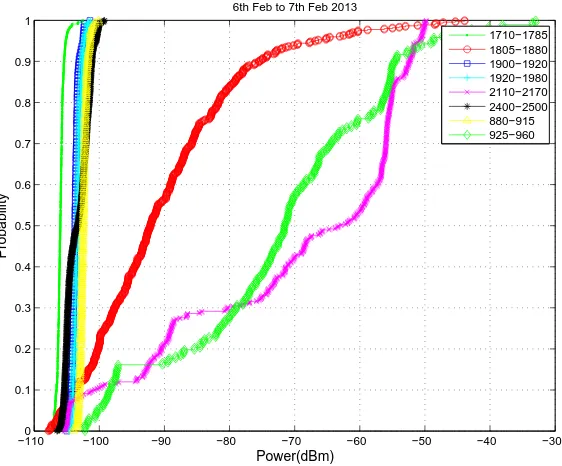
The CDF plot is shown in Fig.2 which gives the summarized view of all power ranges for
the eight bands. It can be observed from Fig.2 that the eight bands can be categorized into two
main groups. Group A includes 925 - 960 MHz, 1805 - 1800 MHz and 2110 - 2170 MHz while
Group B has five bands: 880 - 915 MHz, 1710 - 1785 MHz, 1900 - 1920 MHz, 1920 - 1980
MHz and 2400 - 2500 MHz. Group A and Group B are different given as:
1) Average Power: Group A bands have higher value of the average power than Group B bands. The results are shown in Table I.
2) Standard Deviation (σ): We evaluated the maximum standard deviation in frequency bins (σj) and time slots (σi) over the period of four months using k frequency bins. It is observed
that Group A bands have higher values of bothσi and σj compared to Group B bands as shown
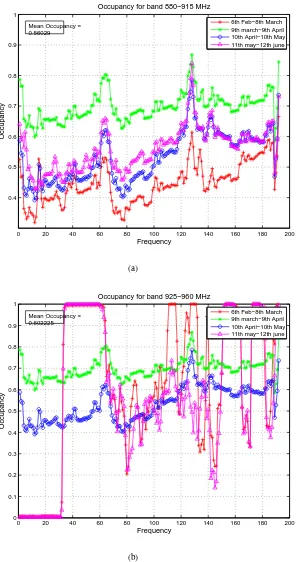
3) Periodicity: Due to stochastic noise and non-linearities, it is impossible to find the pure periodic and stationary signal in real time. However we found reasonably periodic structures in
some bands by computing the relationship between occupancy and frequency, given as (OCj =
Pn i=1Si(j)
n ). We found that Group B bands can be classified as periodic bands while Group A
bands do not have this property. One band from each group is shown in Fig.3.
The periodicity may be caused by the usage pattern. For instance, the periodicity in each band
lies in their uplink/ downlink usage pattern. For instance, the band 1710-1785 MHz is an uplink
band, while the aperiodic band 1805-1880 MHz is the downlink. The uplink transmits data from
the mobile user to base station so that its activity is completely determined by mobile users’s
periodic usage pattern. On the other hand, the downlink transmits the data from base station to
the mobile user so that its activity is also affected by control and broadcast channels, making it
less or non periodic.
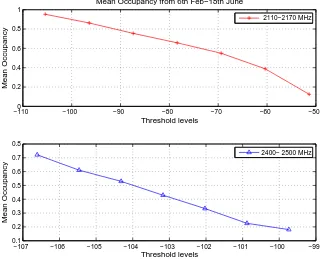
We found that OCi and OCj for both groups share similar trend, where OCj is greater than
OCi for all bands. The threshold selection is an important task for analyzing bothOCj andOCi.
Therefore, we took the minimum and the maximum value of power for each frequency band and
tested seven values of thresholds in this range. Each band is analyzed separately for the seven
values of the threshold using the four months data. It is observed for all bands that occupancy
monotonically decreases when the value of threshold increases. These results have proved that
larger value of threshold will classify less samples as occupied. The effect of different threshold
levels on mean occupancy for one band from each group is shown in in Fig.4.
B. Classification Criteria
This subsection studies the choice of Uoc, Loc, coni and B in Section II-C as shown in Fig
5. We have utilized Day1 (1-1440 min), Day 2 (1441-2448 min) and Day 5 (7200-8640 min)
in Band 880-915 MHz, and four different values of threshold: γ = [−102,−104,−106,−108]
dBm. The parameters Uoc and Loc will be selected by Ms, which represents the occupancy
TABLE I
STATISTICS OFFREQUENCYBANDS
Group Band Frequency Bins (k) Mean Power (dBm) σj σi OCi
(%) OCj
(%) Periodicity
A
925-960 MHz 192 -75.07 23.43 24.93 45.8 65.8 x
1805-1880 MHz 448 -89.9338 21.054 23.64 32.45 86.21 x
2110-2170 MHz 384 -71.1649 23.66 12.097 53.90 59.41 x
B
880-915 MHz 192 -101.0693 16.67 6.2322 57.06 79.1 X
1710-1785 MHz 448 -106.0201 9.2423 4.8510 57.71 66.52 X
1900-1920 MHz 128 -103.8796 6.4199 4.0611 62.25 75.17 X
1920-1980 MHz 384 -103.7396 15.58 4.18 61.48 72.12 X
2400 -2500 MHz 640 -103.5026 16.8873 7.9524 31.17 36.02 X
size of 0.1. It is observed in Fig.5 that the value of CA depends on day and the value of
threshold. The actual value of OCtraini in (3) always lies in a certain range, [Ls, Us], where Ls
represents the lowest value of OCtraini and Us represents the maximum value of OCtraini . When
Ls <=Ms <=Us, two groups of classes Pi = 0 (available class) and Pi = 1 (occupied class)
can be classified correctly. When Ms> Us or Ms< Ls, all the samples will be classified as one
class because OCi
train is a closed set whose values do not lie outside the range [Ls, Us]. This
explains why the CA = 1 for [Loc, Uoc] = [0.1,0.2] and [Loc, Uoc] = [0.75,0.9] while CA < 1
for [Loc, Uoc] = [0.2,0.75] for Day 1 using γ =−102 dBm. Thus, the classification cannot be
performed whenMs> Us orMs < Ls. The optimal range is[Loc, Uoc] = [0.2,0.75] forCA <1.
However, for CA < 1, there are four different choices of threshold available. In our proposed
approach, we choose that specific value of threshold that contains the largest number of values
betweenLoc andUoc. Following this, we have selectedγ =−102 dBm for Day1, Day2 and Day5
as the optimal threshold which ensures the largest amount of samples betweenLoc and Uoc. The
[Loc, Uoc] = [0.2,0.75] for Day 1, [Loc, Uoc] = [0.4,0.85] for Day2 and [Loc, Uoc] = [0.2,0.80]
each day.
C. Model Performance Comparison
Following the discussion above, we have compared the performance of the algorithms in this
section using 1 month data of Band 880-915 MHz. Our tests show that the number of minimum
observations/node for DT can be seclected as 17, number of predictors for LR as 15, normal
kernel for NBC and linear kernel for SVM. The optimal splitting range, optimal threshold and
B will be selected corresponding to the data of each day.
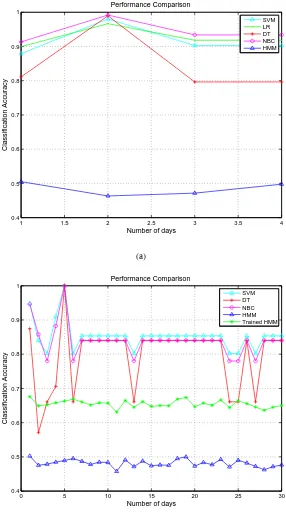
1) Supervised VS Unsupervised Algorithms using k= 55: In Fig. 6(a), it is observed that the mean CA attained by LR, SVM, DT, NBC and HMM is 0.9257, 0.9162, 0.8483, 0.9493 and
0.4790 respectively. The mean computation time in each iteration by LR, SVM, DT, NBC and
HMM is 350.19, 0.092, 0.0136, 0.0045, and 0.0171 seconds, respectively. Thus, NBC is the best
considering the accuracy and complexity.
2) Supervised vs Unsupervised Algorithms using K = 192 : We have compared HMM, Trained HMM, SVM, DT and NBC in Fig.6(b) for 30 days. Each iteration represents 1 day.
LR is not shown as it takes an excessively long time in this case. It is observed that trained
HMM performed better than HMM, but worst than DT, NBC and SVM. The mean CA attained
by Trained HMM, HMM, SVM, DT and NBC is 0.6816, 0.4887, 0.8528, 0.8392, 0.7970 while
the computational time for each iteration of Trained HMM, HMM, SVM, DT and NBC 0.0205,
0.09066, 0.0135, 0.0163, 0.0095 seconds, respectively. Thus, SVM is the best in this case with
highest CA and shortest time.
3) SVM with Fire Fly Algorithm : So far, the best overall performance is attained by the linear SVM technique. The performance of linear SVM is affected by the value of Boxct as
illustrated in Section IV-C. The fire fly algorithm can be used to select the best value of Boxct.
We set α = 1, β0 = 2 and ψl1l2 = 1.3 for FFA. Fig. 7(a) depicts that ’SVM+FFA’ performs
better than the conventional SVM in most of the cases. The mean CA attained by SVM+FFA,
4) Comparison with Statistical/ Probabilistic Model: We compare the proposed ML classifi-cation framework with the model in [8]. The inputs of this model are the statistical parameters
extracted from real time measurements. The outputs obtained from this model are the
transmis-sion timestON andtOF F, wheretON andtOF F represents the busy and idle duration respectively.
Based on tON and tOF F, the model predicts the PUs occupancy for the testing data matrix.
Following [8], we have predicted the PU occupancy of the testing data matrix using data of
one day and k = 192 frequency bins of Band 880-915 MHz. In order to compare the statistical
model with our approach, we have transformed the (OCi) evaluated using the statistical model
to PU status labels (Pi), following the criteria explained in Section II-C. This is because, the
validation in our approach is performed using CA, where Pi
eval is checked against the value of
Pi
test. It was observed in Fig. 7(a), that ML algorithms have attained higher value of CA than
statistical model. The mean CA for the statistical model is only 0.45, much lower than average
value of CA attained by DT, NBC, SVM and SVM +FFA.
5) Blocking Probability: This probability is computed using SVM+FFA, SVM, DT, NBC, HMM and the statistical model [8]. It is further compared with the expected P(SUblocking) to
compute the difference between evaluated and expected values. It is evident in Fig. 7(b), that
SVM+FFA has predicted the P(SUblocking) with minimum difference and is very close to the
expected one. The expected blocking probability is 0.9191 in Fig. 7(b) while the predicted
P(SUblocking)using SVM+FFA, SVM, NBC, DT, HMM and statistical model is 0.9264, 0.9322,
0.9638, 0.9577, 1 and 1, respectively. The P(SUblocking) for HMM and statistical model is
always 1, which implies that both HMM and statistical model have failed to find any block of
consecutive free time slot of length outsu.
6) Supervised vs Unsupervised Algorithms using different Training/ Testing Data vectors: We have presented the detailed comparison of supervised and unsupervised algorithms using different
sizes of training and testing data in Table II. The classification accuracy and computation time for
all supervised algorithms increases with an increase in the size of the training data. SVM+FFA
TABLE II
PERFORMANCECOMPARISON OFFIVEMLALGORITHMS USING DIFFERENT SIZES OFTRAINING/ TESTING DATA.
Performance Comparison
Training data, Testing data Technique Mean CA Mean Computational Time (s)
15%, 85%
Decision Trees 0.7612 0.0132
Support Vector Machine (SVM) 0.8945 0.0128
SVM + Fire Fly Algorithm 0.9034 3.0412
Hidden Markov Model 0.4925 0.0241
Naive Bayesian 0.8714 0.0084
30%, 70%
Decision Trees 0.8028 0.0198
Support Vector Machine (SVM) 0.9143 0.0153
SVM + Fire Fly Algorithm 0.9189 3.8947
Hidden Markov Model 0.4841 0.0191
Naive Bayesian 0.9064 0.0098
REFERENCES
[1] Y. Chen, H-S. Oh, ”A survey of measurement-based spectrum occupancy modelling for cognitive radios”, IEEE
Communications Surveys and Tutorials, vol. PP, no. 99, pp. 1, Oct 2014.
[2] V. Blaschke, H. Jaekel, T. Renk, C. Kloeck, F. K. Jondral, ”Occupation measurements supporting dynamic spectrum
allocation for cognitive radio design”,Proc. CrownCom’07, pp. 50-57, Orlando, Florida, Aug. 2007.
[3] S. Kaneko, S. Nomoto, T. Ueda, S. Nomura and K. Takeuchi, ”Predicting radio resource availability in cognitive radio
-an experimental examination”,Proc. CrownCom’08, Singapore, May. 2008.
[4] M. Hoyhtya, S. Pollin, A. Mammela, ”Classification - based predictive channel selection for cognitive radios”, Proc.
ICC’10, pp. 1 - 6, Cape town, South Africa, May. 2010.
[5] X. Zhou, J. Ma, Y. Li, Y. H. Kwon, A. C. K. Soong, G. Zhao, ”Probability-based transmit power control for dynamic
spectrum access”,Proc. DySPAN’08, pp. 1-5, Chicago, USA, Oct. 2008.
[6] X. Zhou, J. Ma, Y. Li, Y. H. Kwon, A. C. K. Soong, ”Probability-based optimization of inter-sensing duration and power
control in cognitive radio”,IEEE Transactions on Wireless Communications, vol. 8, pp. 4922 - 4927, Oct. 2009.
[7] Z. Wang, S. Salous, ”Spectrum occupancy statistics and time series models for cognitive radio”, Journal of Signal
Processing Systems, vol. 62, Feb. 2011.
[8] Ghosh, S. Pagadarai, D. P. Agrawal, A. M. Wyglinski, ”A framework for statistical wireless spectrum occupancy modeling”,
[9] C. Rudin, K. L. Wagstaff, ”Machine learning for science and society”, Springer Journal on Machine Learning, vol. 95,
no. 1, pp. 1-9, Nov 2013.
[10] K. W. Choi, E. Hossain, D. I. Kin, ”Cooperative spectrum sensing under a random geometric primary user network model”,
IEEE Transaction on Wireless Communications, vol. 10, no. 6, June 2011.
[11] K. M. Thilina, K. W. Choi, N. Saquib, and E. Hossain, ”Machine learning techniques for cooperative spectrum sensing
in cognitive radio networks”,IEEE Journal on Selected Areas in Communications, vol. 31 , no. 11, pp. 2209 -2221, Nov
2013.
[12] D. Willkomm, S. Machiraju, J. Bolot, A. Wolisz, ”Primary users in cellular networks: A large-scale measurement study”,
Proc. DySPAN’ 08, pp. 1-11, 2008.
[13] V. K. Tumuluru, P. Wang, D. Niyato, ”Channel status prediction for cognitive radio networks”, Wiley Wireless
Communications and Mobile Computing, vol. 12, no. 10, pp. 862-874, July 2012.
[14] S. Pagadarai and A. M. Wyglinski, ”A linear mixed-effects model of wireless spectrum occupancy”,EURASIP Journal on
Wireless Communications and Networking, vol. 2010, no. 203178, Aug. 2010.
[15] Z. Xuping, P. Jianguo, ”Energy-detection based spectrum sensing for cognitive radio”,Proc. CCWMSN’ 07, pp. 944 -947,
Dec. 2007
[16] A. J. Petain, ”Maximizing the utility of radio spectrum: broadband spectrum measurements and occupancy model for use
by cognitive radio”,Ph.D. dissertation, Georgia Institute of Technology, Atlanta, GA, USA, 2005.
[17] M. Zhang, B. Li, S. Jiang, ”Call blocking probabaility and packet delay in cognitive radio networks” ,Proc. WiCOM’ 12,
Sept 2012.
[18] A. Y. N, M. I. Jordan, ”On discriminative vs generative classifiers: A comparison of logistic regression and Nave Bayes”,
Advances in Neural Information Processing Systems, pp. 841-848, 2002.
[19] L. Rokach, O. Maimon, ”Decision Trees”,Data Mining and Knowledge Discovery Handbook, Springer Publisher, 2nd ed,
1285, 2010.
[20] P. Flach, ”Machine Learning: The Art and Science of Algorithms that make sense of data”, Cambridge university press,
Sept 2012.
[21] P. Laskov, C. Gehl, S. Kruger, K.R. Muller, ”Incremental support vector learning: analysis, implementation and applicatins”,
vol. 7, pp. 1909-1936, 2006.
[22] A. b. Hur, J. Weston, ”A user’s guide to support vector machines”,Data Mining Techniques for the Life Sciences Methods
in Molecular Biology, vol. 609, pp. 223-239, 2010.
[23] X. Yang, ”Firefly algorithms for multimodal optimization”,LNCS 5792, vol. 5792, pp. 169-178, 2009.
[24] S. Chatterjee, A. S. Hadi, ”Simple linear regression”,Regression Analysis by Example, Fourth Edition, 2006 John Wiley
and Sons.
[25] G. A. Fink, ”Markov Models for pattern Recognition: From theory to Application”,Springer Advances in Computer Vision
−1100 −100 −90 −80 −70 −60 −50 −40 −30 0.1
0.2 0.3 0.4 0.5 0.6 0.7 0.8 0.9 1
Power(dBm)
Probability
6th Feb to 7th Feb 2013
[image:21.595.167.448.129.362.2]1710−1785 1805−1880 1900−1920 1920−1980 2110−2170 2400−2500 880−915 925−960
Fig. 2. The CDFs for the eight bands between 880-2500 MHz.
[26] D. Garrette, J. Baldridge, ”Type-supervised hidden Markov models for part-of-speech tagging with incomplete tag
0 20 40 60 80 100 120 140 160 180 200 0.4
0.5 0.6 0.7 0.8 0.9 1
Frequency
Occupancy
Occupancy for band 880−915 MHz
6th Feb−8th March 9th march−9th April 10th April−10th May 11th may−12th june Mean Occupancy =
0.56029
(a)
0 20 40 60 80 100 120 140 160 180 200
0 0.1 0.2 0.3 0.4 0.5 0.6 0.7 0.8 0.9 1
Frequency
Occupancy
Occupancy for band 925−960 MHz
6th Feb−8th March 9th march−9th April 10th April−10th May 11th may−12th june Mean Occupancy =
0.602225
[image:22.595.171.467.149.711.2](b)
−1100 −100 −90 −80 −70 −60 −50 0.2
0.4 0.6 0.8 1
Threshold levels
Mean Occupancy
Mean Occupancy from 6th Feb−18th June
2110−2170 MHz
−107 −106 −105 −104 −103 −102 −101 −100 −99
0.1 0.2 0.3 0.4 0.5 0.6 0.7 0.8
Threshold levels
Mean Occupancy
[image:23.595.146.467.284.543.2]2400− 2500 MHz
Fig. 4. Effect of different threshold levels on mean occupancy for a (a) Aperiodic band (2110-2170 MHz) (b) Periodic band
0.1 0.2 0.3 0.4 0.5 0.6 0.7 0.8 0.9 0.4
0.6 0.8 1
M
s
Classification Accuracy
Day 1 Data
Threhold (−102) Threhold (−104) Threhold (−106) Threhold (−108)
0.1 0.2 0.3 0.4 0.5 0.6 0.7 0.8 0.9
0 0.5 1
M
s
Classification Accuracy
Day 2 Data
Threhold (−102) Threhold (−104) Threhold (−106) Threhold (−108)
0.1 0.2 0.3 0.4 0.5 0.6 0.7 0.8 0.9
0.7 0.8 0.9 1
M
s
Classification Accuracy
Day 5 Data
[image:24.595.76.573.203.604.2]Threhold (−102) Threhold (−104) Threhold (−106) Threhold (−108)
1 1.5 2 2.5 3 3.5 4 0.4
0.5 0.6 0.7 0.8 0.9 1
Number of days
Classification Accuracy
Performance Comparison
SVM LR DT NBC HMM
(a)
0 5 10 15 20 25 30
0.4 0.5 0.6 0.7 0.8 0.9 1
Number of days
Classification Accuracy
Performance Comparison
SVM DT NBC HMM Trained HMM
[image:25.595.163.449.152.676.2](b)
0 5 10 15 20 25 30 0 0.1 0.2 0.3 0.4 0.5 0.6 0.7 0.8 0.9 1
Number of days
Classification Accuracy Performance Comparison SVM+FFA SVM DT NBC HMM Model[8] (a)
0 5 10 15 20 25 30
0.82 0.84 0.86 0.88 0.9 0.92 0.94 0.96 0.98 1
Number of days
P(SU blocking ) Blocking Probabaility SVM+FFA SVM DT NBC HMM Model[8] Actual P(SU blocking) (b)
Fig. 7. (a) Performance comparison of ML algorithms: SVM, DT, NBC, HMM, ’SVM+FFA’ and statistical model [8] using
k = 192for 30 days. (b) Comparison of ’Actual P(SUblocking)’ with theP(SUblocking) evaluated using SVM, DT, NBC,
[image:26.595.164.450.145.675.2]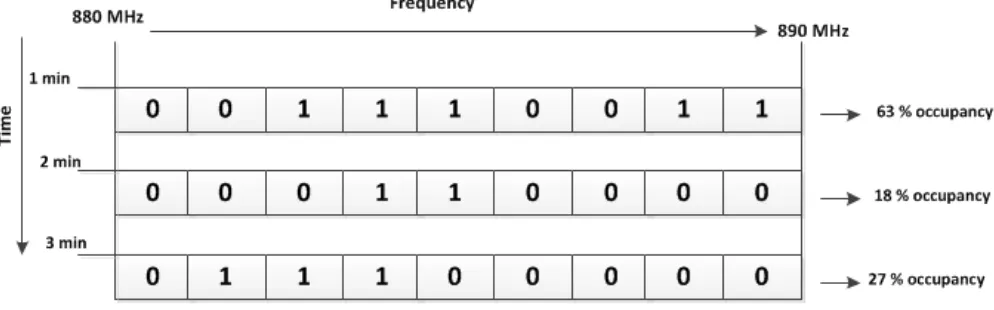
![Fig. 5. Selection of optimal threshold (γ) and optimal splitting range ([Uoc, Loc]) for determining the classification criteria of](https://thumb-us.123doks.com/thumbv2/123dok_us/9464748.452970/24.595.76.573.203.604/selection-optimal-threshold-optimal-splitting-determining-classication-criteria.webp)
![Fig. 7. (a) Performance comparison of ML algorithms: SVM, DT, NBC, HMM, ’SVM+FFA’ and statistical model [8] using](https://thumb-us.123doks.com/thumbv2/123dok_us/9464748.452970/26.595.164.450.145.675/fig-performance-comparison-algorithms-svm-statistical-model-using.webp)
