ISSN: 1682-3915
© Medwell Journals, 2019
Improving MapReduce Based k-Means Algorithm using Intelligent Technique
1
Hany H. Hussien,
2Omar M. Elssayad and
2Adel A. El-Zoghabi
1Department of Information Systems,
Higher Institute of Management Science and Advanced Computing,
El-Beheira Governorate, Egypt
2
Department of Information Technology, Institute of Graduate Studies and Research,
Alexandria University, Alexandria, Egypt
Abstract: Data has expanded exponentially in recent years, leading to a search for ways of how to take advantage of these data, leading to the rise of big data science. The currently used data analysis techniques are not successful for different properties such as volume, velocity and variety, so, they are required to invent a new artificial intelligence technique. k-Means is one of the popular algorithms used to cluster large amounts of data and the problem with a k-Means is to pick the initial center for each unit which involves an optimization approach to solve the weak point such a Genetic algorithm which provides optimum performance in search algorithms that can be used to look for the initial point of each cluster rather than random selection of the initial centre. Big data involves many techniques, the most popular of which is the MapReduce which used to manage very large data. The proposed model is a Gk-Means based on the feature selection method parallel to MapReduce applying a Genetic algorithm to k-Means on selected data.
Key words: Big data, clustering, k-Means algorithm, MapReduce, data mining, feature selection
INTRODUCTION
There is an increase in the use of applications that lead to widespread data growth and makes storing and handling difficult. On the other hand, business organizations and most researchers realized the importance of data analysis for the exploration of information, conventional data analysis approaches were inadequate and creative technology needed to make the data meaningful. Furthermore, structured data and unstructured data cannot be stored as relational databases in regular data stores, all of which resulted in the advent of big data science referring to the massiveness and variety of data required for high machine learning, data mining and distributed storage system capabilities (Naganathan, 2018; Rao and Rambabu, 2016).
With the emergence of multi-dimensional and multiple data sources, feature selection algorithms have been developed to minimize dimensionality and reprocess data by removing unnecessary data fields before any algorithm is implemented to improve the performance and complexity of the algorithm (Kashef et al., 2018).
Clustering is an important field in data mining and is used in many areas such as data analysis, business intelligence, security, etc. The cluster analysis concept is the method of separating information into groups with symmetrical characteristics (Khairnar and Patil, 2016).
k-Means algorithm is a clustering technique that solves clustering problems and the simplest unsupervised learning algorithms used in big data clustering. Yet conventional k-Means are inefficient while being applied on large datasets due to excessive implementation time and inability to deliver accurate results (Hossain and Akhtar, 2019).
The main problem in a k-Means is the choice of a center point for each cluster and it became necessary to find the best centroid to improve performance and refine the algorithm (Godara and Sharma, 2019).
The Genetic algorithm is one of the artificial intelligence methodologies and the best search technique based on the concept of genetics and natural selection when combined with the k-Means algorithm the problem of selecting the initial random center is tackled by intelligent search of the initial center and obtaining an updated k-Means algorithm that works as an improved way (Zeebaree et al., 2017).
MapReduce is a programming framework used to measure large data and deals with terabytes up to petabytes of data on interconnected structures such as clusters or nodes, designed to handle large volumes of data in a distributed and parallel manner (Khezr and Navimipour, 2017). MapReduce included Map and Reduce method, the Map function performs processing, sorting huge data sets by splitting the data into chunks, while the Reduce function displays the summary result of the intermediate map function and provides the final output.
Corresponding Author:Hany H. Hussien, Department of Information Systems,
Asian J. Inform. Technol., 18 (5): 150-159, 2019
The model based on a Genetic algorithm setting the best centroid and reducing the number of iterations in the k-Means algorithm, then using the MapReduce function to obtain a modified k-Means algorithm that works in parallel, all this leads to high speed, accuracy and data handling efficiency.
Literature review: Some work has implemented k-Means in different forms depending on MapReduce and has obtained different results, (Jain and verma, 2014) suggesting an approximate approach based on the classic k-Means algorithm that has achieved lower time complexity, set number of iterations depending on the number of attributes, use adjusted Manhattan distance with good results for algorithms with specific datasets based on decreases in runtime and performed.
Bhatia and Khurana (2013) discussed various approaches for the choice of initial centers from a k- Means algorithm as well as a comparative analysis of original k-Means and information clustering with modified k-Means. The comparison description indicates that the modified k-Means have less execution time as well as a limited number of iterations by setting the range of initial centers that locate the centers in high frequency data points segments.
Pooja and Kulvinder, (2016) presented an improved k-Means Genetic Algorithm Known as (GKA) by combining the Genetic algorithm with the k-Means algorithm for large data clustering. The proposed algorithm provided a better clustering than, regular k-Means but with a little more complexity in time. In this study, the future work is to use the MapReduce paradigm with a k-Means algorithm to make big data processing suitable.
Anchalia et al. (2013) discussed the implementation of the k-Means Clustering algorithm via. a distributed platform using MapReduce distributed on Apache Hadoop. The proposed algorithm implemented 7 connected nodes through, a LAN network. The k-Means clustering by the three-level MapReduce model is optimized for mapping increasing the clustering of k- Means and applying a k-Means function. The proposed algorithm concluded that the difference between the cluster centroid and the component in the dataset was obtained by a minimum square.
Zhao et al. (2009) presented adapting k-Means algorithm in the MapReduce system implemented by Hadoop to make the clustering approach applicable on a wide scale of data by applying suitable <key, value> pairs and can be effectively executed in parallel. The experimental results were strengthened by comparable measures such as speed-up, scale-up and size-up.
Vishnupriya and Francis (2015) using k-Means clustering algorithm to cluster data for different types of a Hadoop dimensional dataset based on Euclidean
distance and SSE (Sum of Square Error) to determine the high accuracy of the model. The results of the cluster value determined by the best total range and estimated by the measure of accuracy to determine the quality of the cluster.
Garg et al. (2013) described three clustering algorithms k-Mean, canopy and fuzzy k-Mean, all algorithms implemented in Hadoop over the MapReduce system, the overview focuses on choosing the type of clustering algorithm to be based on the available data, request and processing type. The algorithm must also be merged into MapReduce by means of a huge number of machine learning techniques.
Lu et al. (2012) presented and demonstrated the efficacy of using the Genetics k-Means algorithm on the iterative MapReduce system. The Amazon cloud computing interface’s experimental outcome implies that using the MapReduce could dramatically decrease running time by increasing the number of computing nodes which run the algorithm independently on each node and combine those nodes to achieve the final result.
Cluster analysis and types of clustering algorithms:
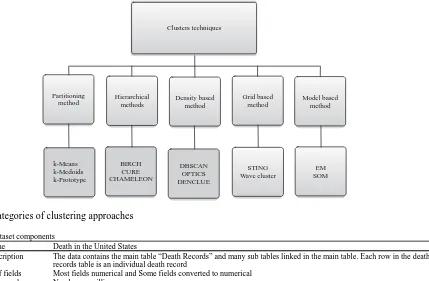
Clustering is an approach to gaining insight into information and working in different areas such as research of social networks, e-Commerce. The main concept of cluster analysis is the method of splitting large data sets into sub-sets, each sub-set is a cluster similar in features and characteristics. The clustering techniques can be divided into five different methods such as partitioning techniques, hierarchical methods, density-based methods, grid-based methods and model-based methods (Saxena et al., 2017).
Partitioning techniques: The cluster must contain at least one object and only the one cluster can belong to each object. The number of “k” clusters is pre-selected which makes the algorithm a semi-supervised but there are techniques to evaluate “k”.
Hierarchical methods: This method makes clusters in a hierarchical form which in a hierarchical tree systematically forms nested clusters. By dividing instances from top to bottom or from bottom to top, the groups are created.
Density-based methods: Connectivity and limitation based on the idea of density. The cluster is created as a dense component that can extend in any direction until the density stays above a threshold. This leads to the automatic avoidance of outliers and well-separated cluster innovation.
Clusters techniques
Partitioning
method Hierarchicalmethods
Density based method
Grid based method
Model based method
k-Means k-Medoids k-Prototype
BIRCH CURE CHAMELEON
DBSCAN OPTICS DENCLUE
STING Wave cluster
EM SOM
multidimensional range clusters. This method divides the space into a fixed number of cells creating a grid structure on which all the clustering operations are carried out.
Model-based methods: Works suitable between the data given and the predefined mathematical model, consider the data generated by a system or from a distribution that is a mixture of two or more clusters. The goal is to retrieve the original model from the data and to pick the number of clusters based on standard statistics.
Several strategies were suggested by Sanse et al. (2015) for each type of cluster techniques. Figure 1 shows the taxonomy of the approaches to clustering.
k-Means algorithm: The k-Means is an unsupervised learning algorithm and a soft method to classify the input dataset by a fixed number of clusters. The user determines the number of clusters which called “K”, so, making this a semi-supervised algorithm and many of researches have been suggested to solve this problem. Every cluster has a center and each cluster belongs to the nearest center, the center of the cluster is equal to the sum of all points in the cluster (Franti and Sieranoja, 2018). The k-Means algorithm iterates and rearranges points using distance measurements such as Euclidean distance, cosine, city block, hamming and correlation (Krishnaveni and Rathipriya, 2016). The steps of the k-Means algorithm as following (Saxena et al., 2017):
Algorithm 1; k-Means algorithm:
1. Select K initial centroids randomly C 1, C 2, ..., C k, one for each
cluster Sm
2. Assign each point to the group that near of the centroid by specify
the nearest Cm according to similarity measure, and assign each data element to the cluster Sm
3. When all points have been assigned, recalculate the positions of
new centroid Cm for each cluster Sm
4. Repeat steps 2 and 3 until the centroids C1, C2, ..., C k don’t
change
The aim of the k-Means algorithm is to minimize the amount of “SSE: Square Error as the objective variable. The function represents a clustering solution and a reasonable minimizing result of the amount of square distance that must be obtained in order to achieve a better clustering (Sanse and Sharma, 2015):
(1)
k ni 2
ij i i 1 j 1 Minimize SSE x -m
Where:
k : The number of clusters xij : The jth data point of ith cluster mi : The centre of ith cluster
ni : The number of data points of ith cluster
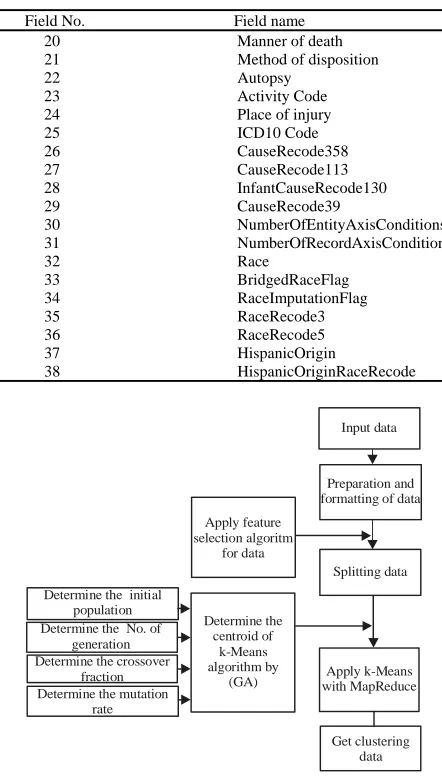
[image:3.612.110.539.428.709.2]Dataset description: The data set used in the proposed model is a “US death” the contents of the data set used are shown in Table 1 and 2.
Fig. 1: Categories of clustering approaches
Table 1: Dataset components
Dataset name Death in the United States
Dataset description The data contains the main table “Death Records” and many sub tables linked in the main table. Each row in the death
records table is an individual death record
Data type of fields Most fields numerical and Some fields converted to numerical
Number of records Nearly one million rows
Asian J. Inform. Technol., 18 (5): 150-159, 2019
Determine the initial population Determine the No. of
generation Determine the crossover
fraction Determine the mutation
rate
Apply feature selection algoritm
for data
Determine the centroid of
k-Means algorithm by
(GA)
Input data
Preparation and formatting of data
Splitting data
Apply k-Means with MapReduce
[image:4.612.314.535.100.488.2]Get clustering data
Table 2: Dataset components
Field No. Field name Field No. Field name
1 ID 20 Manner of death
2 Resident Status 21 Method of disposition
3 Education1989Revision 22 Autopsy
4 Education2003Revision 23 Activity Code
5 Education reporting flag 24 Place of injury
6 Month of death 25 ICD10 Code
7 Sex 26 CauseRecode358
8 Age type 27 CauseRecode113
9 Age 28 InfantCauseRecode130
10 Age substitution flag 29 CauseRecode39
11 AgeRecode52 30 NumberOfEntityAxisConditions
12 AgeRecode27 31 NumberOfRecordAxisConditions
13 AgeRecode12 32 Race
14 InfantAgeRecode22 33 BridgedRaceFlag
15 PlaceOfDeathAndDecedentsStatus 34 RaceImputationFlag
16 MaritalStatus 35 RaceRecode3
17 DayOfWeekOfDeath 36 RaceRecode5
18 CurrentDataYear 37 HispanicOrigin
19 InjuryAtWork 38 HispanicOriginRaceRecode
MATERIALS AND METHODS
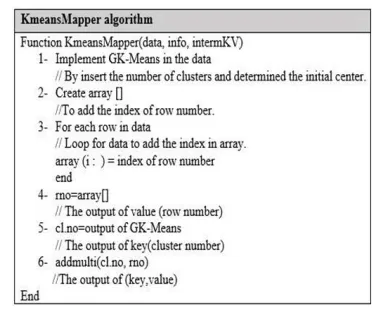
The proposed algorithm indicates the work steps that begin from the input data and use a feature selection algorithm to prepare the data and then apply a Genetic algorithm to the input divided data to determine the initial center from the generic k-Means algorithm. The proposed algorithm diagram is shown in Fig. 2.
Feature selection algorithm and preparation of data Feature selection: Feature selection is an important technique in data mining, machine learning and mostly used in classification problems. It is characterized as automatic selection of attributes in data such as columns in tabular data by reducing unnecessary data and using modified data algorithms to improve algorithm performance (Chormunge and Jena, 2018). The benefits of using this approach are to improve accuracy, minimize computational costs and reduce training time (Falguni et al., 2019). Feature selection algorithm through, Weka program provides an attribute selection tool. The process is divided into two parts: the evaluator attribute and the search method, the evaluator attribute is the method by which a subset of attributes is evaluated while the search method is the systematic method by which the search area of potential subsets of attributes is navigated based on the evaluation of the subset. The method used for the attribute evaluator is (CfsSubsetEval) while (GeneticSearch) is used for the Genetic algorithm search tool (Gnanambal et al., 2018).
[image:4.612.325.535.286.487.2]Apply feature selection for the dataset: The first step in the preparation of data for the main model in Fig. 2 is to use the feature selection algorithm in the Weka Software to reduce the amount of data without losing its value using the parameter “Genetic Search attribute evaluation methods. Implementation of the data set function selection and sorting of the data fields shown in Table 3.
[image:4.612.314.541.528.602.2]Fig. 2: The proposed algorithm diagram
Table 3: The implementation of the feature selection process
Number of attribute in dataset 38 Attributes
Search method Genetic search
Attribute subset evaluator Attribute No. 25 (Icd10Code: types of
diseases) because it is the main column for the division of dataset to groups
Number of selected attributes 10 attributes No.
(6, 14, 19, 22, 25, 26, 29, 33, 34, 35) The attributes name in Table 2
The feature selection technique used artificial intelligence technologies such as a Genetic algorithm to search and select the best characteristics in the data. The choice of features by genetic search has resulted in the reduction of the data size from 38 fields to the best 10 fields and the elimination of 28 fields is not sufficient for the data structure.
techniques derived from evolutionary biologies such as inheritance, selection, mutation and crossover functions. The Genetic algorithm was one of the search algorithms based on natural genetics and natural selection or the techniques of random search and optimization using evolution concepts. GA uses three main basic rules for work (Al-Shboul and Myaeng, 2009; Punidha et al., 2018):
Selection rules: Select the individuals “parents” that participate in the population at the next generation.
Crossover rules: Combine the two parents to compose “children” at the next generation.
Mutation rules: Work at random changes on individual parents to produce children.
GA work as following (El-Shorbagy et al., 2018):
Algorithm 2; k-Means and Genetic algorithm:
1. Start with a big population of generated randomly 2. Repeatedly make the following
A. Evaluate each of the attempted solutions
B. Keep a subset of the better solutions
C. Use these solutions to generate a new
population
3. Stop when you have an ideal solution or the time finished
[image:5.612.332.514.97.253.2]k-Means and Genetic algorithm: k-Means algorithm provides a suboptimal solution for clustering based on the determining of the initial centre for clusters. Accordingly, one of the most problems in the k-Means algorithm it randomly determines the initial centroid when running the algorithm, this leads to the poor performance of the algorithm because of a more number of iterations. Many of researches tried to solve this weakness in the k-Means algorithm by using of artificial intelligence mechanisms like the Genetic algorithm that use to search and reach on an initial centroid in the k-Means algorithm, therefore, reduced the number of iteration and improved the performance of k-Means. The modified k-Means algorithm called Gk-Means and the steps of using a Genetic algorithm with k-Means (Gk-Means) is shown in Fig. 3.
K-Means by MapReduce
[image:5.612.330.516.289.444.2]MapReduce: MapReduce is a software architecture proposed by Google managed the data partitions and apply the concept of parallel processing on the portioned data, then compile all divided work in one results in order to get an output with the efficient performance (Priya and Saradha, 2018). MapReduce divided the input data into a lot of small segments, every segment is processed by a map function first, then grouped by the key and managed by a reduce function. The idea of MapReduce consists of the map phase called map function and reduce phase called reduce function. The map function executed the algorithm on all chunk in datasets and handling a
Fig. 3: k-Means with GA steps
Fig. 4: k-Means mapper algorithm
key/value input data to create a set of intermediate key/value pairs. The reduce function combined the output of the map function by intermediate all values for the same intermediate key and produced the final outputs (Sinha and Jana, 2018).
k-Means by MapReduce algorithm: Map phase
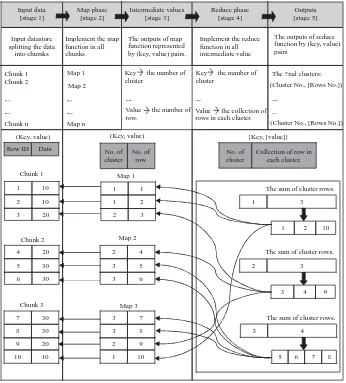
implemented Gk-Means on the input dataset and put in pair <key, value> where <key> is cluster number and <value> is row number. The outputs of the map phase are <cluster-no, row-no>. Map phase operated by the map function in the algorithm called “K-meansMapper”. The steps of KmeansMapper is shown in Fig. 4.
Reduce phase combined the outputs of the map phase and stored by <key, value>where <key> is a cluster number, <value> contains a set of rows- numbers. The output of Reduce phase <cluster-no, [set of rows-no]>. Reduce phase operated by the Reduce function in the algorithm called “KmeansReducer”. The steps of KmeansReducer is shown in Fig. 5.
Asian J. Inform. Technol., 18 (5): 150-159, 2019
10 10 1 10
2 9
3 3
8 7 30
30 20 9 8 7
Chunk 3 Chunk 2 Chunk 1
Map 3 Map 2 Map 1
1 1
1 2
2 3
2
3 3
4 5 6 4
5 6 30
30 20 20 10 10 1 2 3
1 3
1 2 10
2 3
3 4 9
3 4
5 6 7 8 The sum of cluster rows.
The sum of cluster rows.
The sum of cluster rows. {Key, [value]}
(Key, value) (Key, value) Row ID Data No. of
cluster No. of
row
No. of cluster
[image:6.612.87.283.141.286.2] [image:6.612.334.522.197.288.2] [image:6.612.127.473.326.709.2]Collection of row in each cluster. Input data
[stage 1]
Map phase [stage 2]
Intermediate values [stage 3]
Reduce phase [stage 4]
Outputs [stage 5]
Input datastore splitting the data
into chumks
Implement the map function in all chunks
The outputs of map function represented by (key, value) pairs.
Implement the reduce function in all intermediate value
The outputs of reduce function by (key, value) pairs
Chunk 1 Chunk 2
Chunk n
Map 2
Map n
Key the number of cluster
Value the number of row.
Key the number of cluster
Value the collection of rows in each cluster.
The ? nal clusters: (Cluster No., [Rows No.])
(Cluster No., [Rows No.])
Map 1 1
needs three parameters of the datastore, map function and feature reduction. The steps of MapReduce k-Means algorithm is shown in Fig. 6.
Fig. 5: k-Means reducer algorithm
k-Means by MapReduce diagram: Shows a small
example of how the algorithm works and how to execute a k-Means with MapReduce from the beginning through the input datastore and then maps the process afterwards for a small dataset containing 10 records as well as how to divide and compile information into classes. MapReduce’s implementation of k-Means with the simple data set is shown in Fig. 7.
Fig. 6: MapReduce k-Means algorithm
The model is divided into five phases by the illustration above. First, the data is entered and divided by datastore into chunks, the second stage is the implementation of the map function for each chunk of the data and the results of that stage are placed in the third stage in the intermediate input. The fourth stage is an implementation on the intermediate results of the reduction function while the results imposed in the final stage are the inputs for the final outputs.
RESULTS AND DISCUSSION
Experimental results
Experimental setup: The hardware configuration uses 8GB RAM, Windows 10-64 Bit Operating System and Intel Core i7. The proposed model runs by MapReduce and datastore functionality built into MATLAB R2017a.
Main model result and comparison. According to the main model in Fig. 2, comparisons were made on three levels, the first level using the feature selection algorithm, the second level using the Genetic algorithm and the third level using the k-Means by MapReduce. Results of using a feature selection algorithm: Implementing a generic k-Means algorithm that included
38 fields in MATLAB on the dataset. The dataset was reduced to 10 fields after applying the feature selection algorithm. The k-Means algorithm with the dataset is shown in Table 4 and Fig. 8 before and after using a feature selection algorithm.
The effect of the data while applying the k-Means algorithm has resulted in significantly improved clustering results in the best total range, the number of iterations decreased by 86% and its impact on execution time decreased by 83%. The results were obtained through the use of 2131 clusters on the dataset describing diseases in 200,000 files.
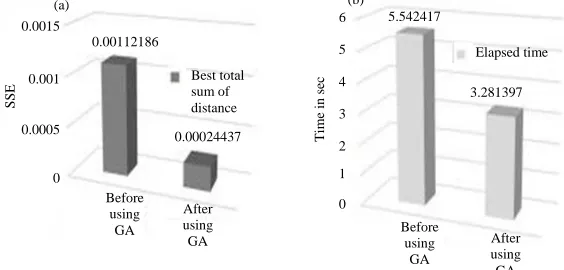
Results of using Genetic algorithm with k-Means: The define parameters of Genetic k-Means algorithm for testing the dataset is shown in Table 5. The results of the executed standard k-Means and Gk-Means are shown in Table 6 and Fig. 9.
The goal of using artificial intelligence techniques such as the Genetic algorithm is to improve the performance of other algorithms where the Genetic algorithm has been able to deal with a weak point in the k-Means algorithm by searching for the initial center point for each cluster. The Genetic k-Means performed by parameters including generation number, crossover
Fig. 8(a, b): Dataset with k-Means algorithm using feature selection algorithm, (a) The best total sum of distances and (b) The Elapsed time
Fig. 9(a, b): Dataset with k-Means and Gk-Means, (a) The best total sum of distances and (b) The Elapsed time
60,000,000
40,000,000
20,000,000
0
500
400
300
200
100
0 Before
After Best total sum of distances 51,104,800
152597
473,469695
81.213033 Elapsed time
Before
After
(a) (b)
Ti
me in
sec
SSE
0.0015
0.001
0.0005
0
6
5
4
3
2 1
0 Before
using GA
After using GA
Best total sum of distance 0.00112186
0.00024437
5.542417
3.281397 Elapsed time
Before using
GA
After using GA
(a) (b)
Ti
me in
sec
[image:7.612.156.451.388.516.2] [image:7.612.162.444.565.700.2]Asian J. Inform. Technol., 18 (5): 150-159, 2019
Table 4: Dataset with k-Means algorithm and apply feature selection
Items Before After
Number of Attributes 38 10
Number of clustering 2131 2131
Number of iteration 65 9
Best total sum of distances 51,104,800 152597
Elapsed time in seconds 473.469695 81.213033
Table 5: Parameters of GA
No. of records 100 sample data 1000 sample data
No. of cluster 60, No. of cluster 279, No. of cluster
from 100 records from 1000 records
Size of initial population 50 500
No. of generation 500 2000
Crossover fraction 0.8 0.85
Mutation rate 0.01 0.05
Table 6: Test data with G K-Means
100 records (10 attributes) 1000 records (10 attributes)
---
---Parameters k-Means before using GA k-Means after using GA k-Means before using GA k-Means after using GA
Best total sum of distances 0.0000200551 0.0000012166 0.00112186 0.00024437
[image:8.612.103.491.279.540.2]Elapsed time in seconds 0.060452 0.033934 5.542417 3.281397
Table 7: Comparison of standard k-means and GK means by MapReduce
Execution time in seconds Best total sum of distances
---
---Size of dataset No. of Using standard Using GK means Using standard Using G k-Means
(Records) clusters k-Means by MapReduce k-Means by MapReduce
1000 279 1.976193 1.114684 2.98413 1.91667
10000 450 9.986293 1.794360 1176.72635 1006.63
50000 600 12.935181 4.676103 3457.56 151.736
100000 900 15.383122 9.511985 2366.29 90.8231
200000 2131 64.500919 37.796939 114.238 2.19048
Fig. 10: The execution time comparison between standard k-Means and Gk-Means by MapReduce percentage and rate of mutation. The parameter choice is
based on the data size in which 100, 1000 records are used, the results showed a 40% improvement in the execution time and a 78% improvement in the best number of distances which means that using the Genetic algorithm as a search tool and combining it with the k-Means algorithm resulted in improved results.
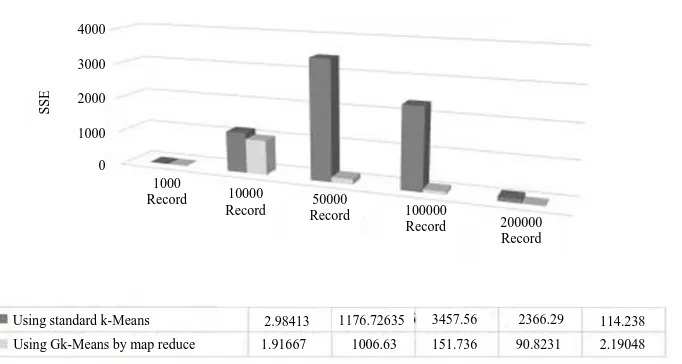
Results of using Gk-Means by MapReduce: The
comparison presents the execution time and the best total sum of distances between standard k-Means and Gk-Means by MapReduce with dataset. The different sizes of the data are used such as 1000 record, 10000
records, 50000 records, 100000 records and 200000 records. The results are shown in Table 7, Fig. 10 and 11.
According to the above findings, the analysis of the standard algorithm and the proposed algorithm on different dataset sizes shows a significant improvement in Time of execution and the best total distances taken into account by the most relevant factors. This development suggests that the proposed algorithm has evolved its working method and allows it to be implemented with large volumes of data. With a test of 1000 data record shows that the rate of improvement in execution time is 44% and the best total range is 36%. Additionally, the
80
60
40
20
0
1000
Record 10000
Record 50000
Record 100000
Record 200000 Record
Using standard k-Means Using Gk-Means by map reduce
1.976193 9.986293 12.935181 15.383122 64.500919 1.114684 1.79436 4.676103 9.511985 37.796939
Ti
me in
Asian J. Inform. Technol., 18 (5): 150-159, 2019
Fig. 11: The best total sum of distances comparison between standard k-Means and Gk-Means by MapReduce execution time increases when the number of clusters
increases and the total sum of distances decreases. The final results showed that the proposed algorithm achieved better results because it addressed the shortcomings of the traditional k-Means algorithm as the initial center point was chosen by intelligent software and the parallel processing algorithm, all of which helped to improve the algorithm’s efficiency and achieve optimal results.
CONCLUSION
The great advancement in increasing the size, complexity and sharing of information is an obstacle under the conventional algorithms of clustering, modern artificial intelligence and parallel processing systems must therefore, be used to handle a large amount of data processing and make the conventional clustering technique as a k-Means algorithm operate in a complicated and incompetent manner in contrast, k-Means provides an efficient clustering with similar characteristics by means of a distributed system using Map-Reduce. The k-Means algorithm must therefore be run optimally and solve the main problem representing an initial center in the choice to begin the algorithm regulating the number of iterations and the execution time, subsequently using a technique such as a Genetic algorithm to handle the searching for a cluster center. The first step in this research is to prepare and format data using the feature selection algorithm which reduced the data size considerably and became a structured data, the next step is to improve the k-Means algorithm by selecting the initial center point via the Genetic algorithm and the final step is to use the MapReduce algorithm for parallel processing of data analytics tasks. The algorithm was applied in the US dataset with different death data sizes and the results are summarized. The experimental results of using the proposed algorithm achieved better
results in terms of time of execution and the best sum of distances described in the algorithm’s speed and accuracy. All of this has resulted in an ideal impact on handling the large volume of data.
REFERENCES
Al-Shboul, B. and S.H. Myaeng, 2009. Initializing k-Means using genetic algorithms. World Acad. Sci. Eng. Technol., 54: 114-118.
Anchalia, P.P., A.K. Koundinya and N.K. Srinath, 2013. Mapreduce design of K-means clustering algorithm. Proceedings of the 2013 International Conference on Information Science and Applications (ICISA’13), June 24-26, 2013, IEEE, Suwon, South Korea, pp: 1-5.
Bhatia, M.P.S. and D. Khurana, 2013. Analysis of initial centers for k-means clustering algorithm. Int. J. Comput. Appl., 71: 9-12.
Chormunge, S. and S. Jena, 2018. Correlation based feature selection with clustering for high dimensional data. J. Electr. Syst. Inf. Technol., 5: 542-549.
El-Shorbagy, M.A., A.Y. Ayoub, I.M. El-Desoky and A.A. Mousa, 2018. A novel genetic algorithm based K-means algorithm for cluster analysis. Proceedings of the International Conference on Advanced Machine Learning Technologies and Applications (AMLTA’18), February 22-24, 2018, Springer, Berlin, Germany, pp: 92-101.
Falguni P., S.D. Bendale and S.A. Gaywala, 2019. A review on data partition method with feature selection method for big data. Int. J. Sci. Res. Rev., 7: 798-806.
Franti, P. and S. Sieranoja, 2018. k-Means properties on six clustering benchmark datasets. Applied Intell., 48: 4743-4759.
4000
3000
2000
1000
0
1000
Record 10000
Record Record 50000 100000
Record 200000 Record
Using standard k-Means Using Gk-Means by map reduce
2.98413 1176.72635 3457.56 2366.29 114.238 1.91667 1006.63 151.736 90.8231 2.19048
Asian J. Inform. Technol., 18 (5): 150-159, 2019
Garg, D., K. Trivedi and B. Panchal, 2013. A comparative study of clustering algorithms using mapreduce in hadoop. Int. J. Eng. Res. Technol. (IJERT), 2: 2999-3004.
Gnanambal, S., M. Thangaraj, V.T. Meenatchi and V. Gayathri, 2018. Classification Algorithms with Attribute Selection: An evaluation study using WEKA. Int. J. Adv. Networking Appl., 9: 3640-3644.
Godara, A. and V. Sharma, 2016. Improvement of initial centroids in K-means clustering algorithm. Int. J. Adv. Res. Innovative Ideas Educ., 2: 1773-1778.
Hossain, Z. and N. Akhtar, 2019. A dynamic K-means clustering for data mining. Indonesian J. Electr. Eng. Comput. Sci., 13: 521-526.
Jain, M. and C. Verma, 2014. Adapting K-means for clustering in big data. Int. J. Comput. Appl., 101: 19-24.
Kashef, S., H. Nezamabadi Pour and B. Nikpour, 2018. Multilabel feature selection: A comprehensive review and guiding experiments. WIREs Data Mining Knowl. Discovery, Vol. 8, No. 2 10.1002/widm.1240
Khaimar, V. and S. Patil, 2016. Efficient clustering of data using improved Kmeans algorithm: A review. Imperial J. Interdiscip. Res. (IJIR), 2: 226-230. Khezr, S.N. and N.J. Navimipour, 2017. MapReduce and
its applications, challenges and architecture: A comprehensive review and directions for future research. J. Grid Comput., 15: 295-321.
Krishnaveni, K. and R. Rathipriya, 2016. Mapreduce k-Means based co-clustering approach for web page recommendation system. Int. J. Comput. Intell. Inf., 6: 164-175.
Naganathan, V., 2018. Comparative analysis of big data, big data analytics: Challenges and trends. Int. Res. J. Eng. Technol., 5: 1948-1964.
Pooja, B. and S. Kulvinder, 2016. Big data mining: Analysis of genetic k-Means algorithm for big data clustering. Int. J. Adv. Res. Comput. Sci. Software Eng., 6: 223-228.
Priya T.M. and A. Saradha, 2018. An improved k-Means cluster algorithm using map reduce techniques to mining of inter and intra cluster data in big data analytics. Int. J. Pure Applied Math., 119: 679-690. Punidha, Anitha, Arulanandan and Karthikeyan, 2018. Analysis of dataset in social media using k-Means genetic algorithm. Int. J. Pure Applied Math., 119: 1-7.
Rao, B.C. and M. Rambabu, 2016. Implementing k-Means clustering algorithm using mapreduce paradigm. Int. J. Sci. Res. (IJSR), 5: 1240-1244. Sanse, K. and M. Sharma, 2015. Clustering methods for
big data analysis. Int. J. Adv. Res. Comput. Eng. Technol. (IJARCET), 4: 642-648.
Saxena, A., M. Prasad, A. Gupta, N. Bharill and O.P. Patel et al., 2017. A review of clustering techniques and developments. Neurocomputing, 267: 664-681.
Sinha, A. and P.K. Jana, 2018. A hybrid mapreduce-based k-Means clustering using genetic algorithm for distributed datasets. J. Supercomputing, 74: 1562-1579.
Vishnupriya, N. and F.S. Francis, 2015. Data clustering using mapreduce for multidimensional datasets. Int. Adv. Res. J. Sci., Eng.Technol., 2: 39-42.
Zeebaree, D.Q., H. Haron, A.M. Abdulazeez and S.R. Zeebaree, 2017. Combination of K-means clustering with genetic algorithm: A review. Int. J. Applied Eng. Res., 12: 14238-14245.