Distributional Measures of Concept-Distance:
A Task-oriented Evaluation
Saif Mohammad and Graeme Hirst Department of Computer Science
University of Toronto Toronto, ON M5S 3G4, Canada
fsmm,[email protected]
Abstract
We propose a framework to derive the distance between concepts from distribu-tional measures of word co-occurrences. We use the categories in a published thesaurus as coarse-grained concepts, al-lowing all possible distance values to be stored in a concept–concept matrix roughly .01% the size of that created by existing measures. We show that the newly proposed concept-distance mea-sures outperform traditional distributional word-distance measures in the tasks of (1) ranking word pairs in order of se-mantic distance, and (2) correcting real-word spelling errors. In the latter task, of all the WordNet-based measures, only that proposed by Jiang and Conrath out-performs the best distributional concept-distance measures.
1 Semantic and distributional measures Measures of distance of meaning are of two kinds. The first kind, which we will refer to as
seman-tic measures, rely on the structure of a resource
such as WordNet or, in some cases, a semantic network, and hence they measure the distance be-tween the concepts or word-senses that the nodes of the resource represent. Examples include the measure for MeSH proposed by Rada et al. (1989) and those for WordNet proposed by Leacock and Chodorow (1998) and Jiang and Conrath (1997). (Some of the more successful measures, such as Jiang–Conrath, also use information content de-rived from word frequency.) Typically, these mea-sures rely on an extensive hierarchy of hyponymy relationships for nouns. Therefore, these measures
are expected to perform poorly when used to es-timate distance between senses of part-of-speech pairs other than noun–noun, not just because the WordNet hierarchies for other parts of speech are less well developed, but also because the hierar-chies for the different parts of speech are not well connected.
The second kind of measures, which we will refer to as distributional measures, are inspired by the maxim “You shall know a word by the company it keeps” (Firth, 1957). These measures rely simply on raw text, and hence are much less resource-hungry than the semantic measures; but they measure the distance between words rather than word-senses or concepts. In these measures, two words are considered close if they occur in similar contexts. The context (or “company”) of a target word is represented by its distributional
profile (DP), which lists the strength of
associ-ation between the target and each of the lexical, syntactic, and/or semantic units that co-occur with it. Commonly used measures of strength of
as-sociation are conditional probability (0 to 1) and
pointwise mutual information ( ∞to∞)1. Com-monly used units of co-occurrence with the target are other words, and so we speak of the lexical
dis-tributional profile of a word (lexical DPW). The
co-occurring words may be all those in a prede-termined window around the target, or may be re-stricted to those that have a certain syntactic (e.g., verb–object) or semantic (e.g., agent–theme) re-lation with the target word. We will refer to the former kind of DPs as relation-free. Usually in
1In our experiments, we set negative PMI values to 0, be-cause Church and Hanks (1990), in their seminal paper on word association ratio, show that negative PMI values are not expected to be accurate unless co-occurrence counts are made from an extremely large corpus.
Table 1: Measures of DP distance and measures of strength of association.
DP distance Strength of association
α-skew divergence conditional probability cosine pointwise mutual information Jensen–Shannon divergence
Lin
the latter case, separate association values are cal-culated for each of the different relations between the target and the co-occurring units. We will refer to such DPs as relation-constrained.
Typical relation-free DPs are those of Sch¨utze and Pedersen (1997) and Yoshida et al. (2003). Typical relation-constrained DPs are those of Lin (1998) and Lee (2001). Below are contrived, but plausible, examples of each for the word pulse; the numbers are conditional probabilities.
relation-free DP
pulse: beat (.28), racing (.2), grow (.13), beans (.09), heart (.04), . . .
relation-constrained DP
pulse: <beat, subject–verb> (.34),
<racing, noun–qualifying adjective>
(.22),<grow, subject–verb>(.14), . . .
The distance between two words, given their DPs, is calculated using a measure of DP
dis-tance, such as cosine. While any of the mea-sures of DP distance may be used with any of the measures of strength of association (see Table 1), in practiceα-skew divergence (ASD), cosine, and Jensen–Shannon divergence (JSD) are used with conditional probability (CP), whereas Lin is used with PMI, resulting in the distributional measures ASDcp (Lee, 2001), Coscp(Sch¨utze and Pedersen,
1997), JSDcp, and Linpmi(Lin, 1998), respectively.
ASDcpis a modification of Kullback-Leibler
diver-gence that overcomes the latter’s problem of divi-sion by zero, which can be caused by data sparse-ness. JSDcp is another relative entropy–based
measure (like ASDcp) but it is symmetric. JSDcp
and ASDcp are distance measures that give scores
between 0 (identical) and infinity (maximally dis-tant). Linpmiand Coscpare similarity measures that
give scores between 0 (maximally distant) and 1 (identical). See Mohammad and Hirst (2005) for a detailed study of these and other measures.
2 The distributional hypothesis and its limitations
The distributional hypothesis (Firth, 1957) states that words that occur in similar contexts tend to be semantically similar. It is often suggested, there-fore, that a distributional measure can act as a proxy for a semantic measure: the distance be-tween the DPs of words will approximate the dis-tance between their senses. But when words have more than one sense, it is not at all clear what se-mantic distance between them actually means. A word in each of its senses is likely to co-occur with different sets of words. For example, bank in the ‘financial institution’ sense is likely to co-occur with interest, money, accounts, and so on, whereas the ‘river bank’ sense might have words such as river, erosion, and silt around it. If we de-fine the distance between two words, at least one of which is ambiguous, to be the closest distance between some sense of one and some sense of the other, then distributional distance between words may indeed be used in place of semantic distance between concepts. However, because measures of distributional distance depend on occurrences of the target word in all its senses, this substitution is inaccurate. For example, observe that both DPWs of pulse above have words that co-occur with its ‘throbbing arteries’ sense and words that co-occur with its ‘edible seed’ sense. Relation-free DPs of pulse in its two separate senses might be as fol-lows:
pulse ‘throbbing arteries’: beat (.36),
racing (.27), heart (.11), . . .
pulse ‘edible seeds’: grow (.24), beans
(.14), . . .
Thus, it is clear that different senses of a word have different distributional profiles (“different com-pany”). Using a single DP for the word will mean the union of those profiles. While this might be useful for certain applications, we believe that in a number of tasks (including estimating linguistic distance), acquiring different DPs for the differ-ent senses is not only more intuitive, but also, as we will show through experiments in Section 5, more useful. We argue that distributional
pro-files of senses or concepts (DPCs) can be used to
3 Conceptual grain size and storage requirements
As applications for linguistic distance become more sophisticated and demanding, it becomes at-tractive to pre-compute and store the distance val-ues between all possible pairs of words or senses. But both kinds of measures have large space re-quirements to do this, requiring matrices of size NN, where N is the size of the vocabulary
(per-haps 100,000 for most languages) in the case of distributional measures and the number of senses (75,000 just for nouns in WordNet) in the case of semantic measures.
It is generally accepted, however, that WordNet senses are far too fine-grained (Agirre and Lopez de Lacalle Lekuona (2003) and citations therein). On the other hand, published thesauri, such as Ro-get’s and Macquarie, group near-synonymous and semantically related words into a relatively small number of categories—typically between 800 and 1100—that roughly correspond to very coarse concepts or senses (Yarowsky, 1992). Words with more than one sense are listed in more than one category. A published thesaurus thus provides us with a very coarse human-developed set or inven-tory of word senses or concepts2that are more in-tuitive and discernible than the “concepts” gener-ated by dimensionality-reduction methods such as latent semantic analysis. Using coarse senses from a known inventory means that the senses can be represented unambiguously by a large number of possibly ambiguous words (conveniently available in the thesaurus)—a feature that we exploited in our earlier work (Mohammad and Hirst, 2006) to determine useful estimates of the strength of asso-ciation between a concept and co-occurring words. In this paper, we go one step further and use the idea of a very coarse sense inventory to de-velop a framework for distributional measures of concepts that can more naturally and more ac-curately be used in place of semantic measures of word senses. We use the Macquarie The-saurus (Bernard, 1986) as a sense inventory and repository of words pertaining to each sense. It has 812 categories with around 176,000 word tokens and 98,000 word types. This allows us to have much smaller concept–concept distance
matri-ces of size just 812812 (roughly .01% the size
2We use the terms senses and concepts interchangeably. This is in contrast to studies, such as that of Cooper (2005), that attempt to make a principled distinction between them.
of matrices required by existing measures). We evaluate our distributional concept-distance mea-sures on two tasks: ranking word pairs in order of their semantic distance, and correcting real-word spelling errors. We compare performance with distributional word-distance measures and the WordNet-based concept-distance measures.
4 Distributional measures of concept-distance
4.1 Capturing distributional profiles of concepts
We use relation-free lexical DPs—both DPWs and DPCs—in our experiments, as they allow deter-mination of semantic properties of the target from just its co-occurring words.
Determining lexical DPWs simply involves making word–word co-occurrence counts in a corpus. A direct method to determine lexical DPCs, on the other hand, requires information about which words occur with which concepts. This means that the text from which counts are made has to be sense annotated. Since exist-ing labeled data is minimal and manual annota-tion is far too expensive, indirect means must be used. In an earlier paper (Mohammad and Hirst, 2006), we showed how this can be done with sim-ple word sense disambiguation and bootstrapping techniques. Here, we summarize the method.
First, we create a word–category co-occurrence matrix (WCCM) using the British
National Corpus (BNC) and the Macquarie Thesaurus. The WCCM has the following form:
c1 c2 ::: cj :::
w1 m11 m12 ::: m1 j :::
w2 m21 m22 ::: m2 j :::
..
. ... ... . .. ::: :::
wi mi1 mi2 ::: mi j :::
..
. ... ... ... ... . ..
A cell mi j, corresponding to word wi and
cate-gory cj, contains the number of times wico-occurs
(in a window of 5 words in the corpus) with
any of the words listed under category cj in the
thesaurus. Intuitively, the cell mi j captures the
number of times cj and wi co-occur. A
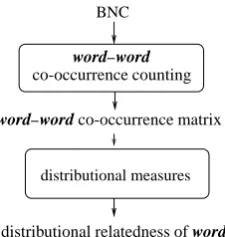
distributional measures BNC
distributional relatedness of words word–word co-occurrence matrix
[image:4.595.129.242.60.179.2]co-occurrence counting word–word
Figure 1: Distributional word-distance.
ratio, on the contingency table gives the strength of association between a concept (category) and co-occurring word. Therefore, the WCCM can be used to create the lexical DP for any concept.
The matrix that is created after one pass of the corpus, which we call the base WCCM, although noisy (as it is created from raw text and not sense-annotated data), captures strong associations be-tween categories and co-occurring words. There-fore the intended sense (thesaurus category) of a word in the corpus can now be determined using frequencies of co-occurring words and its various senses as evidence. A new bootstrapped WCCM is created, after a second pass of the corpus, in which the cell mi j contains the number of times
any word used in sense cj co-occurs with wi. We
have shown (Mohammad and Hirst, 2006) that the bootstrapped WCCM captures word–category co-occurrences much more accurately than the base WCCM, using the task of determining word sense dominance3 as a test bed.
4.2 Applying distributional measures to DPCs
Recall that in computing distributional word-distance, we consider two target words to be dis-tributionally similar (less distant) if they occur in similar contexts. The contexts are represented by the DPs of the target words, where a DP gives the strength of association between the target and the co-occurring units. A distributional measure uses a measure of DP distance to determine the distance between two DPs and thereby between the two tar-get words (see Figure 1). The various measures differ in what statistic they use to calculate the strength of association and the measure of DP
dis-3Near-upper-bound results were achieved in the task of determining predominant senses of 27 words in 11 target texts with a wide range of sense distributions over their two most dominant senses.
distributional measures BNC Thesaurus
distributional relatedness of concepts word–category co-occurrence matrix
sense disambiguation bootstrapping and co-occurrence counting
word–category
Figure 2: Distributional concept-distance.
tance they use (see Mohammad and Hirst (2005) for details). For example, following is the cosine formula for distance between words w1and w2
us-ing relation-free lexical DPWs, with conditional probability of the co-occurring word given the tar-get as the strength of association:
Coscp(w1;w2)= ∑w2C(w1)[C(w2)
(P(wjw1)P(wjw2)) q
∑w2C(w1)P (wjw1)
2
q
∑w2C(w2)P (wjw2)
2
Here, C(x)is the set of words that co-occur with
word x within a pre-determined window.
In order to calculate distributional concept-distance, consider the same scenario, except that the targets are now senses or concepts. Two con-cepts are closer if their DPs are similar, and these DPCs require the strength of association between the target concepts and their co-occurring words. The associations can be estimated from the boot-strapped WCCM, described in Section 4.1 above. Any of the distributional measures used for DPWs can now be used to estimate concept-distance with DPCs. Figure 2 illustrates our methodology. Be-low is the formula for cosine with conditional probabilities when applied to concepts:
Coscp(c1;c2)=
∑w2C(c1)[C(c2)
(P(wjc1)P(wjc2)) q
∑w2C(c1)P (wjc1)
2
q
∑w2C(c2)P (wjc2)
2
Now, C(x) is the set of words that co-occur with
concept x within a pre-determined window. We will refer to such measures as distributional measures of concept-distance (Distribconcept),
in contrast to the earlier-described distribu-tional measures of word-distance (Distribword)
[image:4.595.308.525.61.162.2]to these three kinds of distance measures as
measure-types. Individual measures in each kind
will be referred to simply as measures.
A distributional measure of concept-distance can be used to populate a small 812 812 concept–concept distance matrix where a cell
mi j, pertaining to concepts ci and cj, contains
the distance between the two concepts. In con-trast, a word–word distance matrix for a conserva-tive vocabulary of 100,000 word types will have a size 100,000100,000, and a WordNet-based
concept–concept distance matrix will have a size 75,000 75,000 just for nouns. Our concept–
concept distance matrix is roughly .01% the size of these matrices.
Note that the DPs we are using are relation-free because (1) we use all co-occurring words (not just those that are related to the target by certain syn-tactic or semantic relations) and (2) the WCCM, as described in Section 4.1, does not maintain sep-arate counts for the different relations between the target and co-occurring words. Creating a larger matrix with separate counts for the different rela-tions would lead to relation-constrained DPs.
5 Evaluation
To evaluate the distributional concept-distance measures, we used them in the tasks of ranking word pairs in order of their semantic distance and of correcting real-word spelling errors, and com-pared our results to those that we obtained on the same tasks with distributional word-distance mea-sures and those that Budanitsky and Hirst (2006) obtained with WordNet-based semantic measures. The distributional concept-distance measures used a bootstrapped WCCM created from the BNC and the Macquarie Thesaurus. The word-distance measures used a word–word co-occurrence matrix created from the BNC alone. The BNC was not lemmatized, part of speech tagged, or chunked. The vocabulary was restricted to the words present in the thesaurus (about 98,000 word types) both to provide a level evaluation platform and to keep the matrix to a manageable size. Co-occurrence counts less than 5 were reset to 0, and words that co-occurred with more than 2000 other words were stoplisted (543 in all). We used ASDcp(α=
0:99), Coscp, JSDcp, and Linpmi
4to populate
corre-sponding concept–concept distance matrices and
[image:5.595.316.518.114.215.2]4Whereas Lin (1998) used relation-constrained DPs, in our experiments all DPs are relation-free.
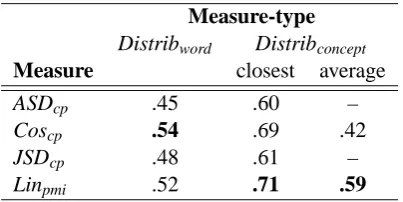
Table 2: Correlation of distributional measures with human ranking. Best results for each measure-type are shown in boldface.
Measure-type
Distribword Distribconcept
Measure closest average
ASDcp .45 .60 –
Coscp .54 .69 .42
JSDcp .48 .61 –
Linpmi .52 .71 .59
word–word distance matrices. Applications that require distance values will enjoy a run-time ben-efit if the distances are precomputed. While it is easy to completely populate the concept–concept co-occurrence matrix, completely populating the word–word distance matrix is a non-trivial task be-cause of memory and time constraints.5
5.1 Ranking word pairs
A direct approach to evaluating linguistic dis-tance measures is to determine how close they are to human judgment and intuition. Given a set of word-pairs, humans can rank them in or-der of their distance—placing near-synonyms on one end of the ranking and unrelated pairs on the other. Rubenstein and Goodenough (1965) pro-vide a “gold-standard” list of 65 human-ranked word-pairs (based on the responses of 51 sub-jects). One automatic word-distance estimator, then, is deemed to be more accurate than another if its ranking of word-pairs correlates more closely with this human ranking. Measures of concept-distance can perform this task by determining word-distance for each word-pair by finding the concept-distance between all pairs of senses of the two words, and choosing the distance of the clos-est sense pair. This is based on the assumption that when humans are asked to judge the semantic dis-tance between a pair of words, they implicitly con-sider its closest senses. For example, most people will agree that bank and interest are semantically related, even though both have multiple senses— most of which are unrelated. Alternatively, the method could take the average of the distance of all pairs of senses.
Table 3: Hirst and St-Onge metrics for evaluation of real-word spelling correction.
suspect ratio =
no. of true-suspects no. of malaps no. of false-suspects
no. of non-malaps
alarm ratio =
no. of true-alarms no. of true-suspects
no. of false-alarms no. of false-suspects
detection ratio =
no. of true-alarms no. of malaps no. of false-alarms no. of non-malaps
correction ratio =
no. corrected malaps no. of malaps no. of false-alarms no. of non-malaps
correction accuracy = no. of corrected malapsno. of true-alarms
Table 2 lists correlations of human rank-ings with those created using distributional mea-sures. Observe that Distribconcept measures
give markedly higher correlation values than Distribword measures. Also, using the distance of
the closest sense pair (for Coscp and Linpmi) gives
much better results than using the average dis-tance of all relevant sense pairs. (We do not report average distance for ASDcp and JSDcp because
they give very large distance values when sense-pairs are unrelated—values that dominate the av-erages, overwhelming the others, and making the results meaningless.) These correlations are, how-ever, notably lower than those obtained by the best WordNet-based measures (not shown in the table), which fall in the range .78 to .84 (Budanitsky and Hirst, 2006).
5.2 Real-word spelling error correction
The set of Rubenstein and Goodenough word pairs is much too small to safely assume that measures that work well on them do so for the entire En-glish vocabulary. Consequently, semantic mea-sures have traditionally been evaluated through ap-plications that use them, such as the work by Hirst and Budanitsky (2005) on correcting real-word
spelling errors (or malapropisms). If a word in a text is not “semantically close” to any other word in its context, then it is considered a
sus-pect. If the suspect has a spelling-variant that is “semantically close” to a word in its context, then the suspect is declared a probable real-word spelling error and an “alarm” is raised; the related
spelling-variant is considered its correction. Hirst and Budanitsky tested the method on 500 articles from the 1987–89 Wall Street Journal corpus for their experiments, replacing every 200th word by a spelling-variant. We adopt this method and this test data, but whereas Hirst and Budanitsky used WordNet-based semantic measures, we use distri-butional measures Distribwordand Distribconcept.
In order to determine whether two words are “semantically close” or not as per any measure of distance, a threshold must be set. If the dis-tance between two words is less than the threshold, then they will be considered semantically close. Hirst and Budanitsky (2005) pointed out that there is a notably wide band between 1.83 and 2.36 (on a scale of 0–4), such that all Rubenstein and Goodenough word pairs were assigned values ei-ther higher than 2.36 or lower than 1.83 by human subjects. They argue that somewhere within this band is a suitable threshold between semantically close and semantically distant, and therefore set thresholds for the WordNet-based measures such that there was maximum overlap in what the mea-sures and human judgments considered semanti-cally close and distant. Following this idea, we use an automatic method to determine thresholds for the various Distribwordand Distribconcept
mea-sures. Given a list of Rubenstein and Goodenough word pairs ordered according to a distance mea-sure, we repeatedly consider the mean of all con-secutive distance values as candidate thresholds. Then we determine the number of word-pairs cor-rectly classified as semantically close or semanti-cally distant for each candidate threshold, consid-ering which side of the band they lie as per human judgments. The candidate threshold with highest accuracy is chosen as the threshold.
We follow Hirst and St-Onge (1998) in the met-rics that we use to evaluate real-word spelling cor-rection; they are listed in Table 3. Suspect ratio and alarm ratio evaluate the processes of identify-ing suspects and raisidentify-ing alarms, respectively.
De-tection ratio is the product of the two, and
mea-sures overall performance in detecting the errors.
Correction ratio indicates overall correction
Table 4: Real-word error correction using distributional word-distance (Distribword), distributional
concept-distance (Distribconcept), and Hirst and Budanitsky’s (2005) results using WordNet-based
concept-distance measures (WNetconcept). Best results for each measure-type are shown in boldface.
suspect alarm detection correction correction detection correction
Measure ratio ratio ratio accuracy ratio P R F performance
Distribword
ASDcp 3.36 1.78 5.98 0.84 5.03 7.37 45.53 12.69 10.66
Coscp 2.91 1.64 4.77 0.85 4.06 5.97 37.15 10.28 8.74
JSDcp 3.29 1.77 5.82 0.83 4.88 7.19 44.32 12.37 10.27
Linpmi 3.63 2.15 7.78 0.84 6.52 9.38 58.38 16.16 13.57
Distribconcept
ASDcp 4.11 2.54 10.43 0.91 9.49 12.19 25.28 16.44 14.96
Coscp 4.00 2.51 10.03 0.90 9.05 11.77 26.99 16.38 14.74
JSDcp 3.58 2.46 8.79 0.90 7.87 10.47 34.66 16.08 14.47
Linpmi 3.02 2.60 7.84 0.88 6.87 9.45 36.86 15.04 13.24
WNetconcept
Hirst–St-Onge 4.24 1.95 8.27 0.93 7.70 9.67 26.33 14.15 13.16
Jiang–Conrath 4.73 2.97 14.02 0.92 12.91 14.33 46.22 21.88 20.13
Leacock–Chodrow 3.23 2.72 8.80 0.83 7.30 11.56 60.33 19.40 16.10
Lin 3.57 2.71 9.70 0.87 8.48 9.56 51.56 16.13 14.03
Resnik 2.58 2.75 7.10 0.78 5.55 9.00 55.00 15.47 12.07
Notice that the correction ratio is the product of the detection ratio and correction accuracy. The over-all (single-point) precision P (no. of true-alarms / no. of alarms), recall R (no. of true-alarms / no. of malapropisms), and F-score (2PR
P+R
) of detec-tion are also computed. The product of detecdetec-tion F-score and correction accuracy, which we will call correction performance, can also be used as a bottom-line performance metric.
Table 4 details the performance of Distribword
and Distribconcept measures. For comparison,
re-sults obtained by Hirst and Budanitsky (2005) with the use of WNetconcept measures are also
shown. Observe that the correction ratio results for the Distribwordmeasures are poor compared to
Distribconceptmeasures; the concept-distance
mea-sures are clearly superior, in particular ASDcp and
Coscp. Moreover, if we consider correction ratio to
be the bottom-line statistic, then the Distribconcept
measures outperform all WNetconceptmeasures
ex-cept the Jiang–Conrath measure. If we con-sider correction performance to be the bottom-line statistic, then again we see that the distributional concept-distance measures outperform the word-distance measures, except in the case of Linpmi,
which gives slightly poorer results with concept-distance. Also, in contrast to correction ratio val-ues, using the Leacock–Chodorow measure results in relatively higher correction performance values
than the best Distribconcept measures. While it is
clear that the Leacock–Chodorow measure is rela-tively less accurate in choosing the right spelling-variant for an alarm (correction accuracy), detec-tion ratio and detecdetec-tion F-score present contrary pictures of relative performance in detection. As correction ratio is determined by the product of a number of ratios, each evaluating the various stages of malapropism correction (identifying sus-pects, raising alarms, and applying the correction), we believe it is a better indicator of overall per-formance than correction perper-formance, which is a not-so-elegant product of an F-score and accu-racy. However, no matter which of the two is chosen as the bottom-line performance statistic, the results show that the newly proposed distri-butional concept-distance measures are clearly su-perior to word-distance measures. Further, of all the WordNet-based measures, only that proposed by Jiang and Conrath outperforms the best dis-tributional concept-distance measures consistently with respect to both bottom-line statistics.
6 Related Work
Patwardhan and Pedersen (2006) create aggregate
co-occurrence vectors for a WordNet sense by
an-gle between their aggregate vectors. However, as we pointed out in Mohammad and Hirst (2005), such aggregate co-occurrence vectors are expected to be noisy because they are created from data that is not sense-annotated. Therefore, we employed simple word sense disambiguation and bootstrap-ping techniques on our base WCCM to create more-accurate co-occurrence vectors, which gave markedly higher accuracies in the task of deter-mining word sense dominance. In the exper-iments described in this paper, we used these bootstrapped co-occurrence vectors to determine concept-distance.
Pantel (2005) also provides a way to create co-occurrence vectors for WordNet senses. The lexical co-occurrence vectors of words in a leaf node are propagated up the WordNet hierarchy. A parent node inherits those co-occurrences that are shared by its children. Lastly, co-occurrences not pertaining to the leaf nodes are removed from its vector. Even though the methodology at-tempts at associating a WordNet node or sense with only those co-occurrences that pertain to it, no attempt is made at correcting the frequency counts. After all, word1–word2 co-occurrence fre-quency (or association) is likely not the same as
SENSE1–word2 co-occurrence frequency (or asso-ciation), simply because word1 may have senses other than SENSE1, as well. The co-occurrence frequency of a parent is the weighted sum of co-occurrence frequencies of its children. The fre-quencies of the child nodes are used as weights. Sense ambiguity issues apart, this is still prob-lematic because a parent concept (say, BIRD) may co-occur much more frequently (or infrequently) with a word than its children (such as, hen, ar-chaeopteryx, aquatic bird, trogon, and others). In contrast, the bootstrapped WCCM we use not only identifies which words co-occur with which con-cepts, but also has more sophisticated estimates of the co-occurrence frequencies.
7 Conclusion
We have proposed a framework that allows dis-tributional measures to estimate concept-distance using a published thesaurus and raw text. We evaluated them in comparison with traditional dis-tributional word-distance measures and WordNet-based measures through their ability in ranking word-pairs in order of their human-judged linguis-tic distance, and in correcting real-word spelling
errors. We showed that distributional concept-distance measures outperformed word-concept-distance measures in both tasks. They do not perform as well as the best WordNet-based measures in ranking a small set of word pairs, but in the task of correcting real-word spelling errors, they beat all WordNet-based measures except for Jiang– Conrath (which is markedly better) and Leacock-Chodorow (which is slightly better if we consider correction performance as the bottom-line statis-tic, but slightly worse if we rely on correction ratio). It should be noted that the Rubenstein and Goodenough word-pairs used in the ranking task, as well as all the real-word spelling errors in the correction task are nouns. We expect that the WordNet-based measures will perform poorly when other parts of speech are involved, as those hierarchies of WordNet are not as extensively de-veloped. On the other hand, our DPC-based mea-sures do not rely on any hierarchies (even if they exist in a thesaurus) but on sets of words that un-ambiguously represent each sense. Further, be-cause our measures are tied closely to the corpus from which co-occurrence counts are made, we expect the use of domain-specific corpora to result in even better results.
All the distributional measures that we have considered in this paper are lexical—that is, the distributional profiles of the target word or con-cept are based on their co-occurrence with words in a text. By contrast, semantic DPs would be based on information such as what concepts usu-ally co-occur with the target word or concept. Se-mantic profiles of words can be obtained from the WCCM itself (using the row entry for the word). It would be interesting to see how distri-butional measures of word-distance that use these semantic DPs of words perform. We also intend to explore the use of semantic DPs of concepts acquired from a concept–concept co-occurrence
matrix (CCCM). A CCCM can be created from
the WCCM by setting the row entry for a concept or category to be the average of WCCM row val-ues for all the words pertaining to it.
size only about 800800. This level of
concept-coarseness might seem drastic at first glance, but we have shown that distributional measures of dis-tance between these coarse concepts are quite use-ful. Part of our future work will be to try an inter-mediate degree of coarseness (still much coarser than WordNet) by using the paragraph subdivi-sions of the thesaurus instead of its categories to see if this gives even better results.
Acknowledgments
We thank Afsaneh Fazly, Siddharth Patwardhan, and the CL group at the University of Toronto for their valuable feedback. We thank Alex Bu-danitsky for helping us adapt his malapropism-correction software to work with distributional measures. This research is financially supported by the Natural Sciences and Engineering Research Council of Canada and the University of Toronto.
References
Eneko Agirre and O. Lopez de Lacalle Lekuona. 2003. Clustering WordNet word senses. In Proceedings of the Conference on Recent Advances in Natural Lan-guage Processing (RANLP’03), Bulgaria.
J.R.L. Bernard, editor. 1986. The Macquarie The-saurus. Macquarie Library, Sydney, Australia.
Alexander Budanitsky and Graeme Hirst. 2006. Eval-uating WordNet-based measures of semantic dis-tance. Computational Linguistics, 32(1).
Kenneth Church and Patrick Hanks. 1990. Word asso-ciation norms, mutual information and lexicography. Computational Linguistics, 16(1):22–29.
Martin C. Cooper. 2005. A mathematical model of historical semantics and the grouping of word meanings into concepts. Computational Linguistics, 31(2):227–248.
John R. Firth. 1957. A synopsis of linguistic theory 1930–55. In Studies in Linguistic Analysis (special volume of the Philological Society), pages 1–32, Ox-ford. The Philological Society.
Graeme Hirst and Alexander Budanitsky. 2005. Cor-recting real-word spelling errors by restoring lex-ical cohesion. Natural Language Engineering, 11(1):87–111.
Graeme Hirst and David St-Onge. 1998. Lexical chains as representations of context for the detec-tion and correcdetec-tion of malapropisms. In Christiane Fellbaum, editor, WordNet: An Electronic Lexical Database, chapter 13, pages 305–332. The MIT Press, Cambridge, MA.
Jay J. Jiang and David W. Conrath. 1997. Seman-tic similarity based on corpus statisSeman-tics and lexical
taxonomy. In Proceedings of International Con-ference on Research on Computational Linguistics (ROCLING X), Taiwan.
Claudia Leacock and Martin Chodorow. 1998. Com-bining local context and WordNet similarity for word sense identification. In Christiane Fellbaum, editor, WordNet: An Electronic Lexical Database, chapter 11, pages 265–283. The MIT Press, Cam-bridge, MA.
Lillian Lee. 2001. On the effectiveness of the skew divergence for statistical language analysis. In Arti-ficial Intelligence and Statistics 2001, pages 65–72.
Dekang Lin. 1998. Automatic retreival and clustering of similar words. In Proceedings of the 17th Inter-national Conference on Computational Linguistics (COLING-98), pages 768–773, Montreal, Canada.
Saif Mohammad and Graeme Hirst. 2005. Distributional measures as proxies for semantic relatedness. In submission, http://www.cs.toronto.edu/compling/Publications.
Saif Mohammad and Graeme Hirst. 2006. Determin-ing word sense dominance usDetermin-ing a thesaurus. In Proceedings of the 11th Conference of the European Chapter of the Association for Computational Lin-guistics (EACL), Trento, Italy.
Patrick Pantel. 2005. Inducing ontological co-occurrence vectors. In Proceedings of the 43rd An-nual Meeting of the Association for Computational Linguistics (ACL-05), pages 125–132, Ann Arbor, Michigan.
Siddharth Patwardhan and Ted Pedersen. 2006. Us-ing WordNet based context vectors to estimate the semantic relatedness of concepts. In Proceedings of the EACL 2006 Workshop Making Sense of Sense— Bringing Computational Linguistics and Psycholin-guistics Together, pages 1–8, Trento, Italy.
Roy Rada, Hafedh Mili, Ellen Bicknell, and Maria Blettner. 1989. Development and application of a metric on semantic nets. IEEE Transactions on Sys-tems, Man, and Cybernetics, 19(1):17–30.
Herbert Rubenstein and John B. Goodenough. 1965. Contextual correlates of synonymy. Communica-tions of the ACM, 8(10):627–633.
Hinrich Sch¨utze and Jan O. Pedersen. 1997. A cooccurrence-based thesaurus and two applications to information retreival. Information Processing and Management, 33(3):307–318.
David Yarowsky. 1992. Word-sense disambiguation using statistical models of Roget’s categories trained on large corpora. In Proceedings of the 14th Inter-national Conference on Computational Linguistics (COLING-92), pages 454–460, Nantes, France.