Abstract—In order to improve the automation of stereo warehouse, this paper presented a hybrid extraction method based on multiple material image features. Similarities between the image RGB histogram and target’s histogram was estimated using Bhattacharyya coefficient. Fourier spectrum was used to describe the energy distribution of the texture spectrum. Fourier descriptors represented the coordinates of the materials’ contour. Invariant moments characterized regional invariable features for translation, rotation and scale transform. The experimental results on micro stereo warehouse proved that the proposed method could distinguish different objects quantitatively by examining specific features. Obtained data could be used in following automatic classification processes.
Index Terms— Stereo warehouse, Bhattacharyya coefficient, Texture spectrum, Fourier descriptor, 7Hu invariant moment
I. INTRODUCTION
With the improvement of the technology and the rapid development of the logistics industry, Stereo warehouse has entered to the 5th generation since its first appearance in the
States in 1959 [1]. Automation, intelligence and integration constitute its main features. Recently, both WLAN and RFID have been utilized in mass storage and transportation industry, which raises the automation level of stereo warehouse and effectively reduces the labor cost [2]. Increasing number of technologies are being applied to the storage process, which would induce the development of new stereo warehouse, and generate a new research area.
Being integrated with conventional optical devices, developed image processing technology and advanced machine vision technology, industrial camera has been applied into the area of mechanical manufacturing as the ‘eyes’ of the traditional equipment, especially for the processes involving object detection and identification [3]. In this paper, the image information was first collected through the image capture device. The image features of objects were then analyzed through hybrid digital image processes. The result proved that the proposed method can effectively distinguish different objects by examining quantitative image features. Those characterized feature information would be easy to use for future automatic material identification and classification. The image features discussed in this paper were color feature, texture feature, contour feature and regional feature.
Color feature is a global feature which is regarded as a
This work is supported by the National Science Foundation of China(Grant No. 60970021)
W-l. Wang, W. Y, Y-w. Zhao
College of Computer Science and Technology, Zhejiang University of Technology, Hangzhou, Zhejiang 310014, China
(email:[email protected], [email protected], [email protected])
commonly used feature in object recognition. It describes the corresponding color distribution of an image/region. The feature will not be affected by image rotational or translational motions, but the partial color inaccuracy. Color feature histograms combined with Bhattacharyya coefficient were used to distinguish the similarities between color features of different objects. This technology had been successfully used in real-world object tracking process [4]-[6]. Texture feature describes the properties of surface which the image/region corresponds to. Since this property is relatively stable in a small region, rotational motions will also not affect this feature. Thus, it can be considered as an effective detecting feature for the images with stable resolutions. The Fourier spectrum of texture measurement can effectively identify the overall texture pattern in the frequency domain, and subsequently distinguish the periodic and non-periodic texture patterns [7]-[9]. Contour feature represents the shape of materials, which can be observed visually. The accuracy of contour measurement is affected by the image noises. The noises must be reduced as much as possible in a pre-processing stage without affecting integrity of the contour. Fourier descriptors are widely used in target boundary recording in practical target recognition [10]-[12]. Regional feature is characterized by region internal features. When describing the region feature with invariant moments, the feature is invariable regarding image translation, rotation and scaling [13]-[15].
II. HYBRID EXTRACTION METHOD OF IMAGES MULTIPLE FEATURES
A Extraction Method of Color Feature
Currently, the extraction method of color feature is to convert the RGB into grayscale, and count the probability distribution of image pixels in the gray-scale range 0-255. However, a statistical histogram method was used in this paper, which was based on the RGB model. After the color probability distribution function of an ordinary RGB image was obtained, the final result was given by measuring and comparing the similarities between the histograms of the target image and a candidate image through calculated Bhattacharyya coefficient [16].
RGB model is the most common expression method of color information, which gives variety of colors by superpositioning red, green and blue light. The storage content in a color image is an M × N × 3 arrays. M stands for the length; N stands for the width of the image pixels; and the number 3 corresponds to the three-color value of RGB for each pixel. Since the image provided by the color industrial camera is based on RGB model, the histogram was calculated by using following normalized formula:
Research of Hybrid Extraction Method Based
on Multiple Image Features of Materials for
Stereo Warehouse
I I I R G B histR pixels histG pixels histB pixels = = = (1)
In which,
(
Ι Ι ΙR, ,G B)
represented the corresponding RGB three-color value of each pixel in this color image.pixelsindicated the image size.
[
histR histG histB, ,]
werethe probability distribution vectors of the histogram after the image normalization.
After obtaining the histogram of both target and candidate images, we measured the similarities between these two histograms by calculating the Bhattacharyya coefficient. The formula was given as follows:
(
)
ˆ( ) pˆˆˆˆ( ),q pu( )qu
ρ Ι =ρ Ι =
∑
Ι (2)where ρˆ
( )
Ι represented the Bhattacharyya coefficient of ˆq (the target image histogram vector) and pˆ
( )
Ι (hecandidate image histogram vector). The interval of this coefficient ρˆ
( )
Ι was 0-1. The closer to one, the more similarities they had.B Extraction Method of Texture Feature
Image texture could be considered as the characteristic of spatial distribution function of the gray-scale image pixels, while the color feature was only a probability distribution function. The spatial distribution was relatively stable, and not sensitive to the noises. However, texture feature would have a greater change with respect to changes in pixel size. Since the periodic and non-periodic texture features could be effectively distinguished in the frequency-domain space, the extraction method of texture feature in this paper was based on the Fourier spectrum [17].
The assumption was that f x y
(
,)
was an image withthe size of M × N. In this function,x=0 1 2, , , , M−1and
,
y=0 1 2, , , N−1. Two-dimensional discrete Fourier
transform of f could be expressed as F u v
( )
, , andcalculated as follows [18]:
( )
, M 1 N 1(
,)
j 2 (ux M vy N/ / ) x 0 y 0F u v f x y e π
− −
− +
= =
=
∑ ∑
(3)Meanwhile, R u v
( )
, represented the real part of( )
,F u v and I u v
( )
, represented the imaginary part. Thus,the Fourier spectrum could be defined as [18]
( )
( )
( )
/, 2 , 2 , 1 2
F u v =R u v +I u v (4)
After getting the Fourier spectrum of the image, polar coordinates were applied to represent the spectrum function S. Using r to present frequency, θ to present direction, the spectrum function could be calculated by the following formulae [18]:
( )
( )
0
S r S r
π
θ θ=
=
∑
(5)( )
R0( )
r r 1
S θ S θ
=
=
∑
(6)In which, R0 was the radius of a circle which centered
at the origin. S r
( )
represented the spectral energydistribution in R0 . S
( )
θ represented corresponding spectral energy distribution for each increment of one degree, in the range of 1 to 180 degrees centigrade.C Extraction Method of Contour Feature
Usually there are some objects having similar color and texture features but in different shapes. Thus the contour feature is considered as another important image feature of the object, which can effectively depict the image. Zahn first introduced Fourier descriptor to describe the contour of objects, and used it for object recognition [19]. Obtained descriptors coefficient by Fourier transform would maintain a high accuracy after the inverse transform. Therefore, we used Fourier descriptor to describe the contour of the material in this paper. The coordinates of each point were vectorized in order to facilitate image recognition in the following steps.
For each image, the contour could be considered as a combination of a number of two-dimensional coordinate-pairs. Departing from any pair and going along the contour, it would return to the starting point eventually. With equation (3), the Fourier descriptors were defined as [19]:
( )
n 1(
,)
j 2 mi n/i i i 0
FD m f x y e π
−
− =
=
∑
(7)where m=0 1 2, , , , n 1− represented this contour
constituted by n coordinate-pairs. f x y
(
i, i)
represented that the value of each coordinate-pairs, FD m( )
={FD 0( ),( ), , ( )}
FD 1 FD n 1− were the Fourier descriptors of the
contour. The Fourier descriptors could be re-expressed as the shape of the contour by applying inverse Fourier transform. The formula was as follows [18]:
(
)
( )
/ˆ , n 1
j 2 mi n i i
m 0
1
f x y FD m e n
π
− =
=
∑
(8)In the Fourier transform above, high frequencies determined the details of the image; low frequencies determined the shape of the image [18]. Therefore, we used different numbers of Fourier descriptors for inverse Fourier transform through experiments. We measured the similarities between the actual coordinate-pairs and the coordinate-pairs after inverse transform using the Euclidean distance:
(
) (
)
(
, ˆˆ ,)
(
(
,) (
,)
)
i i i i i i i i
Euclidean= f x y −f x y Τ f x y −f x y (9)
In which, f x yˆ
(
i, i)
represented the coordinate-pairs of material contour after the inverse transform, and(
i, i)
f x y represented the actual coordinate-pairs of the
contour after image pre-processing. As the numbers of Fourier descriptors changed in the inverse transform, the Euclidean distance correspondingly varied. The smaller value of Euclidean distance indicated that smaller impact on the coordinate-pairs during the transform.
D Extraction Method of Regional Feature
Table 1 The Bhattacharyya coefficient of the histograms
and other image transformations, it was used for the description of image regional feature.
In this paper, we considered the whole image that contained material as a regional feature, and then calculated the feature with Hu’s invariant moments. The feature was described by f x y
(
,)
. Its(
p+q)
-order moments weredefined as:
(
, , ,)
, , , p qpq x y
moments =
∑∑
x y f x y p q=0 1 2 (10)The corresponding central moments were defined as:
(
) (
p) ( )
q , , , , , , pqx y
centroid =
∑∑
x x− y y− f x y p q 0 1 2= (11)where, 10, 01
00 00
moments moments
x y
moments moments
= = were the center
of gravity coordinates of the image. The normalized
(
p+q)
-order central moments of f x y(
,)
were definedas: , , , , , pq pq 00 centroid
p q 0 1 2
centroidγ
µ = = (12)
In which, p q 1 p q, , 2 3 4, , ,
2
γ = + + = . The invariant
moments of image region f x y
(
,)
were obtained bycalculating the 2nd and 3rd central moments. Representing
[image:3.595.41.290.64.240.2]with the variable inv ii, =1 2, , ,7 [20]:
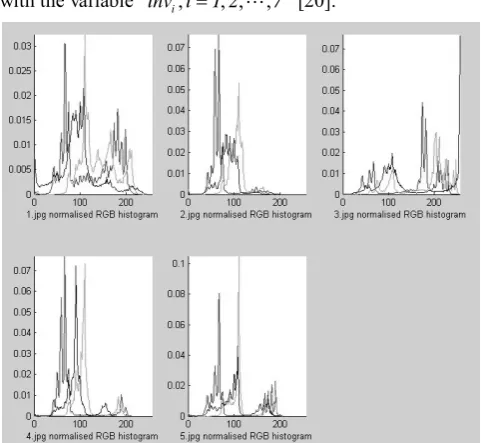
Fig. 2 The RGB histogram of the Images of the materials
(
)
(
) (
)
(
) (
)
(
)(
) (
)
(
)(
) (
) (
)
(
) (
) (
)
( )1 20 02
2 2
2 20 02 11
2 2
3 30 12 21 03
2 2
4 30 12 21 03
2 2
5 30 12 30 12 30 12 21 03
2 2
21 03 21 03 30 12 21 03
2 2
6 20 02 30 12 21 03
11 30
inv
inv 4 inv 3 3 inv
inv 3 3
3 3
inv 4
µ µ
µ µ µ
µ µ µ µ
µ µ µ µ
µ µ µ µ µ µ µ µ
µ µ µ µ µ µ µ µ
µ µ µ µ µ µ
µ µ = + = − + = − + − = + + + = − + + − + + − + + − + = − + − + +
(
)(
)
(
)(
) (
)
(
)(
) (
)
( ) ( )12 21 03
2 2
7 21 03 30 12 30 12 21 03
2 2
12 30 21 30 30 12 21 03
inv 3 3
3 3
µ µ µ
µ µ µ µ µ µ µ µ
µ µ µ µ µ µ µ µ
+ + = − + + − + + − + + − + (13)
III. EXPERIMENTAL RESULTS AND ANALYSIS In this paper, we used the available equipment in our laboratory to verify these four feature extraction methods mentioned above. The existing hardware devices included Googol Technology micro stereo warehouse AWH-MB-2003, color industrial cameras Jai RMC-6740GE and a portal frame to fix the camera. During the experiments, the camera was fixed right above the switchboard of stereo warehouse (belt dimensions: Length: 23.5CM, Width: 8CM), captured the materials on the conveyor by adjusting the focal of lens. The images mainly reflected the information in two-dimension because the images were taken only when the material was located beneath the optical center of the lens. Although those images couldn’t effectively express three-dimensional information of the object, they were still chosen because three-dimensional information is more sensitive to the shooting angle than flat information. Five different object images (image size: 640 pixels × 480 pixels) examined through these four feature extraction methods were shown in Fig. 1.
A Color feature extraction of RGB histogram
The first step in the experiment was to extract the color feature. The resolution of each image was 640 × 480. Then we calculated the normalized RGB color histogram of material images according to (1) to obtain Fig. 2. In the Figure, the color distribution of each image was different from one another. Thus, the corresponding objects could be distinguished with this algorithm. To obtain Table 1, we took the RGB histogram as an image's color feature and calculated the Bhattacharyya coefficient between every two objects using equation (2).
Data from Table 2 showed that if the coefficient value was closer to 1, more similarities existed. It was found in the initial material images that the color distributions of image 1 and 3 were greatly different from those of image 2, 4 and 5. The corresponding coefficients of image 1 and 3 were in the range of 0.4 to 0.6, while the coefficients of
Fig. 1 Five kinds of Objects Images Bhatt
achar yya coeff icient
1.jpg 2.jpg 3.jpg 4.jpg 5.jpg
[image:3.595.47.288.529.750.2] [image:3.595.332.534.724.777.2]Table 2 The Euclidean distance of Fourier descriptors
image 2, 4 and 5 were in the range of 0.8 to 0.9. The reason that coefficients of image 2, 4 and 5 were constantly larger was due to greater background-to-object ratios in those pictures. Thus, it could be concluded that the extraction method of color feature will be affected by the background, when the size of object was relatively small, i.e. high ground-to-object value. However, this method was still effective in distinguishing different materials.
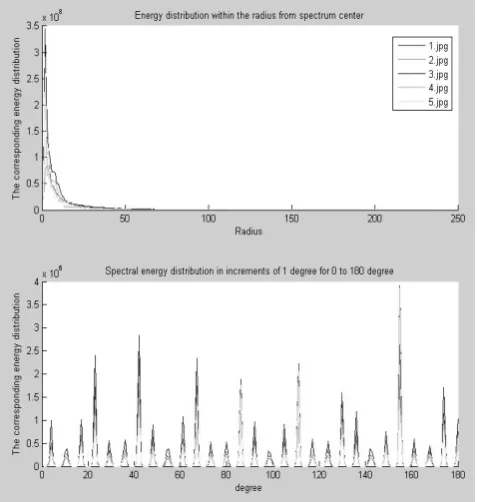
B Texture feature extraction of Fourier spectrum
The second step was to extract the texture features. The spectrum radius was 240 pixels. Using equation (5) and (6), we obtained the texture spectral energy distribution of these materials (Fig. 3). Different spectrum properties and periods were distinguished by tracing corresponding energy function curves. The energy distributions of these five different materials were in great differences within the spectrum radius. The difference level was particularly high in the upper part of Fig. 3. Therefore, this experiment proved that this Fourier spectrum based texture feature extraction method was an access to the expected results.
C Contour feature extraction of Fourier descriptor
[image:4.595.48.287.498.749.2]The third step was to extract the contour feature. We first pre-processed data from Fig. 1 through a 25 by 25 Gaussian lowpass filter with the standard deviation of 15 to smooth the noise. Then all new data points were converted into binary images with the algorithm of automatic threshold processing (Fig. 4). The combination of previous filtering and converting steps was the pre-process stage of contour extraction.
Fig.3 Fourier spectral energy distribution of these materials image
Subsequently, the obtained binary images were used as the extraction objects for the Fourier descriptors. We calculated the corresponding descriptors FD m
( )
fordifferent materials in Fig. 4, using equation (7). The numbers in parentheses listed in Table 2 were the numbers of coordinate-pairs for different material contours, i.e. the
( )
FD m values. During the inverse transform process, we
calculated the corresponding coordinate-pairs values using equation (8), with the proportional relation to the FD m
( )
values. Finally, the Euclidean distances were obtained by applying equation (9), and the calculated data were shown in Table 2.
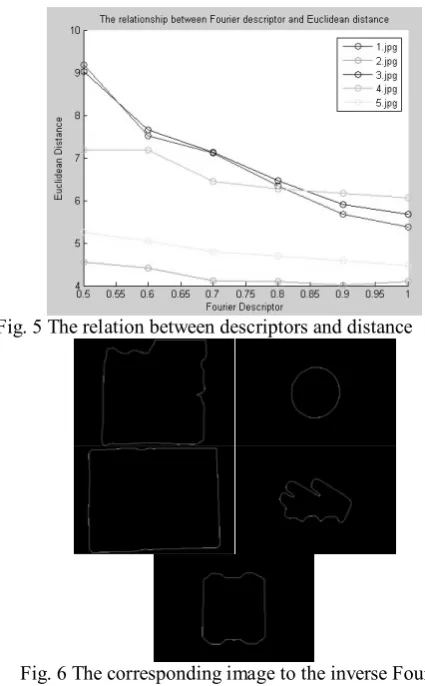
From the table above, it is found that if we reduce the number of used Fourier descriptors in inverse transform, the corresponding Euclidean distances given by equation (9) would gradually increase, with the increasing amount of change in amplitude. It was found that the corresponding amplitude changes in the region of 50% to 10% largely surpassed the changes in 100% to 50% region. Fig. 5 showed the relationship between calculated Euclidean distance and percentage use of Fourier descriptors. The purpose of plotting the graph was to obtain a relative stable percentage of descriptor use for following analysis. By combining information of all five data sets, we chose 70% of original Fourier descriptor number as the reference for future use. Therefore, the material contours were calculated with 70% of descriptors, and the result was shown in Fig. 6. In this figure, we found that in the binary image set, object contour of image 1 had differed from Fig. 1. That was mainly because the signal differences between object and background in the original image data set hadn’t been well pre-smoothed, due to the similarity in color. However, other results showed that this method would still be able to effectively represent actual contours of the objects, which could be used as feature vector for further classifications.
Fig. 4 Pre-process binary images of these materials
Euclidean 100% 90% 80% 70% 60% 50% 40% 30% 20% 10%
[image:4.595.344.512.586.750.2]Table 3 7Hu invariant moments of these materials image
D Regional feature of 7Hu invariant moments
Finally, the regional feature was extracted by applying the invariant moment. Regional feature f x y
(
,)
was avariable used in reading image. According to equation (10)-(12), we obtained the 2nd and 3rd order central moment
of the image region, followed by calculating the seven invariant moments of these materials with equation (13). Since the values of invariant moments were relatively too large for comparison, we calculated the corresponding log values of the moments and listed them in Table 3. Paper [13]-[15] and [20] had proved that these seven invariant moments have invariability for image rotation, translation and other transformations. Hence, we used this characteristic to distinguish different materials images. Table 3 showed that these moments varied significantly with different objects, which could be used to characterize the regional feature.
Data from all the four experiments listed above indicated that the proposed extraction method had achieved desired results by giving notable differences between objects. Those features could be considered as the important basis for practical object identification and characterization.
[image:5.595.49.262.424.767.2]Fig. 5 The relation between descriptors and distance
Fig. 6 The corresponding image to the inverse Fourier transformation
IV. CONCLUSION
This paper proposed a method of obtaining object features in stereo warehouse through hybrid extraction of multiple image features, and proved the feasibility of the methodology by analyzing the experiments data. Although the practical state-of-art of object identification these days is still using the sophisticated RFID technology, with the popularization progress of optical devices and continuous development in vision technology, “optical eyes” used in mass transportation and identification processes can largely improve the automation intelligence of stereo warehouse. Accordingly, this paper could be considered as a practical research of image processing. The industrial camera was used for the data acquisition, combined with automatic image-based approach to extract color, texture, contour and regional feature. Those quantitative features were applied to classify the different objects, and consequently facilitated the integration of the management of stereo warehouse with automation technology to raise the level of automation and intelligence of stereo warehouse. In feature, we plan to construct the classifier through this multiple image features.
ACKNOWLEDGEMENT
This work is supported by the National Science Foundation of China(Grant No. 60970021).
REFERENCES
[1] Graves S.C., Hausman W.H. and Schwarz L.B.. “Storage retrieval interleaving in automatic warehousing system,” Management Science, 1977,23(9):935-945
[2] Chalasani S., Boppana R.. “Data Architectures for RFID Transactions,” IEEE Transactions on Industrial Informatics, vol. 3, no. 3, 2007:246-257
[3] Tomko Steve, Hornis Helge and Fuchs Pepperl. “The “Eyes” of automated storage and retrieval,” Electronic Component News, 2009,53(5):37-37
[4] Comaniciu D., Ramesh V., Meer P.. “Kernel-based object tracking,” IEEE Transactions on Pattern Analysis and Machine Intelligence, 2003, vol.25(5):564-577
[5] Rastegar S., Babaeean A., Bandarabadi M.. “Metric distance transform for kernel based object tracking,” 41st Southeastern
Symposium on System Theory, 2009:54-58
[6] Nilsson M., Bartunek J.S., Nordberg J.. “On histograms and spatiograms – introduction of the mapogram,”15th IEEE
International Conference on Image Processing, 2008:973-976 [7] Jiuwen Zhang, Xiaojun Li, Yide Ma. “Discriminating Structure and
Random Texture Images with Binary Fourier Spectrum for Invariant Texture Retrieval,” Asia-Pacific Conference on Information Processing,2009, vol. 2:168-172
[8] Jie Zhang, Xianglin Huang, Hui lv. “Character Retrieval Based on the Improved Contour Feature and Texture Feature,”. International Conference on Management and Service Science,2009:1-3 [9] O’Callaghan R.J., Bull D.R.. “A scale invariant distance measure
for texture retrieval,” International Conference on Image Processing, 2002, vol.1:425-428
[10] Wang Tao, Liu Wenyin, Sun Jiaguang and Zhang Hongjing. “Using Fourier Descriptors to Recognize object’s shape,” Journal of Computer research and development, 2002, vol. 39, No.
log inv1 inv2 inv3 inv4 inv5 inv6 inv7
12:1714-1719
[11] Kunttu I., Lepisto L.. “Shape-based retrieval of industrial surface defects using angular radius Fourier descriptor,” IET Image Processing, 2007, vol.1, No.2:231-236
[12] El-ghazal A., Basir O., Belkasim S.. “A novel curvature-based shape Fourier Descriptor,” 15th IEEE International Conference on Image
Processing, 2008:953-956
[13] Hongbo Mu, Dawei Qi. “Pattern Recognition of Wood Defects Types Based on Hu Invariant Moments,” 2nd International Congress
on Image and Signal Processing, 2009:1-5
[14] Devendran V., Thiagarajan H., Santra A.K., Wahi A.. “Feature Selection for Scene Categorization Using Support Vector Machines,” Congress on Image and Signal Processing, 2008:588-592
[15] Lei Zhang, Jiexin Pu, Jia Yu.. “Object recognition based on modified invariant moments,” International Conference on Mechatronics and Automation, 2009:2542-2547
[16] Kailath T..” The Divergence and Bhattacharyya Distance Measures in Signal Selection,” IEEE Transaction on Communication Technology, 1967, vol. 15(1):52-60
[17] Chi-Ho Chan, Pang G. “Fabric defect detection by Fourier analysis,” 34th Industry Application Conference, 1999,
vol.3:1743-1750
[18] R.C. Gonzalez, R. E. Woods, S. L. Eddins. Digital Image Processing Using Matlab. Prentice Hall, 2005,ch4,11
[19] C. T. Zahn, R. Z. Roskies. “Fourier Descriptors for Plane Closed Curves,” IEEE Transactions on Computers, 1972, vol. 21, No. 3:269-281