Estimation of Scale (
) and Shape
(α)
Parameters of
Power Function Distribution by Median Ranks
Regression Method using Optimally Constructed
Grouped Data
O. V. Raja Sekharam1, M. Vijaya Lakshmi2, G.V. S. R. Anjaneyulu3
1, 2
Research Scholar(BSRRFSMS), 3Professor, Department of Statistics,Acharya Nagarjuna University, Guntur, Andhra Pradesh, India.
Abstract: The objective of this paper is to estimate the parameters and also construct an Optimal Grouped sample in the absence of prior knowledge or guess values of parameters. In this heuristic algorithm, the Median Ranks Regression Method is used to find out Estimates the parameters of Power Function Distribution. We also computed Average Estimate (AE), Variance (VAR), Mean Absolute Deviation (MAD), Mean Square Error (MSE), Relative Absolute Bias (RAB) and Relative Efficiency (RE) for both the parameters under grouped sample based on 1000 simulations to assess the performance of the estimators.
Keywords: Power Function Parameters, Optimally Grouped sample, Median Ranks Regression
I. INTRODUCTION
Rider (1964) the name Power Function Distribution has been used. Johnson (1970) given that the moments of the power function distribution are simply the negative moments of the Pareto distribution. Ahsanullah and Kabir et al (1975) discussed the Estimation of the location and scale parameters of a Power function distribution. According to Dallas et al (1976), if Y is power function distribution then Y-1 is the Pareto distribution model. Cohen and Whitten et al (1980) used the estimation in the three parameter lognormal distribution.
Rosaiah et al (1991) studied the problem of asymptotically optimal grouping of sample into equiclass grouped sample for maximum likelihood estimation in two parameter gamma distribution. Vasudevarao et al (1994) considered the problem of asymptotically optimal grouping for maximum likelihood estimation in a two parameter Weibull distribution in the case of equispaced group. They also studied the same for maximum likelihood estimation of Weibull shape parameter when scale parameter is known in the case of unequispaced grouped samples.
Meniconi and Barry et al(1996) explore the performance of Power function distribution on electrical components and illustrated that power function distribution is most suitable distribution on electrical component data as compared to log-normal,Weibull and exponential models.
Theoretically, Kleiber et al (2003) studied power function distribution has an inverse relationship with the standard Pareto distribution, and it is also a special case of Pearson type I distribution.
Saran & Pandey et al (2004) estimate the parameters of Power Function Distribution and they also characterize this distribution. Balakrishna et al (2004) and Kantam et al (2005) constructed the Optimum group limits for un-eqi-spaced grouped sample using M. L. Estimation in Scaled Log-Logistic distribution.
Reliability Hotwire- The e-Magazine et al (2007) had mentioned the Correlation Coefficient tool in ‘How our weibull distribution be good’.CH. Rama Mohan et al (2011) Studied Least Square Estimation of the Weibul parameters from an optimally constructed grouped sample.
Rahman, Roy & Baizid et al (2012) applied the Bayesian estimation method to estimate the parameters of Power Function Distribution. Zarrin et al (2013) applied power function distribution to assess component failure of semi-conductor device data by using both the maximum likelihood and Bayesian estimation methods.
Accelerated Life Test Modeling Using Median Rank Regression (2016) discussed by Austin J. Rhodes. Vijaya lakshmi et al (2018), studied the Estimation of Location (µ) and Scale (λ) for Two-Parameter Rayleigh Distribution by Median Rank Regression Method. Vijaya lakshmi, O. V. Raja Sekharam and G. V. S. R. Anjaneyulu (2018) proposed Estimation of Scale () and Shape (α)
Parameters of Power Function Distribution by Least Square Method Using Optimally Constructed Grouped Data. Vijaya lakshmi and Anjaneyulu studied Estimation of Location (µ) and Scale (λ) for Two Parameter Half Logistic Pareto Distribution (HLPD) by
Median Rank Regression Method. The literature mentioned above, reveals that much attention seems to have been paid for inference based on grouped data from two parameter Power Function distribution. In this, when we have no prior Knowledge about the unknown parameters that we used to construct an asymptotically Optimal Groped Data, which can be used to estimation of parameters using Median Ranks Regression Method. The optimal group limits of a grouped sample from two parameter Power Function distribution constructed which are presented at the in the chapter as Table 4.7. Here we developed a practical procedure to construct an optimally grouped sample even when there is no prior knowledge or guess values of the parameters are given in section 4.2. In section 4.3 we made an attempt to study some problems of point estimation from grouped data based on Power Function distribution. The Median Ranks Regression method was used to estimate the parameters from such an optimally constructed grouped sample in two parameter Power Function distribution using the optimal group limits constructed and The Average Estimate (AE), Variance (VAR), Mean Square Error (MSE), Relative Absolute Bias (RAB) and Relative Error (RE) of the Scale parameter
() and Scale (α) are calculated for assessing the performance of the estimated parameters.
Let y1, y2, …,yn be a raw sample of size ‘n’ dawn from two-parameter Power Function distribution with unknown scale() and
shape(α) parameters. The Probability density (p.d.f.) and cumulative distribution function (c.d.f.) of Power Function distribution
are respectively given by f(y; , α) =
,0 < y < , α > 0, > 0 (1.1.1)
F(y; , α)= , 0< y < , α > 0, >0 (1.1.2) F(Xi) = .
. ; i = 1,2,3,…,k
II. OPTIMALLY CONSTRUCTED GROUPED SAMPLE
In this section, we develop a practical procedure to construct an optimally grouped sample in the case when there is no a priori knowledge or guess values of the parameters. In this procedure, we will prefix the number of test units to be failed in each group of the optimal grouped sample and then we record some arbitrary time point after failure of the number of the test units that are to be failed in that group, but before starting the failure of a test unit in the next group. Suppose N is the number of test units put under a life-testing experiment which assumes the Power model (4.1.1) and suppose the experimenter wishes to obtain the grouped life-time data with k classes. Then Table 4.7 can be used to compute the expected number of test units to be failed in the time interval (ti-1, ti) and is given by
fi = Npi ; For i= 1, 2, …, k (1.2.1) Where pi =
[(x ) −(x ) ]
and F(Xi) = .
. ; i = 1,2,3,…,k
1) fi is expected number of failures in the ith interval
2) xi‘ s are optimal group limits obtained from the above procedure
3) k is number of groups
4) N is total frequency
III. METHODOLOGY
A. Median Ranks Regression Estimation Of The Parameters From The Optimally Constructed Equispaced Grouped Sample
We know that t1, t2, …, tk-1the group limits of te optimally constructed grouped Sample using the procedure explained in the above section, are the observed values of the true asymptotic optimal group limits x1,x2, …, xk-1 where as their estimated values are given by
y = (x ) (1.3.1)
where and are obtained by using the principle of Median Ranks Regression method (MRR) is extensively used in reliability engineering and mathematics problems. According to the Median Ranks Regression method (MRR) linear relation between the two parameters taking the natural logarithm of above equation as follows
log t = log( ) + log(x ) for i= 1, 2, …, k-1 (1.3.2) After simplification, we get
Y = log t, A = log( ) , B = ,X = log(x )
Thus, equation (1.3.2) is a linear equation and is expressed as Y = A+BX
To compute a and d by simple linear regression we proceed as follows Let S(A, B) =∑ y – A−Bx (4.3.3)
Differentiating (1.3.3) w.r.t to A and B then equate to zero, we obtain the following two normal equations ∑ y = nA + B ∑ x (1.3.4)
∑ x y = A∑ x + B ∑ x (1.3.5)
Solving the above two equations for A and B, we obtain the Median Ranks Regression estimates (MRRE) of A and B as:
A = y− B x
B =
∑ x y − ∑k−x y1
∑ x − ∑k−1x
A =∑ − B ∑ (4.3.6)
B =∑ ( )( )
∑ ∑
∑ ( ( )) ∑
(1.3.7)
where A = log() and B =1
α
Therefore = Antilog ∑ − B ∑ (1.3.8)
and α= ∑ ( ( ))
∑
∑ ( )( ) ∑ ∑
(1.3.9)
The rationale for applying least square method is that for a given k, xi’s, are fixed values and are can be borrowed from Table 1.5 where as ti’s are random values and are obtained as observations from the experiment. . It may be noted that the least square estimates, and αobtained from the equations (1.3.8) and (1.3.9)
Performance Indices: Goodness of Fit Analysis:
B. Comparison of Median Ranks Regression estimators of Equispaced and Unequispaced Optimally Constructed Grouped Data
we compare with the corresponding equispaced least square estimators obtained from ungrouped sample as well as asymptotically optimal grouped sample based on variance.
If ̂ is Median Ranks Method estimate of , m=1, 2 where is a general notation that can be replaced by =, =α based on sample l,(l=1,2,…,r) then The Average Estimate (AE), Variance (VAR), Standard Deviation (STD), Mean Square Error (MSE) and Relative Absolute Bias (RAB) are given respectively by
Average Estimate ( ) =∑
Variance ( ) = ∑ ( )
Standard Deviation ( ) = ∑ ( ) Mean Absolute Deviation = ∑ ( )
Mean Square Error ( ) = ∑ ( )
Relative Absolute Bias ( ) = ∑ ( )
IV. CONCLUSION
A. Variances of the estimators are decreasing as number of groups increases.
B. The estimates obtained from optimal grouped sample with equispaced efficient than the unequispaced sample when number of sample increaases .
C. When compared with small sample, the estimators in large sample are more efficient. Random Generated values of Power Function Distribution
V. AN ILLUTRATION
A random sample of 200 observations is generated from a two-parameter Power function distribution with the = 4, α = 3 using R Software and the ordered sample is given below:
0.5643 0.68283 0.6911 0.97532 1.03033 1.27493 1.34438 1.35793 1.37605 1.39571
1.42772 1.50664 1.56168 1.58275 1.60049 1.61385 1.68193 1.73975 1.75911 1.7654
1.83026 1.85858 1.86084 1.92251 1.94428 2.03693 2.03803 2.06997 2.10523 2.13578
2.19005 2.20756 2.23161 2.24989 2.26332 2.33308 2.34107 2.36156 2.3817 2.40646
2.4133 2.45333 2.50304 2.53859 2.54071 2.54162 2.54213 2.54796 2.56023 2.58833
2.59008 2.61792 2.63247 2.63397 2.65159 2.67836 2.67836 2.6893 2.75054 2.76331
2.76442 2.77519 2.80024 2.82289 2.83388 2.83857 2.84116 2.86014 2.868 2.87637
2.88053 2.88664 2.89171 2.90234 2.91327 2.95076 2.95896 2.96527 2.96534 2.98169
3.01012 3.03096 3.04479 3.06924 3.07366 3.10118 3.10186 3.13844 3.14714 3.15311
3.15971 3.16642 3.17645 3.19837 3.20965 3.21275 3.22231 3.22369 3.23461 3.24516
3.24584 3.2595 3.26726 3.2819 3.28449 3.28751 3.29124 3.29244 3.32526 3.32797
3.33478 3.34447 3.36305 3.36713 3.37726 3.38011 3.40641 3.40971 3.42271 3.47709
3.49269 3.49684 3.50285 3.50878 3.51047 3.51507 3.51686 3.52939 3.545 3.55111
3.55214 3.55719 3.56012 3.56186 3.56407 3.56683 3.57097 3.58855 3.59229 3.60441
3.6154 3.61878 3.63457 3.64284 3.64416 3.65282 3.65861 3.67522 3.67527 3.67835
3.68766 3.69621 3.70747 3.70814 3.71659 3.71664 3.72201 3.72356 3.72731 3.72993
3.73866 3.74076 3.75794 3.78971 3.79003 3.80214 3.80245 3.80866 3.81381 3.82305
3.83982 3.85074 3.85438 3.85736 3.85819 3.86068 3.86748 3.86774 3.87422 3.87664
3.87924 3.89823 3.899 3.90011 3.90276 3.90447 3.93014 3.93452 3.93813 3.94383
3.95693 3.9571 3.95997 3.963 3.96734 3.96892 3.98111 3.98165 3.98829 3.99695
rouped the above data into an optimally grouped sample with 10 groups as explained below.
Here, we have N= 200 and k= 10. From Table -5.1 for k=10, asymptotic optimal group limits are x1= 0.5987 , x 2= 0.9875,
Table 5.2. Optimally Constructed Groups of a sample for Power Function Distribution
optimal class interval Frequency(fi) Cumulative frequency
0-0.5987 2.96≈3 3
0.5987-0.9875 11.85≈12 15
0.9875-1.09899 39.02≈39 54
1.09899-1.2576 19.24≈19 73
1.2576-1.7954 21.36≈21 94
1.7954-1.9879 38.33≈38 132
1.9879-2.0583 22.41≈22 154
2.0583-2.321 11.56≈12 166
2.321-2.5214 11.22≈11 177
>2.5214 23.45≈23 200
Now we compute the expected frequencies f1, f2, f3, f4, f5, f6, f7 f8, f9, f10 which can be obtained by using above values in (
5.2.1) and are given by
f1= 3, f2=12, f3=39, f4=19, f5 = 21, f6 =38, f7 =22, f8 =12, f9 =11, f10=23
Now we have to choose t0=0, t1 t2, t3,…,t10=∞ such that fi (for i= 1,…,10) observations have fallen in the interval (ti-1,ti).
Here, t1 is chosen as a random value in between 3rd and 4th order observation. Similarly t2 is chosen as a random value in
between 15th and 16th order observation t3 and soon t9 observation choosen same as their respective random order values.
Thus we get t1=3.3713, t2=3.9832, t3=4.1278, t4 =4.3176, t5=4.8616, t6 =5.0295,t7=5.0882, t8 =5.2960, t9=5.4442.
Tale 5.2
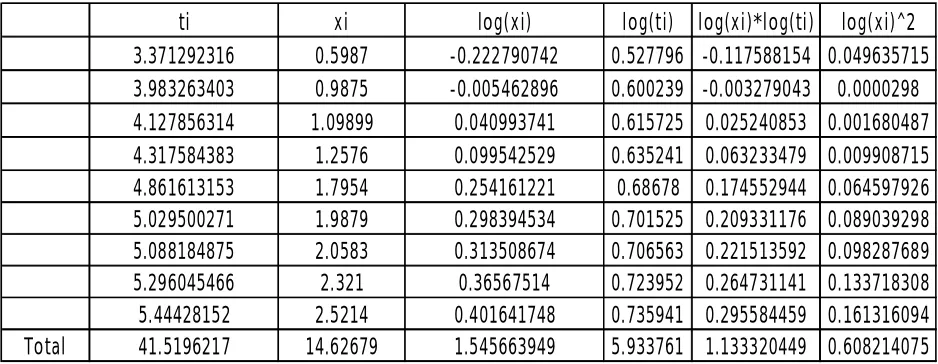
The least square estimation of Power function distribution from the above optimally constructed grouped data can computed as follows
ti
xi
log(xi)
log(ti)
log(xi)*log(ti)
log(xi)^2
3.371292316
0.5987
-0.222790742
0.527796 -0.117588154 0.049635715
3.983263403
0.9875
-0.005462896
0.600239 -0.003279043
0.0000298
4.127856314
1.09899
0.040993741
0.615725 0.025240853 0.001680487
4.317584383
1.2576
0.099542529
0.635241 0.063233479 0.009908715
4.861613153
1.7954
0.254161221
0.68678
0.174552944 0.064597926
5.029500271
1.9879
0.298394534
0.701525 0.209331176 0.089039298
5.088184875
2.0583
0.313508674
0.706563 0.221513592 0.098287689
5.296045466
2.321
0.36567514
0.723952 0.264731141 0.133718308
5.44428152
2.5214
0.401641748
0.735941 0.295584459 0.161316094
Total
41.5196217
14.62679
1.545663949
5.933761 1.133320449 0.608214075
The median ranks estimate of Power function parameters , α from the above optimally constructed grouped sample can be computed as follows from the equation (1.3.8) and (1.3.9) the least square estimates are = 2.065176317, = -0.383769847.
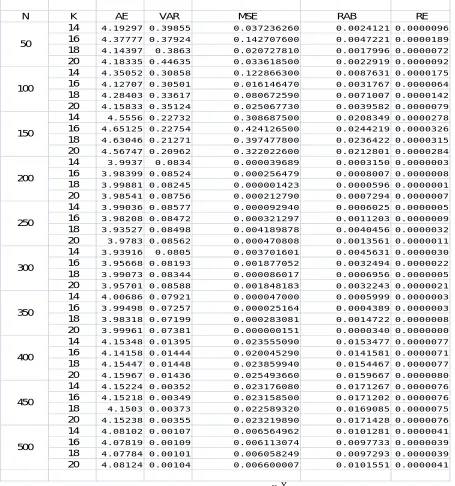
Performance of median ranks estimation of Scale () and Shape (α) Parameters of Power Function distribution obtained from optimally constructed grouped sample k= 10, 16,18,20 when Scale () = 4 and Shape (α) = 3 with the equations (1.3.8) and (1.3.9) are Presented in the table 1.4. We have resorted to Monte Carlo simulation to compute The Average Estimate (AE), Variance (VAR), Mean Square Error (MSE), Relalated Error (RE), Relative Absolute Bias (RAB),of the Scale () and Shape
(α) Parameters of Power Function distribution are unknown under complte 1000 simulations based on N=50(50)300
A. Conclusion
1) Variances of the estimators are decreasing as number of groups increases.
2) The estimates obtained from optimal grouped sample variance increases the efficient is increased.
[image:6.612.67.522.212.698.2]3) When compared with small sample, the estimators in large sample are more efficient.
Table 1.4
Power Function distribution
The Average Estimate (AE), Variance (VAR), Standard Deviation (SD), Mean Square Error (MSE), Relative Absolute Bias (RAB) and Relative Error (RE) of the Scale parameter () when Shape parameter (α) is known under complete data based on
1000 simulations. Population parameter values are = 4 & α = 3.
N K AE VAR MSE RAB RE
14 4.19297 0.39855 0.037236260 0.0024121 0.0000096 16 4.37777 0.37924 0.142707600 0.0047221 0.0000189 18 4.14397 0.3863 0.020727810 0.0017996 0.0000072 20 4.18335 0.44635 0.033618500 0.0022919 0.0000092 14 4.35052 0.30858 0.122866300 0.0087631 0.0000175 16 4.12707 0.30501 0.016146470 0.0031767 0.0000064 18 4.28403 0.33617 0.080672590 0.0071007 0.0000142 20 4.15833 0.35124 0.025067730 0.0039582 0.0000079 14 4.5556 0.22732 0.308687500 0.0208349 0.0000278 16 4.65125 0.22754 0.424126500 0.0244219 0.0000326 18 4.63046 0.21271 0.397477800 0.0236422 0.0000315 20 4.56747 0.20962 0.322022600 0.0212801 0.0000284 14 3.9937 0.0834 0.000039689 0.0003150 0.0000003 16 3.98399 0.08524 0.000256479 0.0008007 0.0000008 18 3.99881 0.08245 0.000001423 0.0000596 0.0000001 20 3.98541 0.08756 0.000212790 0.0007294 0.0000007 14 3.99036 0.08577 0.000092940 0.0006025 0.0000005 16 3.98208 0.08472 0.000321297 0.0011203 0.0000009 18 3.93527 0.08498 0.004189878 0.0040456 0.0000032 20 3.9783 0.08562 0.000470808 0.0013561 0.0000011 14 3.93916 0.0805 0.003701601 0.0045631 0.0000030 16 3.95668 0.08193 0.001877052 0.0032494 0.0000022 18 3.99073 0.08344 0.000086017 0.0006956 0.0000005 20 3.95701 0.08588 0.001848183 0.0032243 0.0000021 14 4.00686 0.07921 0.000047000 0.0005999 0.0000003 16 3.99498 0.07257 0.000025164 0.0004389 0.0000003 18 3.98318 0.07199 0.000283081 0.0014722 0.0000008 20 3.99961 0.07381 0.000000151 0.0000340 0.0000000 14 4.15348 0.01395 0.023555090 0.0153477 0.0000077 16 4.14158 0.01444 0.020045290 0.0141581 0.0000071 18 4.15447 0.01448 0.023859940 0.0154467 0.0000077 20 4.15967 0.01436 0.025493660 0.0159667 0.0000080 14 4.15224 0.00352 0.023176080 0.0171267 0.0000076 16 4.15218 0.00349 0.023158500 0.0171202 0.0000076 18 4.1503 0.00373 0.022589320 0.0169085 0.0000075 20 4.15238 0.00355 0.023219890 0.0171428 0.0000076 14 4.08102 0.00107 0.006564962 0.0101281 0.0000041 16 4.07819 0.00109 0.006113074 0.0097733 0.0000039 18 4.07784 0.00101 0.006058249 0.0097293 0.0000039 20 4.08124 0.00104 0.006600007 0.0101551 0.0000041 300
350
400
450
500 50
100
150
200
250
Asymptotic optimum group limits Yi (i=1, 2, …, k-1) in the form Yi= (t0 =0, ) to estimate Power Function Scale ()
Table-5.5
k x1 x2 x3 x4 x5 x6 x7 x8 x9 x11 x12 x13 x14
3 0.913 1.75
4 0.893 2.013 3.256
5 0.784 2.568 3.021 2.145
6 0.658 1.356 2.453 2.0147 2.568
7 0.587 2.013 2.018 2.897 3.2145 3.254
8 0.237 0.856 1.256 1.078 2.147 2.014 3.586
9 0.365 0.475 1.352 1.982 2.589 2.658 3.214 3.689
10 0.214 0.586 1.025 1.874 1.874 2.247 2.985 3.487 3.986
11 0.147 0.201 0.021 1.863 0.269 0.478 1.024 2.548 2.457 3.88
12 0.25 0.5790. 0.745 1.269 3.248 1.385 1.458 2.004 2.879 3.254 3.568
13 0.536 0.247 0.658 1.124 2.781 1.852 1.985 2.147 2.014 2.1478 3.247 3.894