URANIUM LUMINESCENCE
A thesis presented for the
degree of DOCTOR OF PHILOSOPHY in PHYSICS
in the University of Canterbury
Christchurch, New Zealand.
by
THESIS
CVoc..
4-77
. N 59'6 c:opj \CHAPTER
I
II
III
V
VI
CONTENTS
INTRODUCTION URANYL SPECTRA
URANIUM ACTIVATED LUMINESCENCE
EXPERIMENTAL PROCEDURE
RESULTS
VIBRONIC SPEC':'RA
Tr:MPERA TURE DEPE:mEFCE
SUMMARY AND CONCLUSION
PAGE
2 14
22
29
38
62
CHAPTER I INTRODUCTION
Tl ff: L1r.J�ARY 1 • L''. ,_. , . : .. , er CANTER.BUR
CHRISTCHURCH, N.l..
Luminescence of uranium compounds has been mostly due to the divalent uranyl ion uo2++. This ion, chemically,
is very stable and takes part in chemical reactions in the same way as a normal metal ion. This stability of a
metal oxide ion is one of the characteristic features of the chemistry of the actinide elements. Spectra of'
many salts of the uranyl ion have been investigated, e.g. for uranyl nitrates, sulphates, acetates etc. Though much has been found about the spectra, there is much left unexplained and will require considerable effort for a full interpretation.
When dissolved in some acidic (but not basic) glasses, the uranyl ion still gives an absorption and luminescent spectrum which is considered that of the uranyl ion
isolated from a crystal lattice. Dissolving uranyl ions or uranium oxide in molten salts of the alkali and akaline earth metals (e.g. NaCl, KBr, Sr SO4, phosphates) will also produce phosphors with absorption and luminescent spectra similar to that of the uranyl ion. However,
many fluorides show sufficiently different spectra to suggest that it is due to a new lwninescent centre formed around an uranium atom. Further investigation has shown that the spectra are not over-much different from that of the uranyl ion when account is taken of the surroundings of the ion in the crystal lattice. More work is
2. Interpretation of the spectral results can give some clarification of the two main points of interest for the uranium
centres:-1. The nature of the electronic structure.
This is complicated by the presence of a strang
uranium-oxygen bond for which no adequate theory has been given. Spectral data can give information on the
symmetry of the centres from selection rules with the vibronic side bands and polarization experiments.
Symmetry of the luminescent centre can be important in deciding bonding arrangements of the uranium with
surrounding oxygens.
2. Interactions with vibrations.
From the-temperature dependence of the vibronic spectra, it should be possible to determine how the vibrational modes of the host lattice ani those of' the centre itself interact with the electronic transition. Alternatively, from the vibronic spectra, it may be possible to infer information about the vibrational
modes of the lattice, depending on which is more unknown. Here the uranium luminescent centre system seems quite promising in determining information about the lattice dynamics of many crystal structures which give rise to, with uranium, luminescent and absorption spectra con taining a wealth of vibrational data (see author's M.Sc. thesis for examples).
This thesis has been mainly concerned with the
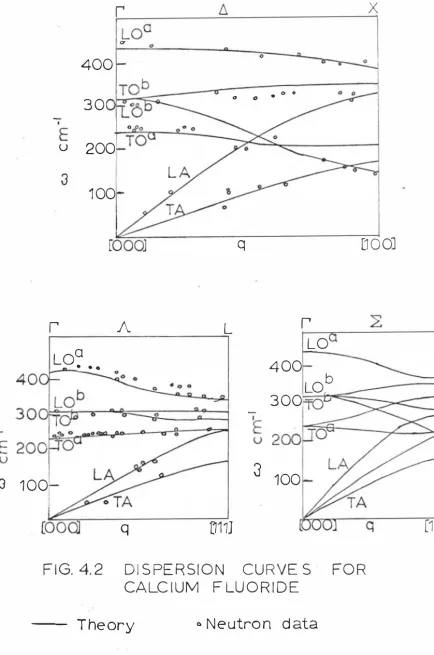
vibrational interaction which has been looked at in light of current theories on electron-phonon interactions and it has been possible to show that the vibronic spectra is closely related to the vibrational spectra in the case of' calcium fluoride.
URANYL SPECTRA
3. an outline is given below oI' aspects oI' the uranyl ion and spectra tha t appear relevant. Fuller iTirormat ion
can be obtained .from the .following re.ferences:-E. Rabinowi tch and R.L. Bel.ford "Spectroscopy and
Photochemistry o.f Uranyl Compounds" - Pergamon 1964. G.H. D ielrn and A.B.F. Duncan "Spectroscopic Propert ies
o.f Uranium Compounds" - McGraw Hill 1949.
G.T. Seaborg and J.J. Katz "The chemistry o.f Act inide Elements" Methuen 1 957.
STRUCTURE OF URANYL CRYSTALS: All s tructure data indicate that the uranyl ion (0 - U - o++) is linear and that there is no bend in i t. In solution, a bent structure has been postulated to explain some phenomena but there is an
al ternative explanation using a linear ion. There.fore the uranyl ion is considered linear as there is no real evidence to suggest that it is not.
Bond lengths .for the U - 0 bond in uranyl salts vary. In the orthourarates (U02)02ca, (uo2)o2sr, it is 1.91R with
the secondary oxygen a toms at 2.3R .from the uran ium atom all lying in approxima tely the equatorial plane o.f the uranyl ion ( three oxygens above, and three below, as shown in Fig. 1 .1).
The tend.ency .for the uranyl ion to have ions (usually
o
2 or F- ions) surroundin� it in the equa torial plane is quite general. In K3U02F5 crystals the uo2F53- groupis a pentagonal bipyramid (i.e • .fluorines are symmetr ically placed in thee;i_uatorial plane) w ith the U - O distance 1.76A0
, and the U - F distance 2. 24A.0• Nitrates and carbonates such as RbU02(N03)3 and uo2co3 have a planar arrangement o.f six N03- or co3 oxygens in the equatorial plane. Fig. 1 .2 shows th is .for uo2co3 where U - 0 is 1 .67A0 w ith the secondary U - 0 distances 2.5A0•
ligure 1 .. 1
I
II I I
P.r.;zstal Structupe
or
Calcium UranateCry~ts). Structure
or
Uranyl Car·bonateblack circle - uranyl ions
0
0
@
e
0
u
a
i"
0
..Jr-Oat -
L
Oat+ 0.4
Oat -
0.4
shaded tria.ngle ·with white circles - carbonate ions
Figs 1 . 1 and 1 . 2). This, together with the relative constancy of the geometry of the uranyl group itself, suggests that strong directed valence bonds join the uranyl atoms but that electrostatic forces and packing condi tions play the important roles in secondary uranium ligand bonds, though, of course, some directed covalency may occur.
4.
URANYL CRYSTAL SPECTRA. A t room temperature the luminescent spectra of uranyl compounds consists of several bands
approximately equally spaced (in terms of energy) spread ing from about the blue-green to the red region of the visible spectrum. The absorption spectra can be considered as consisting of three parts (see Fig. 1.3) one of which is an approximate mirror image of the luminescent spectra.
On cooling to
77°K,
most of the spectra are groups of lines wi th quite defini te energy differences between lines. Most of the lines are vibronic. (i.e. due to an electronic and a vibrational transi tion). Many ofthese lines can be interpreted as arising from vibrations of the uranyl group itself and also some of i ts neigh bouring ligands (i.e.
No
3- group vibrations occur and have been identified by isotope shift experiments).A
linear group such aso-u-o
++ has three fundamentalvibrations:-¼-
A symmetric bond vibration which is Raman active or <c:-0- U -O �y� An antisymmetric bond vibration which is infra red active.
o-u "70
or,2../� A bending vibration which is infra red active. O- U-0 .... I? or
6-u- o
. I
(j
z
-I-z
w
I
�
u
<
...J a)
w
....
<
...J 0..�4
w
u
-LA..w,o
0 .
u
z
0
._
u6
z
._
Xw
�2
_J0
ABSORPTION
2
.,
....
\...
.
•'
.
.' \ 3 \
-, \
'
16 18
20
I ... '· -. , •• ' ' t ·,
r
�----:-L:::----�...C...�-�...L----.:.l..L._L_ _ __JL___:�--L---:'Ji.1t---li.---.;
22 24 26 28
30
WAVE NUMBER- X
,o-3/cM:-'
5.
two mutually perpendicular planes) and should split into two components when tre ion is in an external field of :force.It is possible to determine these :frequencies :from in:fra red absorption and Raman work :for di:f:ferent uranyl crystals. Fig. 1.4 gives tre measured :frequencies collected :from Raman and in:fra red studies :for three
uranyl compounds and compares them with values :from their luminescent spectra.
Ys
Ve.__2/tr
(
.
Figure 1
,4*
U02(N03)2 Na U02(Acetate)3 Rb
uo
2(N03)3 trn:fra Luminescent In:fra Luminescent In:fra Luminescent red & red & red &�aman Raman Raman
cm-1 cm-1 cm-1 cm-1 cm-1 cm-1
865 874 856 855 883 888
941 948 931 927 960 962
210 220(?) 213
some values could not be measured directly and have been in:ferred :from overtones)
Because the uranyl ion has an external :field on it (due to the crystal) rigid selection rules are not :followed and it is possible to obtain the Raman active vibration
X
weakly in in:fra-red spectra, and conversely for Vcl: Allthree vibrations are permitted in combination with an electronic transition and they do occur. The �� value is normally hard to assign since it is generally splito
the u -to this
where
and
0 bond) and d (in the direction
bond), their fre quenc ie s can be )� ·-
-
jNo)/,
-
�j
i + �o M1,1,,Yl,
-
)./Ct!:A
Mo = mass of an a tom of oxygen Mu = mass of an atom of uranium
perpendicular given
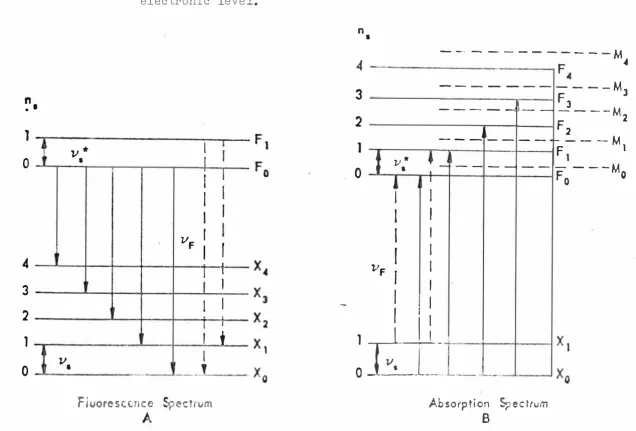
by:-In the electronic spectra, several quanta of
can occur giving the repe ti tive band or line structure common to all uranyl luminescence. Other vibrations occur with only one quanta or coupled to several quanta of J/�. It is possible to represent the low temper
-ature luminescen t spectra of' the uranyl ion by the equation
:-v;:: - n
,>.2-£ - n
'\ Vc,._ -n
'"2i -
Z
ni ),;_·
where
_v,�
is the pure electronic transition (resonance transition since it also occursin absorption, i.e. X0 L ----r F O in Fig. 1 • 5).
n
5 = O to 8 i.e. number of' quanta of' ).:)Similarly for = O or 1.
� (. "� J..{· refers to the vibrations of associa ted
ligands or crystal as a whole.
Iden tification of these vibrations has been made by known inf'ra red and Raman spectra of the ligands and also by isotope substitution.
I
n •
•
1
0
,4
3
2
1
0
• IFigure 1.5 Typical energy levels an:1 transitions for the uranyl ion.
electronic level. M is a second
n
•
--
·
---
-
M
F
'
v*
•
I
I
I
I
I
I
I
l
I
VF
I I
I
T
II I
I
I
I T I
I
+
I
v.
'
-·
Fluoresconce -ectrum
4
3
2
1
0
t
VF
v*
a TI
I
l
I
I
I
I
I
r
I
I
: I
I
---
---
--
--·--
--
--I :
IT
--�-1
0�
Absorption Spectrum
B
----M
F
----M
3J
F
2-
2 ---M
F t
- ---M
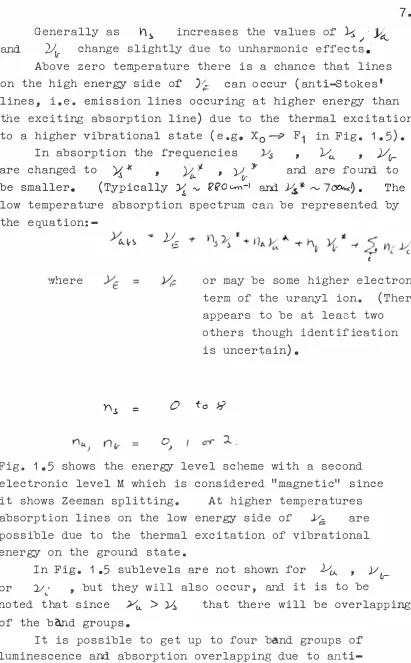
[image:11.685.31.667.50.481.2]Generally as h.s, increases the values of'
½'
.1 • J{_and
2J
tr change slightly due to unharmonic ef'f'ects.'Above zero temperature there is a chance that lines
7.
on the high energy side ot: ),;:: can occur ( anti-Stokes' lines, i.e. emission lines occuring at higher energy than the exciting absorption line) due to the thermal excitation to a higher vibrational state (e.g. X0 -=-? F1 in Fig. 1 .5).
In absorption the f'req_uencies ½ , V"- , J/ lr-are changed to � � , ){_J , ).)<r J<- and are found to
be smaller. (Typically�"" f�a�"'-, andJ-i*',,..__..7��. The
low temperature absorption spectrum can be represented by the
equation:-where
Y\s =
)/_
or may be some higher electronic term of' the uranyl ion. (There appears to be at least two
others though identification is uncertain).
0 t-o 8
0 ,)
Fig. 1.5 shows the energy level scheme with a second electronic level M which is considered "magnetic" since it shows Zeeman splitting. At higher temperatures absorption lines on the low energy side of .VE: are
possible due to the thermal excitation of vibrational energy on the ground state.
In Fig. 1 .5 sublevels are not shown for Ve.,,. , 1/
i-or 1/ ·
..
, but they will also occur, and it is to benoted that since Yu.
>
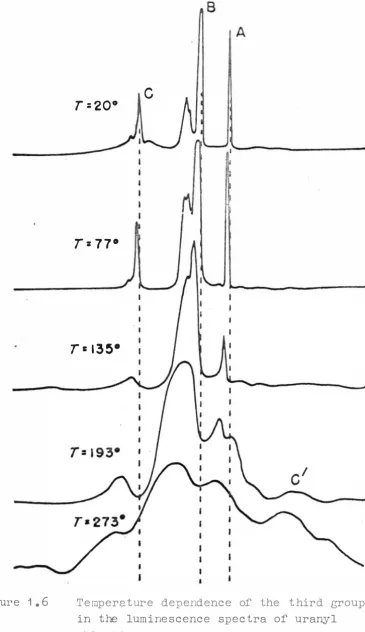
11 that there will be overlapping of' the bond groups. [image:12.498.65.476.0.663.2]anti-Figure 1.6
C
T=20°T= 77
°r
= 135° [image:13.495.81.446.21.653.2]Stokes vibrations. These do not appear to be due to
the upper level M which could give rise to apparent
anti-Stokes' lines. All the luminescence is assumed to come from only one electronic transition though there have been suggestions (which remain to be properly tested) that there is a second electronic level separated from X0
or F0 by 50 cm-1 to 250 cm-1 that gives some of the
luminescent lineso
TEMPERATURE EFFECTS: Little experimental work has been
done on this. The main observations have been taken at
8.
readily available temperatures such as 4� 2°K, 20°K, 770K,
193°K and room temperature. The spectra at room temperature
show broad bands and these sharpen up as tre temperature
decreases to give lines at 77°K. Further cooling to 4.2°K
causes the lines to become even sharper, often splitting
into two components (see Fig. 1 .6)
POLARIZATION: In properly orientated single crystals of uranyl double chlorides or nitrates it is found that the absorption spectra are different for light beams polarized
in two mutually perpendicular planes. When the transmitted
light is polarized parallel to the optical axis, little absorption occurs ani the crystals appear whitish ("white"
spectrum). Blue light polarized norr.ially to the optical
axis is absorbed much more strongly than blue light polarized parallel to the axis and in the s o-polarized beam the crystals
appear yellow ("yellow" spectrum). Also the luminescent
spectra show a similar polarization effect.
The differences in the yellow and white spectra has been talcen to indicate a further multiplicity of excited electronic states than those normally considered. However, since these effects occur only in low symmetry crystals (triclinic),
whose detailed structures are not known, they could be accounted for on the basis of different local environments of the uranyl ion. Further work is required to clarify
LIFETIMES: At room temperature the decay time of the uranyl luminescence is of the order of 3 x 10⁻⁴ sec.
9.
which lengthens to about 30 x 10-4 sec. at 4. 2°K. The
decay is exponential. This suggests, as is expected,
that the luminescence is a transition from an excited
upper state to a ground state with no metastable levels
involved. (This would prolong the decay time ani also give a
non-exponential decay).
Vibrations would help towards non-radiative transitions and as the temperature increases the increase in vibrational levels will aid non-radiative transitions to these and
hence the decay time is faster.
This time of the order of a milli second is typical of a magnetic dipole transition or a "forced" electric dipole transition (i.e. a forbidden electric dipole transition made allowed by vibrational interactions). Some worlr has suggested a quadrapole transition, but this is in doubt. Rare earth luminescent decay times are of
the same order of magnitude and these are magnetic dipole or forced electric dipole transitions.
Some uranyl compounds show two luminescent decay times, ani further work is required, especially in measuring decay times of individual lines or bands in the uranyl spectra. Any different electronic levels contributing to the
luminescence would be expected to have different decay times.
VARIATIONS: The spectra of the uranyl ion can show many
variations even for the same compound depending on impurities or degree of hydration of the crystal. This has often
caused conflicting results and conclusions by different workers on the subject.
ACTINYL COMPOUNDS: The other actindes form an almost
++ ++
identical group to the uranyl ion, e.g. Np02 , Pu02 , and Amo2++. These are also linear ions and form similar
1 o.
similar to that of the uranyl ion. Figo 1.7 gives the values for the sodium actinyl acetate.
Figure 1 ,7
Actinyl ion uo2++ Np02++
Puo2++ Amo2++
.vs (..,....
�-·
856 844 818 749).)(:4. �-1 931 934 930 914
These other actinyl groups are helpful in deciding the electronic structure of the uranyl group. The uo2++
plays a similar role in relation to the actinyl ions as
1--.,>--1+ does to the other trivalent rare earth ions,
in that there is no ground state paramagnetism.
ELECTRONIC STRUCTURE: While the electronic structure is not known fully, an outline is given of some recent work since it could have relevance to the uranium
activated luminescence. References besides the book
by Rabinowitch and Belford
are:-J.B. Newman, The Johns Hopkins University Caryle
Barton Laboratory, Technical Report No. Vffi-AF-4, April 1964.
J.B. Newman, J. Chem. Phys. � 1691 (1965)
From all the chemical evidence the actinyl ions are
strongly covalent. To account for this a molecular
orbital (MO) theory of the electronic structure is
required. In the molecular orbital theory linear
combinations of atomic orbitals (I.CAO) are written to form the MO basis set, even for those that remain
substantially unchanged on an atomic core when these cores
are bound together to form molecules. The self-consistent
co-11 • efficients of the atomic orbitals (AO) in all the MO's.
For the large number of electron (106) involved in the uranyl ion a rather lengthy calculation is needed. However, it is possible to consider the atoms as an electronic core surrounded by valence electrons which
only take part in the bonding. For the uranyl ion
the AO's required are the 5f, 6d, 7s, 7P from the uranium and the 2s, 2p from the oxygen. This leaves the cores
K2 L8 M18 N32 5s2 5p6 5d10 6s2 6p6 for the uranium (u6+)
and K2 for the oxygen.
Under the symmetry group
J�k ( �
J,�,
1n) for the free uranyl ion only those AO's with the same representation will combine to form MO's. Fig. 1.8 lists these withtheir representation labels. In the coordinate system used, the molecular axis is taken to coincide w ith the z
axis of the (x, y, z) coordinate system. The uranium nucleus is located at z = o and the two oxygens nuclei for ground state equilibrium at z = ± R0• Primed and
double primed z - coordinates are used to distinguish
the two oxygen nuclei. The z and z' systems are parallel
to each other and antiparallel to z".
Figure 198
Uranium Orbitals and Oxygen Group Orbitals in
])
oe J.... . Oxygen Group Orbitals� �
-Rf:-)
14t
(s'
-
s")}h(pt 1 P:'J 1 }fL(s'•s")
)fi
(t:>,/
tfix")}
f fi (P'd' ...
r�t)
}t: (f.)(.' - p .. /')
]
Jri_
(0.1' -e�')
Repre�ntation in J)oe h
� t- (
4;2., . .)"b
+-
(o..,
fJ)
rr
\4.(e
,.,,_)
From the A01s in Fig. 1.8 a MO set can be formed to give a possible ground state configuration for the uranyl
ion. One way of doing th is (at present the only quant itative way) is to consider overlap integrals to calculate bonding strengths. Newman has considered these for different radial funct ions for uranium and h is results are g iven in F ig. 1.9 with a compar ison.
Wave functions
Hartree-Fock-Slater
Belford & Belford
Hartree
relat ivistic
F igure 11
9
URAlNL OVERLAPS
u-o
crf
distance
0
1 .67A 0.054
1 .92R 0•038
0
1 •67A 0-066
1 •92R 0•052
1 ·671 0 •081
0
1 ·92A 0.075
11f
., cl
0.051 0·1880•029 0·185
0·075 0·1 75 0•047 0•1 92
0•133 0•132 0•090 o .141
These considerat ions suggest the conriguration
rrc:l
0·229
0•1 57
1-269 0•192
0•315
0.305 1 20
(n�)4
(�+y-(ITJ�
(v:_+)
.,__ as the most l ikely groundstate of the free uranyl ion. There are two main features
of th is coni'igurat ion which was not expected from earl ier
work:-1 • The strength of the ·tr bonds. These were assumed to be weak but are in fact stronger than
v
bonds.20 The weakness of f orbital bonds. Nearly all bonding
can be ascribed to d orbitals with l ittle or no f electron contribut ion0 It had been assumed that f orbital bond
-ing was strong to explain the paramagnetic susceptibility.
13.
The above MO solution only gives consideration to a free
uranyl ion. There are two other factors influencing the
ion and its electronic
state:-1. The vibrational interaction of the uranyl ion with its electronic levels.
2. The interaction of the uranyl ion with surrouniing
ligands.
The uranyl ion never appears free but always co ordinated with other ligands which for most cases reduces the symmetry from ,11':>i.,. to ]\ >\ (f M ?-...)
To account for the effect of ligands using a MO theory becomes impossible due to the large number of nuclei and
electrons involved. A simpler theoretical model is required and Newman has considered applying that of the
Ligand Field Theory. He gives two lines of attack
which seem promising and capable of quantitative investi gations. These are given below to show how the problem can be handled, as an analogous situation could be set up for the uranium activated luminescence.
The first assumes that the excitation of the
luminescent level takes place by electron transfer from some oxygen orbital
(AO
or group symmetry orbital) to an empty 5f orbital ( or one of the)00
h. orbital basefunctions, presumably a component of a 5f uranium orbital). This gives a formal charge distribution
(o-1
u3+o-1-).
From chemical evidence the formal charge on the uranium atom is known to be between +3 and +6 and on each uranyl oxygen, between
4
and +2.The second model is based on the formal charge
distribution
(o-
u4+o-)
and has 5f orbitals occupied inthe ground state. The spectra can therefore be
discussed on the basis of an u4+ ion in a f2 configuration,
14.
CONCLUSION: As yet there is no satisfactory theory for the
uranyl ion thol;_gh a large amount of experimental data exist.
However, it appears that not sufficient systematic measure
ments have been undertaken on the uranyl ion and the other
actinyl ions. These experiments should follow up
calculations or predictions from some theory.
URANIUM ACTIVATED LUMINESCENCE
The literature on this subject is not very large ani the list of references given below covers almost all
published papers in this field. (They represent all the papers consulted by the author. There are several
early Russian papers (in Russian) not consulted or listed below). The papers are grouped together in terms of their age and continuity.
1926 E.L. Nichols and M.K. Slattery J. Opt. Soc. Am.
ig 449
1928 1929 1948 1953 1959 1955 1955 1955 1956 1959 1960
M.K. Slattery Proc. Natl. Acad. Sci. U.S.
1h
777 M. K. Slattery J. Opt. Soc. Am..12
175F.A. Kr�ger Physica j1t 488
G.R. Price B.J. Feretta and
s.
Schawarz. Analyt. Chem.� 322H. Le Roux Nature
ill
1180W.A. Runciman Brit. J. Appl. Phys. Supp.
l¾
878 W.A. Runciman Nature 7S 1082W.A. Runciman Proc. Phys. Soc. A68 647 W.A. Runciman Proc. Roy. Soc.
ill:J.
39J.E.A. Lys M.Sc. thesis University of Canterbury J.E.A. Lys and W.A. Runciman Proc. Phys. Soc.
:J&.
1581963 J.V. Nicholas M.Sc thesis University of Canterbury 1959
1959
·I.P. Shapiro Optics and Spectr.
1
P.P. Feofilov Optics and Spectr.1
78
15. 1960 P. P. Feorilov Optics ani Spectr. � 433
1960 L.M. Belyaev, Z.B. Perekalina, V.N. Varrolmeeva, V. P. Panova, G.F. Dobrzhanskii, Soviet Physics Crystallography
2
7221961 P. G�rlich, H. Karras, R. Lehmann, Phys. Stat. Sol. j_ 525
1961 L.M. Belyaev, G. F. Dobrzhanskii, P.P. Feofilov.
Bull. Acad. Sci.
(u.s.s.R.)
phys series£2
5451961 E.P. Alekseeva Bull. Acad. Sci.
(u.s.s.R.)
phys series £2 541
1962 N.A. Tols' toi and Liu Shun-Fu Optics and Spectr • .Ll 59
1962 A.A. Kaplyanskii and N.A. Moskvin Optics and
Spectro
J2
3031962 P. P. Feofilov and A.A. Kap lyansk ii Soviet Phys. Uspekhi
2
791963 A.A. Kaplyanskii and N.A. Moskvin Optics and Spectr.
1J±
3571964 A.A. Kaplyanskii, N.A. Moskvin and P. P. Feofilov Optics and Spectr. 16 339
The review of the field given below is based on the more well established ideas concerning observations made on· the activated luminescence. Nearly all the important
work has been done on LiF and NaF crystals (since they
are more easily grown than the other fluorides). These are therefore presented in some detail. How these
fluoride phosphors are related to the others remains to be investigated.
MODEL OF LUMINESCENT CENTRE: As mentioned above, the uranyl ion can give rise to luminescence when it is an
impurity in some crystal lattice or glass. Generally
the luminescent spectra consists of equally spaced bands at almost the same repetitive frequency (860 cm-1) of the
16. quite different spectra. On cooling, the spectra consists
of many lines or sharp bands and the repetitive nature is not obvious. At room temperature there is only one
broadish band ani not several of approximately the same intensity.
It was suggested that a new luminescent centre was
formed which was not just simply uranyl ion. The
principle of charge compensation was used to build up a
model of the centre. For LiF and NaF a uranium atom
would replace the metal ion, e.g. a u6+ (radius
o.83A)
·replaces a Na+ (radius 0 •95R), leaving five excess positive
charges. To balance this charge five oxygen ions, o2
-(radius 1.40R) were assumed to r�lace five fluorine ions
p- (radius
1.36X),
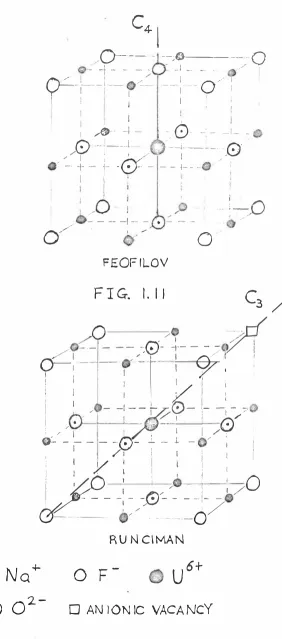
thus neutralizing the charge. (Feofilov's model Fig. 1.10). An alternative is one where 6o2-
ions go in with a fluorine vacancy nearby. (Runciman's model Fig. 1.11). It is well established that oxygen ispresent at the centre from isotopic substitution effects
on the i:pectra of NaF (U), and also by controlling the amount of oxygen present in making the phosphors.
These two possible centres have different symmetries. Feofilov's model is effectively orientated along the
C4
axis of the crystal (Fig. 1. 10) while Runciman's of along the C3 axis (Fig. 1 .11). There are two experimental
methods of distinguishing between them and both suggest that the centre is along the
C4
axis. The methods are polarization experiments and stress spectra. Both of these require clear single crystals and are taken on the luminescent spectra.The two experimental me�hods depend on the fact that I
the centre is anisotropic even though it is in a cubic
crystal lattice. In the polarization experiments the
exciting light is polarized parallel to a crystal axis
and the angle of polarization rotated. The resulting
[image:22.497.52.471.92.637.2]FIG. I. lO
C4- I
/0-- �0·-- --0
� -I - -· -
.
-
I - - . _,,/ '�
, __ t __ �:__ -- :-
-
a
:
I I I I I I I '
I I
I �-- --i - -.
0
-
--> -
I-0
-
-
-i
-_J
_ _
- --i----
0/
·
/ I . ' / I ,, -:_ +
-
j---<::f
-
--
l-- - - ;---
'.-�O
! _,,,,. .,...- - - -l - - • ..'.'.. _ __
if
' .
�
0
FEOF IL0V
F I G. I. 1 1
C3 /
-
,., / I-
?rf
_..,,.,.,.;,
,- ·- - - - -{:'l- -1·- - - - I
/_ I ---1- , _::___)-" t
Q
/
!I I ' '
I
'
� I •I I � /
1·
II I
X. I
I I - -1
--Jif-L
0-
.
_' _
-,. I ' I ,.,
I
,.
•
/
.
�
1/ I !0/
; ,. I I I I / . '
&-- -I
I - -
-;p-
t - �
-
I
/
;
tI
!i
' y
l I i I. I I , I
i � I ' I ! I
0
l
�
- -
-:-
-£/-.,---
-
-
i
-
-
I /� ' .,,"
:
/
l:)"----- . - -
-
-
-
-
0
R U N CI MA N
No
+2.
-0 -0
-
-
u
6+u
F
[image:23.498.135.417.48.687.2]a f'unction of' the angle of' rotation. From L .:_ -. theory it is possible to calculate the results for dif'f'erent orientations of' the centre, and these are compared with those f'ound experimentally. This method can also distinguish between magnetic an:l electric dipole trans itions an:l this has been done f'or many lines in the luminescent spectra of LiF(U) and Na.F(U) (see below).
When an unaxial stress is ap:;lied to a cubic crystal a shif't in the position of' an electronic transition of an
anisotropic centre will occur. This gives the stress
spectra of' the crystal. The shif't may be positive or negative (in energy) so that it generally would appear as if' the line is split. (Actual line splitting may also occur if' a degenerate electronic level is present). From the splitting pattern f'or stress along dif'f'erent axes, it is possible to determine the orientation of' the
centre. If' in addition polarization experiments are
carried out, and also the dependence of' the splitting on various stresses noted, it is possible to say something about the actual symmetry of the luminescent centre.
All results show that the centre is orientated along the
C4
axis. However, several types of' centres are present since dif'�erent types of splittings (and polar-izations) are f'ound. An explanation for the various
centres can be made on the basis of the uranyl ion. The
linear uranyl ion is assumed to replace the metal cation and two fluorines and this f'orms the optical core of' the centre along a
C4
axis. This is responsible f'or theoptical emission and the dif':ferent centres arise f'rom the
various methods of charge compensation. In the f'irst
17.
approximat ion of a ur anyl ion, only the ligands in the equatorial plane will ef'fect it. (see above on crystal structure etc.). Figure 1.12 gives the first coordin
ation sphere around the urnnium and the resultine; symmetry.
(a)
0
(v)
@
FI 4" U R E
\
F
®
])4h
C
-;..
v
1 . 1 1
(�)
(
(½
1-1
If
'
,
Jk
� u
' .#·�
.
(d)
; I
I !
! I
@
C-:i..v
1 8. assumed to occur further away and will have l ittle effect on the spectra (may cause broadening due to unresolved spl i tting).
All the types of centres in Fig. 1.12 are requ ired to
explain the spl ittings observed. A tetragonal one can arise from case (a) and (f), and si�ilarly, a rhombic
one from (d) o Splittings which requ ire C2� symmetry fall into two types, depen::l ing on the polarization. Centres (b) and (e) are sim ilar wh ile centre (c) w ill give a different polarization dependence. (N.B. a bent uranyl ion has symmetry C2v ). No assessment has been made on the importance of each model in contr ibuting to the spectra.
LUMINESCENT SPECTRA : For L i F (U) and Na F (U) the
luminescent spectra can be divided into two reg ions (not necessarily separate), a long wavelength region an::1 a short wavelength region. The short wavelength reg ion overlaps a part of the absorption spectra and contains several
resonance lines. The lone wavelength region has no t any
resonance l ines (apart from the f irst) and forms a series of vibrational bands s im ilar to uranyl spectra bu t with two
types of electronic transitions, electric dipole and
magnetic. The spectra can be described by the following equations.
for L i F (U)
and for Na F (U)
)/ ek = 19286 V mk = 18947
V ek = 18093
)./ mk = 1 7 743
800 k
800 k
k =
o ,
708 k
708k
cm-1 -1 cm
,
1
,
2cm-1
cm-1
,
k = 0,1 ,2,3. There are several other lines and bands with the same.J
V �'-0 O;i r-<
0
-('() 0--0 Oo
]_
I
I
ri-I
I
e,
'TY\e
1.m
'l.Z
3 40
crn '1L� F
(u)
8 0 0 C rn- l \I
Na F
(u)
I
19. In Fig. 1 .13 the energy level scheme is given for
Li F (U) and Na F(U), showing two excited states from which
the luminescence occurs. This has been shown from some
simple temperature dependence work.
Variations occur in the short wavelength spectra according to the method of prepar2-tion of the phosphor.
These variations can be quite marked and definite since it often means the appearance or non-appearance of some strong luminescent lines or bands (also of weak ones).
An explanation for these can be based on several possib
ilities.
1. The effect of re-absorption.
2. A second electronic trans ition.
3. A different type of luminescent centre forming. Effects 1 and 3 are the most likely on the evidence avail able, though 2 cannot be ruled out altogether.
ABSORPTION SPECTRA: The absorption spectra of Li F(U) shows no clear regularities and is unusual in that there
are at least fifteen resonance lines. However, Na F (U) shows a vibrational structure of frequency 630 cm-1
(cf
708
cm-1 in luminescence) and also like Li F (U) has absorption bands in the ultra-violet. Many absorption lines may no t belong to the lumine scent centre as such things as colour centres etc. are likely to occur.Many of the lines in absorption and in emission are very narrow (for solid s tate spectra) and are often less than 1 cm-1 wide.
DECAY TIMES: The decay is mostly exponential, and the decay time depends on the wavelength of the emitted light. For Na F (U) there are approximately three main decay
t imes,
7
•
8
x 10-4 sec., 6.4 x 10⁻⁴ sec., and5
.
5
x 10-4 sec. at77
°K
(N.B.: Decay times de�end on sample thickness and concentre.tion and values given are for lov, concen
-trations and thin specimens). Similar values are found for Li F (U).
20. 2.5 x 10⁻⁴ sec., and show less var iation w ith wavelength
(only difference is at head of lum inescent series where re-absorpt ion may be important).
OTHER FLUORIDES : F ig. 1 .14 gives a l ist of the uranium
activated fluorides known to lum inescence. They are l isted under crystal structure type w ith a brief comment on their spectra. The metal ion radius is also given for a comparison w ith the uranium ion radius. Apart from reporting the spectra and occasional measurement of the wavelengths, not much work has been carried out on them apart from Na F (U) and L i F (U).
F igure 1 ,14
Luminescence of Uranium Activated Fluorides
Crystal
Structure
rock salt
rutile
fluorite
perovsk ite
double fluorides
Uranium ion
Fluoride
Li F Na F
K F CsF MgF2 ZnF2 CdF2 CaF2 SrF2 BaF2
K ZnF3 K MgF3 Li�1F6
Na3AlF6
K3AlF6 radius is
Appearance at 4.2°K
lines, strong
Lines, very strong Lines, strong
Bands, medium
Lines, strong Lines, weak
Band, weak
Lines, very strong
Lines, strong Band, weak
Band, weak
Lines, medium
Lines, strong Band, weak Lines, medium
about
O
•
B3i
to 0•97RMetal ion radius A0
21 •
CONCLUSION: A picture of the luminescence of Li F (U)
and Na F (U) phosphors has now emerged based on exper
i-mental evidence. This is that the lumine scence is due to a uranyl ion -substituted into the crystal lattice.
The spectra being modified by the various means of charge
compensation. One type of centre predominates and its electronic level was given in Fig. 1 .13 . From the decay t imes and the approximately equal intensities of the
electric and magnetic dipole transitions, it is evident that the transition is a "forbidden" one made allowed by some vibrational interaction. Further development
of the centre awaits the solution of the electronic structure for the uranyl ion. This can then serve
as a starting point for further work (or the spectra may serve as a test for the structure of the ion) o
No work has been done to explain the origin and nature of the sharp lines and the many bands observed.
CHAPTER I I
EXPERIMENTAL PROCEDURE
SAMPLE PREPARATION: Three methods were adopted for obtain ing samples.
1 . Powder samples were made by mix ing uranyl nitrate and calcium fluoride powders together and heating to above
1 oco0c (melting point of calcium fluoride is 14OO°c) in air.
Both reagents were of "Analar" or higher grade purity. Several samples were made with various concentrations of uranium from about 0.01% to 1(% (fraction of uranium atoms to calcium atoms). All of these were capable of luninescing
(see Chapter III). The higher concentration samples were
orange in colour, and sometimes a green (non-luminescing) powder was also formed.
Because the high concentration of uranium could possibly di stort the lattice or cause new com:Jound forraation, X-ray powder diffraction pho tographs were taken. These showed that any distortion of the lattice was not detectable.
However, some extra lines appeared. One group was due to calcium oxide, and appeared in some samples ani not in others
(see below). The other group of lines were that of a face centred cubic lattice with a lat tice constant a0 = 8.28.£. These only occurred in some high concentration samples,
and were very weak. E.G. Stevrard and W.A. Runc lman, Nature 11,g 75 (1 953), have shown that calcium oxide and uranium can form a compound Ca3UO6 which is face centred
cubic with a0 = 8 • 29A, and it seems most probable that it has
formed here, using CaO formed from the hydrolysis of CaF2 0
Strontium fluoride powder samples were atte�pted but SrF2 went to SrO far too readily to get suitable �owders by this method.
2. Crystalline Samples. An atte .npt was made to see if
230·
oxygen present (see for example D. Lewis and H. Pearson
J. App. Phys. 2,2 1 939 (1 964). It should be grown in a hydrogen fluoride atmosphere to prevent this.
With the furnace ava ilable, it was possible only to use an inert atmosphere of nitrogen. The samples were heated above the melting point of CaF2 and the temperature lowered slowly at a few tens of degrees an hour. This produced a crystalline lump of CaF2 (U) which was greenish in colour
(most probably due to u4+) and which did not luminesce, until roasted in air at 700°c. The material then had a
whitish appearance due to Cao precipitated in the C aF2 lattice.
Several tries were made but it was not poss ible to get clear luminescing crystals suitable for obtaining
absorption spectra by transmission methods. A fa irly
thick crystal would be re�uired as the absorption from powders was very weak.
In attempting to make the higher concentration samples,
a large amount of black material was produced. This could be due to some react ion of the uranium with the carbon
crucibles used. Thus i t was not possible to obtain
crystalline samples with a high concentration of uranium.
3.
Commercial Samples. Some crystals of CaF2, SrF2 andBaF2 containing uranium were obtained from "Semi-Elements".
These had a greenish colour and did not luminesce. They contained largely u4+ ions. Chips from these of CaF2
and SrF2 were heated to about
8oo
0c .
This caused them toluminesce and also to go milky due to the oxide forming. As the oxygen must diffuse in from the outside, the centre of the chip was not luminescent but was now a dark brown. The dark brown most probably due to
u
6+ ions w ithout oxygen for ch arge compensation (see P. G�rlich, H. Karras, R.Lehmann Phys. Stat. Sol.
1
389 (1 961 )).SPECTRA: The luminescence was excited by a black
24.
mercury lamp with ultra violet radiation of mainly 3650X. Absorption spectra were taken by reflection or transmission methods using a tungaten filament lamp for the visible and
a hydrogen discharge lamp for the ultra violet. The spectra
were recorded on a prism spectrograph or a grating spectro graph.
PRISM SPECTROGRAPHS: Two Hilger instruments were used. A medium quartz spectrograph and an automatic large quartz and glass spectrograph. These were used for the general
investigation of the spectra. The large glass spectrograph
was mostly used havinc a dispersion of 9R/111IIl at 5000R compared
0
to 65A/mm for the medium instrument. Slit width of 20p
(1p. = 10-6 m) was typically used and the plates used were the Ilford R40 and Astra III for the ultra violet to visible
region and Kodak II L for the near ini'ra-red. The
photo-graphic process was very useful in finding weak emission lines and much structure of interest was found this way by
taking very prolonged exposures.
For measuring wavelengths the medium spectrograph has
an internal scale and wavelengths could generally be measured
to within 10R. For the large an iron arc calibration was required and lines fitted to a Hartman formula. This enabled lines to be measured to 11.
GRATING SPECTROGRAPH: A 3.4 metre Ebert spectrograph manu factured by the Jamel-Ash Company was used for photo
electric recording of the spectra, and for investigating the temperature dependence of line shapes and shifts.
Over various runs three photomultipliers were used. 1. RCAIP2I.
2. EhlI 6255S. 3. EMI 9558Q.
These all gave satisfactory performances, the 9558 tube while slightly noisier was better for the red end of the
25.
The grating used was a replica of a MIT gr3ting with
7620 grooves per inch and blazed for 59°. This meant that
the luminescent spectra being centred around 5200A was taken in the sixth order. To prevent overlapping of orders, wide band interference filters were used in the entrance optics.
Entrance and exit slit widths of
3CJ1
were used to give reasonable light intensity for the detect ing system.This corresponds to a spectral slit width of
o
.
ol.J
for the sixth order. Since line widths of interest were notnarrower than 0. 4A. this gave quite adequate resolution.
For this line the spectral slit width would cause an error of 0.5% in width using the formula.
+ -=
u� = observed line width
�
65 = spectral slit width
5,
= true line width(This assumes a Gaussian line shape, see H. C. Vande Hulst and J .J.M. Reesinck Astrophys J. 106 1 21 ( 1 947) for a discussion on the validity of the equation).
The absolute wavelength calibration for the spectrograph was checked using mercury lines and was found to be accurate to ± o. 2-R over the spectral range of interest.
Wovelength readings were taken off a counter which gave
values of h /\. ( n the order and )\ the wavelength). This could be read to within one o division, so that the errors
-1
in readings are ± 0.1A or ± 0. 5 cm • So the error in taking the difference of two readings is ± 1 cm-1 • This
would represent the accuracy in considering line shifts.
For line widths or separation of lines the accuracy can be higher, depending on the speed of scan, since the measure
ments are taken on the same record.
-c:::
0
....
u
<{ LLz
0
....
�
er
0::
0
u
FIGU RE 2. 1
C O RREC TI O N C U R VE S
1P21
26. multiplier and filters). To do this a calibrated tungsten strip lamp was put in place of the luminescent sample. The lamp had a calibration of colour (brightness) temperature
versus current. This was converted into true temperature
versus current by using tables in the American Institute
of Physics Handbook 1 957 (which also gives the blackbody
radiation function). Thus, by using known values of the
emissivity of tungsten as a function of wavelength (J.C. De Vos Physica 20 690 (1954) give most recent and accurate data) and the blackbody radiation function, the spectral output
of the lamp can be calculated. From the response of the
system to this spectra, it is quite sim11le to obtain a
calibration curve to give correct relative intensities for
emission spectra. (See Fig. 2.1 for typical correction
curves by which spectra obtained should be multiplied. N.B. curves do not have the same normalization).
DEWARS: For spectra taken with photographic plates, the samples were immersed direct ly in liquid nitrogen (77°K) or liquid helium (4•2°K ) by using suitable glass dewars.
Before a metal dewar (see below) became available some photo-electric recording was made using these dewars.
Providing the bubbles in the boiling liquid were kept small,
the time constant in the r ecording SJ'S tem was sufficient to remove the noise caused by them.
For the varia.ble temp erature work, a metal dewar obtained
from "Andonian Associates" was used. In this dewar the
sample is mounted on a cold finger in vacuum and the temper
ature of the finger measured using a gold-cobalt or a copper
constant&n thermocouple with a microvoltmeter.
To control the temperature, an electrical heater was wound around the sample holder (or cold finger) which was
attached to the liquid helium tank by a hollow stainless steel
tube. In the tube the gas pressure (helium or nitrogen) could be changed to va.ry the rate of heat flow from the sample
to coolant. By suitably varying the heater current and the
27.
and maintained. From 5 °K to 70°K liquid helium was used
and from 65 K to nearly room temp erature liquid ni trogen
was used in the liquid helium tank instead. Temperatures
below 77°K for liquid nitrogen were obtained by pumping
on the tank to lower the pressure above the liquid ni trogen causing the temperature to drop .
The accuracy to which the temperature could be controlled depended on the temperature. Near the temperatur e of the reference junc t ion ( e ither 77°K or 4•2°K) the sample could
be he ld within
t-
0 • 5°K while for temperatures furtheraway it could be held to
1
3°K at the worst. The temper -ature of the sample it self c ould be one or two degreeshigher than that measured by the thermocouples due to local heat ing of the sample by the inc oming radiat ion from the
lamp.
Figure 2.2 gives a general view of the dewar mounted on the 3•4 m spectrograph with assoc iated equipment.
E . S,R. SPECTRA : Using an X-band spectrometer a search at
77°K and room temperature was made for any poss ible resonances
in the uranium act ivated crys tals. No obv ious spe ctra was
found for the luminescent samples Li F(U) , Na F( U) and
Ca F2(U) . Though there were faint sirrns of some lines,
these could be due to other impuri t ies. Snmple s of Li F( U)
which had been melted in a furnace with no oxygen gave a broad line at g = 2 , but these samples did no t give the
normal luminescence. They gave instead a red luminescence
typical of colour centres in LiF. ( P . G�rlich , H. Karras,
G . K�t itz , Phys . Stat. Sol .
2
1 803 ( 1 963 ) .These re sults show tha t there are no free spins
as soc iated with the luminescent centre and that there are no
colour centres present. Extens ion of the measurements to
other frequenc ies and 4•2°K may give some resonances which
would be helpful in determining the bonding arrangement of
the centres.
POLARIZATION SPECTRA: Exc i tinf:; light fr om a Bausch and
[image:37.502.52.480.27.622.2]....
CL.()
s:
.,
Glan-Thompson prism and focussed onto a single crystal.
The resulting luminescence was analysed for any polar -ization by a Babinet compensator. Na F (U) crystals
28.
showed some degree of polarization, as expected from the work of Feofilov and others (see Chapter I). However, for Ca F2(u) and Sr F2(U) no obvious polarization was found (a degree of polarization greater than
2%
can be detected with aBabinet compensator). The test was tried for both absorp
-tion bands, one in the near ultra-violet
( 3500R)
and theother near the luminescence
( 5000A) .
This does notCHAPTER I II RESULTS
ABSORPTION SPECTRA. Some small chips of the crystalline samples and the "Semi-Elements" crystal of CaF2(u) proved
suitable for some absorption spectra by transmission.
Figure 3.1 summarizes the results for the ultra-violet
absorption spectra.
Figure
3,
1Ultra-Violet Absorption Spectra for CaF2(u)
2500
2783 2789
2900 3080
3420
}
COMMENT
strong absorption for shorter wave lengths
broad lines
bands
centre of a broad band
�jc wavelengths as from the medium spectrograph with an
+ 0
accuracy of _ 5A.
29 .
30. absorbed energy is transferred from these t o the elec tronic system ( assumed on the uranium atom) re spons ible for the luminescence .
Several lines were found in the red and near infra-red
region for many samples, but no t all , poss ibly due to the
0
weakness of some line s . These l ine s are at 91 48A ,
748oi , and 6055X ( these do no t correspond to any lines of
u3+
oru
4+ in caF2) . Some of the lines appear to have weak structure associated wi th them, but were beyond thelimit of measurement for a photographic plate.
bands in CaF2 for regions near these lines have ( see G�rlich et . at . above) as due to OH- ions .
Absorp tion been reported
The
0
absorpt ion l ine at 6055A is possibly associa ted wi th sec ondary
luminescent bands centred at 6049i and 6521 R ( see be low under
Secondary Luminescence) . However , the absorption l ine can
occur in samples which do no t give the luminescence . No 0
explanation has been found for the other two l ines, 91 48A
0 0
and 7480A. The 91 48A l ine appears to be very sharp.
From the higher concentration powders , it was poss ible to obtain a very weak absorption spectra in the same region
as the luminescent spec tra. Filters were used to prevent
any ultra-violet light from the tungsten lamp caus ing
luminescence . The line s obtained are given in Figure 3 . 2 .
Fi_gure 3.2
Visible Absorption Spectra for CaF2(u)
"-i y cm -1 .6. Y cm -1 COMMENT
5000.4 19992 824
5035.6 19853 685 A Y also in luminescence
5090.2 19640 472
5127.9 19496 328
�v
also in luminescence5144. 7 19432 264 .C:. V also in luminescence
5158.2 19381 213
5188.3 19269 101
5215.5 19168 0 resonance line. Type I
5275 .1 18952 - 216 resonance line. Type II
This spectra was obtained from a high concentration sample (0.3% U) and the lines can belong to either Type I or Type II centres (see below under Concentration Effects).
The resonance lines are assumed as they are very close to
31.
lines found in luminescence. For Type I absorption spectra
there are at least three lines corresponding to vibrational
frequencies found in the luminescent spectra. Actual band
intensities should be compared with the intensities for the luminescent spectra to see if the vibrational structure is
similar. (This would, as mentioned in Chapter II, require
clear thick crystals). Type II spectra has a resonance line at 5275.1i and some of the absorption lines could belong to this spectra, but at present it is difficult to identify any. Both resonance lines ap�ar as doublets, but were
32. CONCENTRATION EFFECTS: The luminescent spectra of the Ca.F2 po fders with varying concentrations of uran ium showed
differences. A description of the spectra can be based on considering that there are two types of spectra present, Type I and Type II. The origin of the two spectra is most probably due to two different luminescent centres.
Explanations based on a s ingle centre meet grave difficulties in postulating a likely energy level scheme, and also in
explaining the observed temperature dependence o
For low concentrations the spectra is that of one centre only (see Figure 3.3). Figures 3.3 to 3.6 give the
un-corrected chart recorder output from the Ebert spectrograph.
The type of photomultipl ier
(P.M)
tube used and the temperatureof the sample are indicated. Since the spectra were taken
under very similar conditions the area under the spectral curves gives some idea of the relative intens ities of the luminescence for the d ifferent samples (e.g. that of Figure
3. 5 is the most intense). Type I spectra is character-o
ized by a sharp no-phonon l ine (see Chapter IV) at 5212.7A
with a vibrat ional structure on the side. Th is vibrational
structure is approx imately repeated on the side of the l ine
at 5420.6R. The repetit ion of this structure is more
evident on a photographic plate than on a chart record since the intensi ty becomes too low for the structure to show up on the chart. It is possible to represent the spectrum by the equation
:-k
2/ =
=
191 79 730 k n. , v' . l I.
0, 1 , 2 or 3 (very weak at k = 3) -1
cm
is a latt ice or local mode frequency (see Chapter IV) and has the values 147, 194, 266,
297, 325, 385, 438, 609 cm-1•
Not all are sharp lines but rather bands, especially for k � 1
n · t = 0 or 1 no combinations of the
v.
� are apparent but they could occur in the broadt
...
If)
...
z
w
...FI G. 3 .3
LUM I NESCENCE OF Ca �(U
.O --.fl
T = 7 7°K
P.M. 1P21
o<(
co
"-1"�
LO <O 'V •
I- 1 0 . .j . 4
o<!
r--.
� LUM INE SCE NCE O F C a � ( U )X TAL
t
>
r
IJ)
t
z
w
r
z
(\J I.{)
-