ISSN Print: 2152-7180
DOI: 10.4236/psych.2019.1016138 Dec. 27, 2019 2177 Psychology
The EASI: Factor Structure and Measurement
and Structural Invariance between the Parent’s
Gender, the Child’s Age, and Two Measurement
Time Points
Yukiko Ohashi
1,2*, Toshinori Kitamura
2,3,4,51Josai International University, Togane, Chiba, Japan 2Kitamura Institute of Mental Health Tokyo, Tokyo, Japan 3Kitamura KOKORO Clinic Mental Health, Tokyo, Japan
4T. and F. Kitamura Foundation for Studies and Skill Advancement in Mental Health, Tokyo, Japan 5Department of Psychiatry, Graduate School of Medicine, Nagoya University, Nagoya, Japan
Abstract
Background: The EASI (measuring Emotionality, Activity, Sociability, and Impulsivity) is a widely used instrument to measure children’s temperament. However, its factor structure and its measurement and structural invariances have rarely been studied. The purpose of our study is to report the factor structure of the EASI in a larger population in Japan searching for the model that fits the data sufficiently as well as the final model’s measurement and structural invariance. Methods: A net-survey collected data from 531 moth-ers and 369 fathmoth-ers of 3- to 4-year-old Japanese children. A test-retest survey was conducted of 173 mothers and 127 fathers out of the first group of par-ticipants. Results: The original 4-factor structure (excluding 6 items) with a general factor (influencing E and I) showed an acceptable fit. This model also satisfied measurement and structural invariance between fathers and moth-ers, boys and girls, 3- and 4-year-old, and times 1 and 2. Differences emerged between mothers and fathers in terms of the means of some factor scores. Conclusion: We recommend the use of 4 subscale scores as well as a compo-site score of E and I.
Keywords
EASI, Factor Structure, Measurement and Structural Invariance, Parental Gender Difference, Temperament Assessment
How to cite this paper: Ohashi, Y., & Kitamura, T. (2019). The EASI: Factor Structure and Measurement and Structural Invariance between the Parent’s Gender, the Child’s Age, and Two Measurement Time Points. Psychology, 10, 2177-2189.
https://doi.org/10.4236/psych.2019.1016138
Received: December 2, 2019 Accepted: December 24, 2019 Published: December 27, 2019
Copyright © 2019 by author(s) and Scientific Research Publishing Inc. This work is licensed under the Creative Commons Attribution International License (CC BY 4.0).
http://creativecommons.org/licenses/by/4.0/
DOI: 10.4236/psych.2019.1016138 2178 Psychology
1. Introduction
A long history of personality studies has always cast a light on the individual differences of infants and toddlers. These individual differences are referred to as temperament. Although the definition and therefore measurement of tempera-ment vary from one researcher to another (Goldsmith et al., 1967),Buss and Plomin’s (1975) four-temperament theory is one of the widely acknowledged temperament theories. They developed a theory of personality following All-port’s notion that defines temperament as “the characteristic phenomena of an individual’s nature, including his susceptibility to emotional stimulation, his customary strength and speed of response, the quality of his prevailing mood, and all peculiarities of fluctuation and intensity of mood, these being phenome-na regarded as dependent on constitutiophenome-nal make-up, and therefore largely he-reditary in origin” (Allport, 1961, cited by Buss & Plomin, 1975). Buss and Plo-min’s initial criteria of temperament differed from other personality traits in that it included inheritance, stability during childhood, retention into maturity, adaptive value as well as the fact that they exist in our animal forebears(Buss & Plomin, 1975). Later, however, they shifted emphasis to two crucial criteria: in-heritance and the presence in early childhood (Buss & Plomin, 1984). In their idea, temperament is concerned more with style than with content. It is more about expressive behaviour than about instrumental (coping) behaviour, and more about what a person brings to a role or situation than what either of these demands of him (Buss & Plomin, 1975).
These considerations led them to propose emotionality, activity, sociability, and impulsivity as children’s basic individuality. Emotionality refers to intensity of reaction. Children have an excess of emotion. Emotional expression is exag-gerated. They have mood swings and are short tempered. Activity refers to total energy output. Children keep moving and are tireless. Their behaviours are vi-gorous. Sociability refers to children’s desire to be with others. They are respon-sive to others and rewarded by interaction with others. Impulsivity refers to quick response. Children are less likely to be inhibited. They are likely to give in to their urges. As a measurement of the four-temperament pattern, Buss and Plomin (1975)developed the EASI Survey, a questionnaire completed by par-ents. This questionnaire includes 20 items with five items for each of the four temperament domains: Emotionality, Activity, Sociability, and Impulsivity (hence its acronym). This survey has been used for genetic/twin studies of tem-perament (Plomin et al., 1993).
DOI: 10.4236/psych.2019.1016138 2179 Psychology among both boys and girls, Activity and Impulsivity were correlated, and Emo-tionality was moderately correlated with Impulsivity. A similar factor solution was obtained by Gibbs, Reeves, and Cunnigham (1987)in a study of 105 moth-ers of British children aged 1 to 5 years. Using a Norwegian population of child-ren aged 18 to 50 months, Mathiesen and Tambs (1999) reported a 3-factor structure using the EAS, a modified version of the EASI. A study on the EAS factor structure among school children was done by Boer and Westenberg (1994).
These investigations, however, only used exploratory factor analysis (EFA), and the goodness of fit with the data was not checked by confirmatory factor analysis (CFA). A CFA of the EAS was conducted by Gesman et al. (2002) in a population of school children. However, they conducted CFAs for EAS data ob-tained from children, parents, and teachers without performing EFAs before-hand. Unfortunately, fitness of their 4- and 3-factor models was below standard level. A similar report came from Spence, Owens, and Goodyer (2013) using an adolescent population. Again, their study did not perform an EFA before the CFA. Their final model’s fitness was barely acceptable: comparative fit index (CFI) = .953 and root mean square of error approximation (RMSEA) = .071. Ki-tamura et al. (2014)performed an EFA of the EASI items in a randomly halved population of Japanese fathers (n = 237) and mothers (n = 412) of children un-der four years of age. The factor structure they obtained was cross-validated by a CFA. Their EFA yielded a two-factor structure. Nevertheless, a four-factor structure according to the original report (excluding items with low factor load-ings) showed a better fit with the data. However, this model’s fitness with the data was not very good: χ2/df = 1.97, CFI = .925, and RMSEA = .055. The above studies all indicate that first-order CFAs cannot necessarily explain the data suf-ficiently.
The number of factors in EFAs can range arbitrarily between 1 and the num-bers of items. Here, single and first-order factor models reflect different ideas. A single factor emphasises general abilities (e.g., emotional vulnerability) whereas the latter emphasises several specific abilities (e.g., E, A, S, and I). Neither model can address both general and specific abilities simultaneously. However, many psychological measurements cannot be explained solely by either a single factor model or a first-order factor model. This leads to the necessity of bifactor mod-els. This takes into consideration the general and specific abilities in one model (Brunner, Nagy, & Wilhelm, 2012). The general factor influences all the indica-tors directly but not through the first-order facindica-tors. All the indicaindica-tors differ ac-cording to the general factor while groups of indicators are dependent solely on each first-order factor they belong to. Here, the general and first-order factors are not correlated with each other.
in-DOI: 10.4236/psych.2019.1016138 2180 Psychology strument. This means that indicators of an instrument have the same meaning and that they are not biased by some attributes such as gender, marital status, or age, to list just a few. These procedures include (Vandenberg & Lance, 2000):
1) Each group (e.g., men and women) has the same pattern of indicators and factors (configural invariance);
2) In addition, factor loadings for similar indicators are invariant across groups (metric invariance; also known as weak factorial invariance);
3) In addition, intercepts of similar items are invariant across groups (scalar invariance; also known as strong factorial invariance);
4) In addition, residuals of similar items are invariant across groups (residual invariance; also known as strict factorial invariance);
5) In addition, variances of similar factors are invariant across groups (factor variance invariance);
6) In addition, covariances between factors are invariant across groups (factor covariance invariance); and
7) In addition, means of factors are invariant across groups (factor mean inva-riance).
The hypotheses from 2) to 4) are called measurement invariance as they ex-amine the relationships between measured indicators and their latent constructs. The hypotheses from 5) to 7) are called structural invariance as they examine the latent variables only. Hypothesis testing is recommended to be conducted in the order above (Vandenberg & Lance, 2000). If one step is rejected, the subsequent steps are not to be performed.
Our present study reports the factor structure of the EASI in a larger popula-tion in Japan searching for the model that fits the data sufficiently. We also re-port the final model’s measurement and structural invariance.
2. Methods
Study procedures and participants
The target of our study was 3- to 4-year-old Japanese children. With the co-operation of Rakuten Insight Inc. (Shibuya, Tokyo), parents who live with their 3- to 4-year-old children (exactly 36 months to 59 months) were recruited from 47 prefectures in Japan. Out of over 400,000 parents who were enrolled as web-research respondents, 246,578 had children and were solicited to participate in the survey. Our inclusion criteria were: 1) the participants were required to take care of the children on daily basis, 2) their native language was Japanese, and 3) the main living environment after birth of the target child was in Japan. A total of 531 mothers and 369 fathers were selected as the participants. Their mean (SD) age was 37.6 (5.5) years old. The gender ratio of children was even: 465 boys and 435 girls. Among them, 481 were firstborn children, 322 were second-born, and 84 were third-born. Their mean (SD) age was 47.7 (6.3) months old.
DOI: 10.4236/psych.2019.1016138 2181 Psychology an information page, with the aims and affiliations of the study made transpa-rent, and information about informed consent. The questionnaire consisted of simply the measurements of the study. We obtained some demographic date in-cluding the parental age, sex, the child age, and their nationality from the Raku-ten database after the participants’ permission. Besides, the questionnaire in-cluded messages for a break if the participants felt tired, some simple questions to screen dishonest respondents, and the address of the consultation desk for the research. As an incentive, participants received electronic money points which could be used for internet shopping.
After the first survey, we conducted the second survey (i.e., retest survey) of 173 mothers and 127 fathers out of all of the participants. The web page was open April 28 to May 8, 2018 for the first survey, and May 25 to May 28, 2018 for the second survey.
Measurements
The EASI Survey consists of 20 items with a 5-point scale (from a little “0” to a lot “4”) to measure 4 temperament dimensions: Emotionality (E), Activity (A), Sociability (S), and Impulsivity (I). One of us (TK) translated the EASI into Jap-anese with permission from the original authors.
Data analysis
We examined goodness-of-fit of the original model proposed by Buss and Plomin (1984). First, we examined skewness and kurtosis of each EASI item to confirm a normal distribution of the item. We then calculated the Cronbach’s (1951)alpha coefficient of the items of each of the EASI subscales. If it was less than .7, we deleted items that had a positive impact (i.e. resulted in a higher al-pha coefficient when deleted) until the alal-pha coefficient reached .7 or greater, or when the number of items loading on a factor was reduced to three.
Then we examined the goodness-of-fit of such a model in a CFA. In CFAs, the fit of these models with the data was examined in terms of different indices: χ2, CFI, and RMSEA. A good fit was defined as χ2/df < 2, CFI > .97, and RMSEA < .05. An acceptable fit was defined as χ2/df < 3, CFI > .95, and RMSEA < .08 (Bentler, 1990;Schermelleh-Engel, Moosbrugger, & Müller, 2003). We also used the Akaike information criterion (AIC; Akaike, 1987), in which a lower AIC was judged as being better. If the 4-factor structure according to Buss and Plomin’s idea did not prove acceptable, a bifactor model was examined(Brunner, Nagy, & Wilhelm, 2012;Chen, Hayes, Carver, Laurenceau, Zhang et al., 2012;Cucina & Byle, 2017;Gignac, 2008;Reise, Morizot, & Hays, 2007).
After identifying the best fit model, we examined measurement invariance across different categories and occasions: mothers vs. fathers; boys vs. girls; 3-year-olds vs. 4-year-olds; and time 1 vs. time 2. We defined invariance from one step to the next as either 1) non-significant increase of χ2 for df of difference, 2) decrease of CFI less than .01, or 3) increase of RMSEA less than .01 (Chen, 2007;Cheung & Rensvold, 2002).
Ethical consideration
Ki-DOI: 10.4236/psych.2019.1016138 2182 Psychology tamura Institute of Mental Health Tokyo (No. 2018120801).
3. Results
Internal consistency of the four subscales
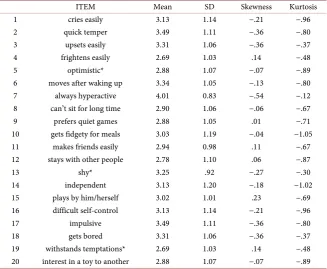
[image:6.595.211.539.270.539.2]Skewness and kurtosis of all of the EASI items were low (skewness < 1.0 and kurtosis < 2.0). This suggested normal distribution of the data (Table 1) and therefore the data are “factorable”. Cronbach’s internal consistency of more than .7 was obtained by excluding items 13 and 17 from E, items 2 and 14 from A, and items 11 and 15 from S. There was no necessity to exclude any items from I (Table 2). Thus, the remaining 14 items were used for the subsequent analyses.
Table 1. Mean, SD, skewness, and kurtosis of EASI items (N = 900).
ITEM Mean SD Skewness Kurtosis 1 cries easily 3.13 1.14 −.21 −.96 2 quick temper 3.49 1.11 −.36 −.80 3 upsets easily 3.31 1.06 −.36 −.37 4 frightens easily 2.69 1.03 .14 −.48 5 optimistic* 2.88 1.07 −.07 −.89 6 moves after waking up 3.34 1.05 −.13 −.80 7 always hyperactive 4.01 0.83 −.54 −.12 8 can’t sit for long time 2.90 1.06 −.06 −.67 9 prefers quiet games 2.88 1.05 .01 −.71 10 gets fidgety for meals 3.03 1.19 −.04 −1.05 11 makes friends easily 2.94 0.98 .11 −.67 12 stays with other people 2.78 1.10 .06 −.87
13 shy* 3.25 .92 −.27 −.30
14 independent 3.13 1.20 −.18 −1.02 15 plays by him/herself 3.02 1.01 .23 −.69 16 difficult self-control 3.13 1.14 −.21 −.96 17 impulsive 3.49 1.11 −.36 −.80 18 gets bored 3.31 1.06 −.36 −.37 19 withstands temptations* 2.69 1.03 .14 −.48 20 interest in a toy to another 2.88 1.07 −.07 −.89
*reverse item; Range of item scores 1 to 5.
Table 2. Cronbach’s alpha coefficient of each EASI subscale.
Subscales Items Cronbach’s alpha Emotionality 1, 5, 9, 13, 17 .603
1, 5, 9, 13 .672
1, 5, 9 .722
[image:6.595.210.537.583.739.2]DOI: 10.4236/psych.2019.1016138 2183 Psychology CFAs
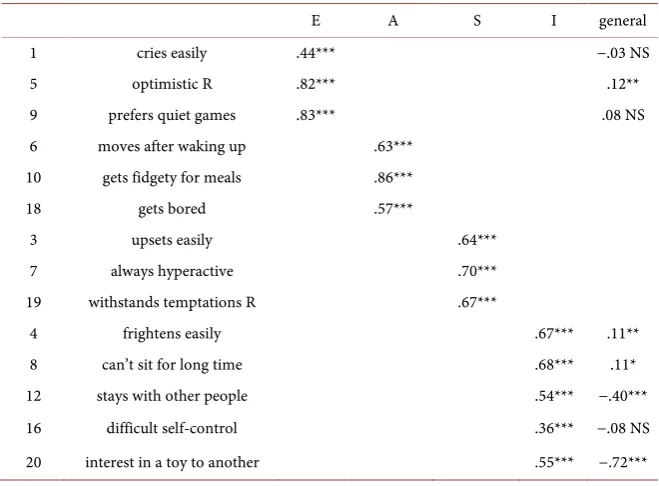
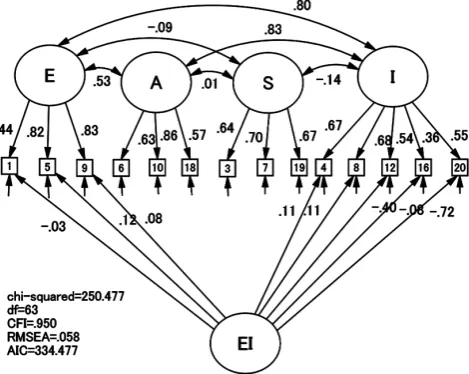
The first-order 4-factor structure model did not show acceptable fit with the data: χ2 (71) = 462.564, CFI = .895, RMSEA = .078, and AIC = 530.564 (Figure 1). There were substantial correlations between some factors of the EASI. Of these, the correlation between Emotionality and Impulsivity (r = .77) was theo-retically explainable. Therefore, we set a general factor influencing the items of both of these two factors (Table 3 and Figure 2). This model showed much bet-ter fit with the data: χ2 (63) = 250.477, CFI = .950, RMSEA = .058, and AIC = 334.477. We considered that this was the best model to explain the data of the EASI.
[image:7.595.252.498.235.386.2]Figure 1. The first-order 4-factor model. E, Emotionality; A, Activity; S, Sociability; I, Impulsivity; CFI, comparative fit index; RMSEA, root mean square error of approxima-tion; AIC, Akaike information criterion.
Table 3. Confirmatory factor analysis of EASI with 3 first-order factors and a general factor.
E A S I general
1 cries easily .44*** −.03 NS
5 optimistic R .82*** .12**
9 prefers quiet games .83*** .08 NS 6 moves after waking up .63***
10 gets fidgety for meals .86*** 18 gets bored .57***
3 upsets easily .64***
7 always hyperactive .70*** 19 withstands temptations R .67***
4 frightens easily .67*** .11**
8 can’t sit for long time .68*** .11* 12 stays with other people .54*** −.40*** 16 difficult self-control .36*** −.08 NS 20 interest in a toy to another .55*** −.72***
[image:7.595.209.539.471.714.2]DOI: 10.4236/psych.2019.1016138 2184 Psychology
Figure 2. The bifactor 4-factor model. E, Emotionality; A, Activity; S, Sociability; I, Im-pulsivity; CFI, comparative fit index; RMSEA, root mean square error of approximation; AIC, Akaike information criterion.
Measurement and structural invariance between different demographic attributes
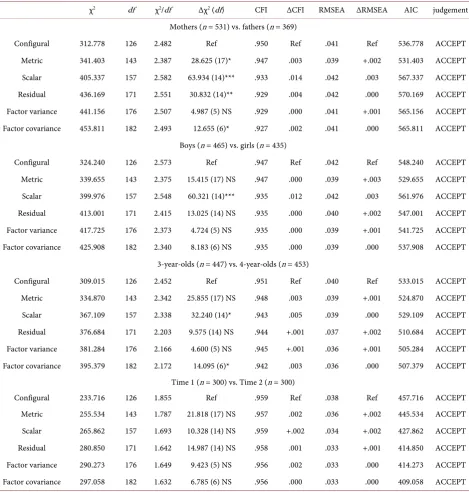
All of the comparisons between fathers and mothers, boys and girls, 3-year-old and 4-year-old, and times 1 and 2 proved that this 14-item EASI model was invariant from configural, metric, scalar, factor variance, and factor covariance perspectives (Table 4). Therefore, it was proved that this 14-item EASI has the same factor structure regardless of the gender of parents and children, and the age of children and that this scale does not change its factor structured when used repeatedly.
Compared to mothers, fathers rated A and I significantly higher but S lower. Girls were scored higher in A and General E/I than boys. Four-year-olds were rated significantly lower in factor means of E, A, and I than 3-year-olds. There was no factor mean difference in any of the factors between the two test occa-sions (Table 5).
4. Discussion
DOI: 10.4236/psych.2019.1016138 2185 Psychology
Table 4. Measurement and structural invariance of the EASI.
χ2 df χ2/df Δχ2 (df) CFI ΔCFI RMSEA ΔRMSEA AIC judgement
Mothers (n = 531) vs. fathers (n = 369)
Configural 312.778 126 2.482 Ref .950 Ref .041 Ref 536.778 ACCEPT Metric 341.403 143 2.387 28.625 (17)* .947 .003 .039 +.002 531.403 ACCEPT Scalar 405.337 157 2.582 63.934 (14)*** .933 .014 .042 .003 567.337 ACCEPT Residual 436.169 171 2.551 30.832 (14)** .929 .004 .042 .000 570.169 ACCEPT Factor variance 441.156 176 2.507 4.987 (5) NS .929 .000 .041 +.001 565.156 ACCEPT Factor covariance 453.811 182 2.493 12.655 (6)* .927 .002 .041 .000 565.811 ACCEPT
Boys (n = 465) vs. girls (n = 435)
Configural 324.240 126 2.573 Ref .947 Ref .042 Ref 548.240 ACCEPT Metric 339.655 143 2.375 15.415 (17) NS .947 .000 .039 +.003 529.655 ACCEPT Scalar 399.976 157 2.548 60.321 (14)*** .935 .012 .042 .003 561.976 ACCEPT Residual 413.001 171 2.415 13.025 (14) NS .935 .000 .040 +.002 547.001 ACCEPT Factor variance 417.725 176 2.373 4.724 (5) NS .935 .000 .039 +.001 541.725 ACCEPT Factor covariance 425.908 182 2.340 8.183 (6) NS .935 .000 .039 .000 537.908 ACCEPT
3-year-olds (n = 447) vs. 4-year-olds (n = 453)
Configural 309.015 126 2.452 Ref .951 Ref .040 Ref 533.015 ACCEPT Metric 334.870 143 2.342 25.855 (17) NS .948 .003 .039 +.001 524.870 ACCEPT Scalar 367.109 157 2.338 32.240 (14)* .943 .005 .039 .000 529.109 ACCEPT Residual 376.684 171 2.203 9.575 (14) NS .944 +.001 .037 +.002 510.684 ACCEPT Factor variance 381.284 176 2.166 4.600 (5) NS .945 +.001 .036 +.001 505.284 ACCEPT Factor covariance 395.379 182 2.172 14.095 (6)* .942 .003 .036 .000 507.379 ACCEPT
Time 1 (n = 300) vs. Time 2 (n = 300)
Configural 233.716 126 1.855 Ref .959 Ref .038 Ref 457.716 ACCEPT Metric 255.534 143 1.787 21.818 (17) NS .957 .002 .036 +.002 445.534 ACCEPT Scalar 265.862 157 1.693 10.328 (14) NS .959 +.002 .034 +.002 427.862 ACCEPT Residual 280.850 171 1.642 14.987 (14) NS .958 .001 .033 +.001 414.850 ACCEPT Factor variance 290.273 176 1.649 9.423 (5) NS .956 .002 .033 .000 414.273 ACCEPT Factor covariance 297.058 182 1.632 6.785 (6) NS .956 .000 .033 .000 409.058 ACCEPT
*p < .05; **p < .01; ***p < .001; NS, not significant.
Table 5. Factor mean invariance of the EASI.
Differences in factor mean (SE)
E A S I General (E + I)
Fathers compared with mothers .001 (.037) NS .199 (.053)*** −.265 (.054)*** .142 (.057)* −.098 (.061) NS Girls compared with boys .069 (.038) NS .184 (.053)*** .073 (.054) NS −.045 (.057) NS .212 (.057)*** 4-year-olds compared with 3-year-olds −.101 (.037)** −.156 (.052)** −.020 (.054) NS −.170 (.061)** −.064 (.061) NS
Time 2 compared with Time 1 .035 (.047) NS −.015 (.060) NS .069 (.060) NS .028 (.068) NS .035 (.066) NS
[image:9.595.59.541.628.712.2]DOI: 10.4236/psych.2019.1016138 2186 Psychology such as distress, fear, and anger. Impulsivity, on the other hand, reflects inhibi-tory control, decision time, persistence, and sensation seeking(Ohashi & Kita-mura, 2017). In our bifactor model, the general factor loaded significantly posi-tively on item 5 (not optimistic), item 4 (frightens easily), and item 8 (can’t sit for long time) whereas it loaded significantly negatively on item 12 (stays with other people) and item 20 (interest in a toy to another). Despite the difference in their representations, both temperament domains have common traits which are sensitivity to stimuli, difficulty of calming themselves, and inability to control emotions. This may depict a child that is less endurable, easily frightened, and socially withdrawn children.
In the development of the EASI, Impulsivity was later dropped because Buss and Plomin thought that Impulsivity was composed of various subcomponents that had shown only some replication by factor analyses. They also noted that Impulsivity did not meet their criteria of temperament (Buss & Plomin, 1984). Nevertheless, clinical significance of Impulsivity may justify the restoration of this category in the instrument. Considering our model, further research might be needed. Furthermore, recent developmental clinicians often notice that children with a developmental disability often have characteristics across mul-tiple diagnostic categories. This may indicate that there may be common ele-ments for the origins of different disabilities or that they affect each other. The fact that our bifactor model suggests the existence of a general factor across dif-ferent temperament domains might lead to explanations for this idea based on clinical observations.
A long-lasting methodological issue of children’s behaviours is rater bias, which can differ between parents, teachers, and researchers (e.g., Hinshaw, Han, Erhardt, & Huber, 1992;Hubert, Wachs, Peters-Martin, & Gadour, 1982;Kolko & Kazdin, 1993;Lyon & Plomin, 1981;Neale & Stevenson, 1989;Renouf & Ko-vacs, 1994; Satake, Yoshida, Yamashita, Kinukawa, & Takagishi, 2003; Yuh, 2017;Weissman et al., 1987). Bias is an obstacle in clinical research where par-ents are used as observers of child temperament. Our study found that the EASI’s factor structure was invariant in terms of parent and children’s gender, children’s age, and measurement occasions. This is encouraging as it allows the EASI to be used in clinical as well as research settings. However, factor means of A, S and I differed between mothers and fathers. This may mean that fathers overrate A and I and underrate S than mothers. Further studies may be required using the same families with the child and the two parents.
Limitations of this study include the inability to extrapolate the invariance of the measure to other measures of temperament.
DOI: 10.4236/psych.2019.1016138 2187 Psychology Despite these drawbacks, our study demonstrated that the EASI can be relia-bly used in a Japanese population. We confirmed the original 4-factor structure goodness-of-fit which was improved by the addition of a general factor combin-ing E and I.
Acknowledgements
We are grateful for all of the participants and the members of the Institutional Review Board of the Kitamura Institute of Mental Health Tokyo, who provided ethics advice on the net-survey.
Conflicts of Interest
The authors declare that they have no conflicts of interest.
Supported
This study was supported by JSPS KAKENHI Grant Number JP16K12170 (PI: Yukiko Ohashi).
References
Akaike, H. (1987). Factor Analysis and AIC. Psychometrika, 52, 317-332.
https://doi.org/10.1007/BF02294359
Bentler, P. M. (1990). Comparative Fit Indexes in Structural Models. Psychological Bulle-tin, 107, 238-246.https://doi.org/10.1037/0033-2909.107.2.238
Boer, F., & Westenberg, P. M. (1994). The Factor Structure of the Buss and Plomin EAS Temperament Survey (Parental Rating) in a Dutch Sample of Elementary School Children. Journal of Personality Assessment, 62, 537-551.
https://doi.org/10.1207/s15327752jpa6203_13
Brunner, M., Nagy, G., & Wilhelm, O. (2012). A Tutorial on Hierarchically Structured Constructs. JournalofPersonality, 80, 796-846.
https://doi.org/10.1111/j.1467-6494.2011.00749.x
Buss, A. H., & Plomin, R. (1975). ATemperamentTheoryofPersonalityDevelopment.
New York: John Wiley.
Buss, A. H., & Plomin, R. (1984). Temperament:Early DevelopingPersonality Traits.
Hillsdale, MI: Lawrence Earlbaum.
Buss, A., Plomin, R., & Willerman, L. (1973). The Inheritance of Temperaments. Journal of Personality, 41, 513-524.https://doi.org/10.1111/j.1467-6494.1973.tb00109.x
Chen, F. F. (2007). Sensitivity of Goodness of Fit Indexes to Lack of Measurement Inva-riance. Structural Equation Modeling, 14, 464-504.
https://doi.org/10.1080/10705510701301834
Chen, F. F., Hayes, A., Carver, C. S., Laurenceau, J.-P., & Zhang, Z. (2012). Modeling General and Specific Variance in Multifaceted Constructs: A Comparison of the Bifac-tor Model to Other Approaches. JournalofPersonality, 80, 219-251.
https://doi.org/10.1111/j.1467-6494.2011.00739.x
Cheung, G. W., & Rensvold, R. B. (2002). Evaluating Goodness-of-Fit Indexes for Testing Measurement Invariance. StructuralEquation Modeling, 9, 233-255.
DOI: 10.4236/psych.2019.1016138 2188 Psychology
Cronbach, L. J. (1951). Coefficient Alpha and the Internal Structure of Tests. Psychome-trika, 16, 297-333.https://doi.org/10.1007/BF02310555
Cucina, J., & Byle, K. (2017). The Bifactor Model Fits Better than the Higher-Order Mod-el in More than 90% of Comparisons for Mental Abilities Test Batteries. Journalof In-telligence, 5, 27.https://doi.org/10.3390/jintelligence5030027
Gesman, I., Purper-Ouakil, D., Michel, G., Mouren-Siméoni, M. C., Bouvard, M., Perez-Diaz, F., & Jouvent, R. (2002). Cross-Cultural Assessment of Childhood Tempe-rament: A Confirmatory Factor Analysis of the French Emotionality Activity and So-ciability (EAS) Questionnaire. EuropeanChild&Adolescent Psychiatry, 11, 101-107.
https://doi.org/10.1007/s00787-002-0248-4
Gibbs, M. V., Reeves, D., & Cunnigham, C. C. (1987). The Application of Temperament Questionnaires to a British Sample: Issues of Reliability and Validity. JournalofChild Psychologyand Psychiatry, 28, 61-77.
https://doi.org/10.1111/j.1469-7610.1987.tb00652.x
Gignac, G. E. (2008). Higher-Order Models versus Direct Hierarchical Models: Gas Su-perordinate or Breadth Factor? PsychologyScience Quarterly, 50, 21-43.
Goldsmith, H. H., Buss, A. H., Plomin, R., Rothbart, M. K., Thomas, A., Chess, S., McCall, R. B. et al. (1967). Roundtable: What Is Temperament? Four Approaches.
ChildDevelopment, 58, 505-529.https://doi.org/10.2307/1130527
Hinshaw, S. P., Han, S. S., Erhardt, D., & Huber, A. (1992). Internalizing and Externaliz-ing Behavior Problems in Preschool Children: Correspondence among Parent and Teacher Ratings and Behavior Observations. JournalofClinical Child Psychology, 21,
143-150.https://doi.org/10.1207/s15374424jccp2102_6
Hubert, N. C., Wachs, T. D., Peters-Martin, P., & Gadour, M. J. (1982). The Study of Ear-ly Temperament: Measurement and Conceptual Issues. Child Development, 53,
571-600.https://doi.org/10.2307/1129370
Kitamura, T., Ohashi, Y., Minatani, M., Haruna, M., Murakami, M., & Goto, Y. (2014). Emotionality Activity Sociability and Impulsivity (EASI) Survey: Psychometric Proper-ties and Assessment Biases of the Japanese Version. Psychology and Behavioral Sciences, 3, 113-120.https://doi.org/10.11648/j.pbs.20140304.12
Kolko, D. J., & Kazdin, A. E. (1993). Emotional/Behavioural Problems in Clinic and Non-clinic children: Correspondence among Child, Parent, and Teacher Reports. Journalof ChildPsychology & Psychiatry, 34, 991-1006.
https://doi.org/10.1111/j.1469-7610.1993.tb01103.x
Lyon, M. E., & Plomin, R. (1981). The Measurement of Temperament Using Parental Ratings. JournalofChildPsychology and Psychiatry, 22, 47-53.
https://doi.org/10.1111/j.1469-7610.1981.tb00530.x
Mathiesen, K. S., & Tambs, K. (1999). The EAS Temperament Questionnaire: Factor Structure, Age Trends, Reliability, and Stability in a Norwegian Sample. Journal of Child Psychiatry and Psychology, 40, 431-439.
https://doi.org/10.1111/1469-7610.00460
Neale, M. C., & Stevenson, J. (1989). Rater Bias in the EASI Temperament Scales: A Twin Study. JournalofPersonalityandSocial Psychology, 56, 446-455.
https://doi.org/10.1037/0022-3514.56.3.446
Ohashi, Y., & Kitamura, T. (2017). Emotionality Activity Sociability and Impulsivity (EASI). In V. Zeigler-Hill, & T. Shackelford (Eds.), Encyclopediaof Personalityand IndividualDifferences (Chapter 525, pp. 1-3). Berlin: Springer.
https://doi.org/10.1007/978-3-319-28099-8_26-1
DOI: 10.4236/psych.2019.1016138 2189 Psychology
C. et al. (1993). Genetic Change and Continuity from Fourteen to Twenty Months: The MacArthur Longitudinal Twin Study. ChildDevelopment, 64, 1354-1376.
https://doi.org/10.2307/1131539
Reise, S. P., Morizot, J., & Hays, R. D. (2007). The Role of the Bifactor Model in Resolving Dimensionality Issues in Health Outcome Measures. Quality of Life Research, 16,
19-31.https://doi.org/10.1007/s11136-007-9183-7
Renouf, A. G., & Kovacs, M. (1994). Concordance between Mothers’ Reports and Child-ren’s Self-Reports of Depressive Symptoms: A Longitudinal Study. Journal of the AmericanAcademyofChildandAdolescentPsychiatry, 33, 208-216.
https://doi.org/10.1097/00004583-199402000-00008
Satake, H., Yoshida, K., Yamashita, H., Kinukawa, N., & Takagishi, T. (2003). Agreement between Parents and Teachers on Behavioral/Emotional Problems in Japanese School Child Using the Child Behavior Checklist. ChildPsychiatryandHuman Development, 34, 111-126.https://doi.org/10.1023/A:1027342007736
Schermelleh-Engel, K., Moosbrugger, H., & Müller, H. (2003). Evaluating the Fit of Structural Equation Models: Tests of Significance and Descriptive Goodness-of-Fit Measures. MethodsofPsychological Research Online, 8, 23-74.
Spence, R., Owens, M., & Goodyer, I. (2013). The Longitudinal Psychometric Properties of the EAS Temperament Survey in Adolescence.JournalofPersonality Assessment, 95, 633-639.https://doi.org/10.1080/00223891.2013.819513
Vandenberg, R. J., & Lance, C. E. (2000). A Review and Synthesis of the Measurement Invariance Literature: Suggestions, Practices, and Recommendations for Organization-al Research. Organizational Research Method, 3, 4-70.
https://doi.org/10.1177/109442810031002
Weissman, M. M., Wickramarante, P., Warner, V., John, K., Prusoff, B. A., Merikangas, K. R., & Gammon, G., D. (1987). Assessing Psychiatric Disorders in Children: Discre-pancies between Mothers’ and Children’s Reports. Archives of General Psychiatry, 44,
747-753. https://doi.org/10.1001/archpsyc.1987.01800200075011
Yuh, J. (2017). Do Mothers and Fathers Perceive Their Child’s Problems and Prosocial Behaviors Differently? JournalofChildandFamily Studies, 26, 3045-3054.