UNDERLYING CAUSES AND DRIVERS OF LAND USE/COVER CHANGES IN BENIN: HOW CAN
REMOTE SENSING AND GEOGRAPHICAL INFORMATION SYSTEM HELP?
*,1
Vincent Joseph MAMA,
2Joseph OLOUKOI,
and
1
National Institute for Agricultural Research of Benin (INRAB), 06 BP 1105 Cotonou
2
Department of Cartography African Regional Institute for Geospatial Information Science and technology
Obafemi Awolowo University Campus,
3
Research and Social Actions for Development (ReSAD)
4
Université d’Abomey Calavi (UAC)
Biogéographie et d’Expertise Environnementale (LABEE) Abomey
5
Institut Régional Africain des Sciences et Technologies de l’Information Géospatiale (AFRIGIST) Tel 229
ARTICLE INFO ABSTRACT
This study aims at improving the understanding of the processes of land use/cover change in a Central Region of Benin Republic. In this vein, an integrated approach that links satellite observations of land cover change at fine and temporal resolution to s
growing stock estimation was used. This approach was based on a multi scale methodology using Multispectral (XS) Spot and Landsat Thematic Mapper (TM) for the multi
use/cover change. A fo
stock. To provide reliable information on the plant communities indices such as specific richness, Shannon index,
stage sampling procedure, a total of 202 respondents were selected and interviewed. To predict land use change the Markov model approach was used. In all,
transition probabilities.
and socio economic data in addition to growing stock volume data can be integrated together to document causes and processes of land use/cover change and to improve the understanding of the social consequences and social dynamics related to these land use/cover changes.
Copyright © 2017, Vincent Joseph MAMA et al. This unrestricted use, distribution, and reproduction in any medium,
INTRODUCTION
Over the past decades, change in resource use has attracted a lot of attention of researchers. This is not only due to the immediate effects but also because policy makers have become increasingly aware and alerted of the adverse, social and economic consequences of these changes. Land use /cover change is a significant agent of change which is affected by climatic change, loss of biodiversity and the sustainability of human
interaction (Turner et al., 1994; Lambin, 1997). According to Skole and Turker (1993), land use/cover involves considerations of human behaviour, with particular crucial roles played by policy makers, institutions, and initial conditions of land cover and so on.
*Corresponding author: Vincent Joseph MAMA,
National Institute for Agricultural Research of Benin (INRAB), 06 BP 1105 Cotonou
ISSN: 0975-833X
Vol.
Article History:
Received 18th August, 2017
Received in revised form 22nd September, 2017
Accepted 27th October, 2017
Published online 30th November, 2017
Citation: Vincent Joseph MAMA, Joseph OLOUKOI, Adeyemi CHABI, Salomon CHABI ADIMI and Thibaut Fabrice DOVONOU,
“Underlying causes and drivers of land use/cover changes in benin: how can remote sensing and geographical information system help?” Journal of Current Research, 9, (11), 61034-61044.
Key words:
Multispectral (XS) Spot, Landsat Thematic Mapper, Land use/cover change, Geographical information system, Plant communities indices.
Key words:
Multispectral (XS) Spot, Landsat Thematic Mapper, Land use/cover change, Geographical information system, Plant communities indices.
RESEARCH ARTICLE
UNDERLYING CAUSES AND DRIVERS OF LAND USE/COVER CHANGES IN BENIN: HOW CAN
REMOTE SENSING AND GEOGRAPHICAL INFORMATION SYSTEM HELP?
Joseph OLOUKOI,
3Adeyemi CHABI,
4Salomon CHABI ADIMI
and
5Thibaut Fabrice DOVONOU
National Institute for Agricultural Research of Benin (INRAB), 06 BP 1105 Cotonou
Department of Cartography African Regional Institute for Geospatial Information Science and technology
Obafemi Awolowo University Campus, PMB 5545, Ile-Ife, Nigeria
Actions for Development (ReSAD), NGO BP 2253, Abomey Calavi
Université d’Abomey Calavi (UAC), Faculté des Sciences Humaines et Sociales (FASHS), Laboratoire de
ie et d’Expertise Environnementale (LABEE) Abomey-Calavi, Bénin. Tel 22961732960
Institut Régional Africain des Sciences et Technologies de l’Information Géospatiale (AFRIGIST) Tel 229
96213570
ABSTRACT
This study aims at improving the understanding of the processes of land use/cover change in a Central Region of Benin Republic. In this vein, an integrated approach that links satellite observations of land cover change at fine and temporal resolution to socio-economic analysis of land use change and to growing stock estimation was used. This approach was based on a multi scale methodology using Multispectral (XS) Spot and Landsat Thematic Mapper (TM) for the multi
use/cover change. A forest survey was carried out to estimate the plant diversity and the growing stock. To provide reliable information on the plant communities indices such as specific richness, Shannon index, Pielou equitability index and coefficient of variation were determ
stage sampling procedure, a total of 202 respondents were selected and interviewed. To predict land use change the Markov model approach was used. In all, a statistical model was developed for forest transition probabilities. In summary, this study has highlighted how a combination of GIS techniques and socio economic data in addition to growing stock volume data can be integrated together to document causes and processes of land use/cover change and to improve the understanding of the
cial consequences and social dynamics related to these land use/cover changes.
This is an open access article distributed under the Creative Commons medium, provided the original work is properly cited.
, change in resource use has attracted a lot of attention of researchers. This is not only due to the immediate effects but also because policy makers have become increasingly aware and alerted of the adverse, social and economic ges. Land use /cover change is a significant agent of change which is affected by climatic change, loss of biodiversity and the sustainability of human-environment ., 1994; Lambin, 1997). According to use/cover involves considerations of human behaviour, with particular crucial roles played by policy makers, institutions, and initial conditions of land cover and so on.
search of Benin (INRAB), 06 BP 1105
Lambin et al. (1998) stated that land use/cover change takes place under the influence of a number of driving forces such as population, technology, political changes, consumption income and trade data and all at a regional level of spatial desegregation. As pointed out by Turner (1997), most of the world’s major environmental issues and global environmental changes are attributed to land use and land cover changes. This assertion is substantially true for desertification, biodiversity loss resulting from habitat degradation and fragmentation and other forms of land degradation. From the above, it is vividly shown that land use/cover change is a complex process which analysis requires an understanding of its processes. To tackle this situation, assessment of current concepts, ideas, opinions and perception of the nature of land use/cover change data, has shown that no single data exists which can sufficiently describe the implicated processes. Thus, it becomes necessary to use an integrated methodological approach
International Journal of Current Research Vol. 9, Issue, 11, pp.61034-61044, November, 2017
Vincent Joseph MAMA, Joseph OLOUKOI, Adeyemi CHABI, Salomon CHABI ADIMI and Thibaut Fabrice DOVONOU,
over changes in benin: how can remote sensing and geographical information system help?”
Available online at http://www.journalcra.com
z
UNDERLYING CAUSES AND DRIVERS OF LAND USE/COVER CHANGES IN BENIN: HOW CAN
REMOTE SENSING AND GEOGRAPHICAL INFORMATION SYSTEM HELP?
Salomon CHABI ADIMI
National Institute for Agricultural Research of Benin (INRAB), 06 BP 1105 Cotonou
Department of Cartography African Regional Institute for Geospatial Information Science and technology.
Ife, Nigeria
NGO BP 2253, Abomey Calavi
Faculté des Sciences Humaines et Sociales (FASHS), Laboratoire de
Calavi, Bénin. Tel 22961732960
Institut Régional Africain des Sciences et Technologies de l’Information Géospatiale (AFRIGIST) Tel 229
This study aims at improving the understanding of the processes of land use/cover change in a Central Region of Benin Republic. In this vein, an integrated approach that links satellite observations of land economic analysis of land use change and to growing stock estimation was used. This approach was based on a multi scale methodology using Multispectral (XS) Spot and Landsat Thematic Mapper (TM) for the multi-scale study of land rest survey was carried out to estimate the plant diversity and the growing stock. To provide reliable information on the plant communities indices such as specific richness, equitability index and coefficient of variation were determined. Using a four stage sampling procedure, a total of 202 respondents were selected and interviewed. To predict land a statistical model was developed for forest this study has highlighted how a combination of GIS techniques and socio economic data in addition to growing stock volume data can be integrated together to document causes and processes of land use/cover change and to improve the understanding of the
cial consequences and social dynamics related to these land use/cover changes.
Commons Attribution License, which permits
(1998) stated that land use/cover change takes place under the influence of a number of driving forces such as population, technology, political changes, consumption income and trade data and all at a regional level of spatial desegregation. t by Turner (1997), most of the world’s major environmental issues and global environmental changes are attributed to land use and land cover changes. This assertion is substantially true for desertification, biodiversity loss resulting ation and fragmentation and other forms of land degradation. From the above, it is vividly shown that land use/cover change is a complex process which analysis requires an understanding of its processes. To tackle this situation, assessment epts, ideas, opinions and perception of the nature of land use/cover change data, has shown that no single data exists which can sufficiently describe the implicated processes. Thus, it becomes necessary to use an integrated methodological approach
INTERNATIONAL JOURNAL OF CURRENT RESEARCH
Vincent Joseph MAMA, Joseph OLOUKOI, Adeyemi CHABI, Salomon CHABI ADIMI and Thibaut Fabrice DOVONOU, 2017.
to deal with the phenomenon of land use/cover change. As stressed by Veldkamp and Fresco (1997), the largest gap in the study of land use/cover change is not the extent, pace and trajectories of land cover changes which can be approached by means of remote sensing but the functional understanding and adequate selection of variables which are able to characterize the relation and inter-dependencies of elements of the land-use system. Therefore, quantification of land use/cover changes can be tackled through direct observations using remote sensing, field measurement and interviews and modelling. To analyse land use/cover changes, different research approaches have been applied. These approaches evolved from different perspectives in the analysis of land use/cover change. From a socio economic point of view, analysis is focused on human–environment interactions at micro-scale using narrative approaches. The social scientists are more concerned with things that happen than where they happened (Verburg et al.
2000). Therefore, lack of a spatial perspective in micro-studies ignores the context of the studied behaviour. In this vein, it was proposed a synthetic method that merged socio-economic household survey data and remote sensing based information (Mertens, et al. 2000; Pontius, 2000; Lambin and Ehrlich., 1997). More precisely, Turner (1997) suggested socializing the pixel. This implies an integrated method that links remote sensing data and socio-economic data and also to work from the micro level e.g. individual at household level to macro scale at regional level.
However, this method, itself is limited because the outputs of such analysis are based only on land cover data. The changes are expressed in terms of areas lost, converted or transformed. Nothing is done about the plant diversity of the study area. The growing stock variation resulting from these changes during the periods of observation is also not taken into account. On the other hand, assessment of the amount of wood lost due to these changes is missing. Therefore, a forest survey data could help to fill this gap. Many assessments of land use/cover changes have been undertaken in the Republic of Benin, but most of them if they are not carried out in small scale; they rarely integrate remote sensing data with socio economic. On the other hand, data to estimate changes in resource use are not all reliable and in most of the cases, where data exist, they are obsolete and no longer reliable. Thus, there is an urgent need to provide updated datasets to analyse these changes. With the loopholes found in the methodology used by researchers in the past, there is a need to improve it by integrating remote sensing data to socio economic data in addition to growing stock data obtained from forest surveys. This study, by contributing to improve this framework, will help through information that this will yield, to increase our knowledge and understanding of land use/cover change causes in its wider sense.
MATERIALS AND METHODS
The study area
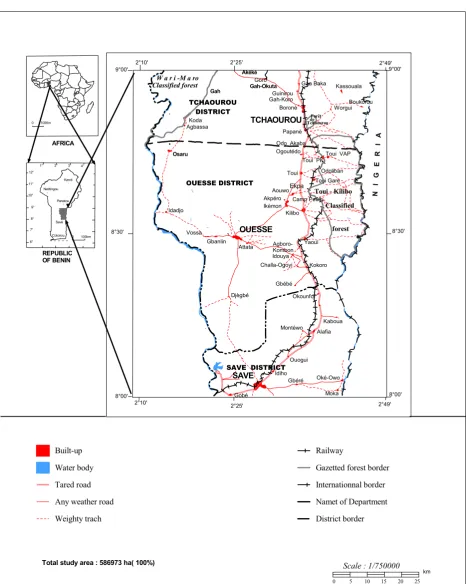
The study area is located in the central part of Benin Republic. It lies between latitude 8°00'E and 9°00' N and is limited by Oueme river in its west part and Nigeria frontier in the east by Okpara river. Its surface area covers an area of 580, 900 ha. Administratively, the study area is included in the Department of Collines. It is composed of three districts: Save in the south, Ouesse in the middle and part of Tchaourou in the north. The total population of the study area amounts to 140,434 inhabitants of which 49.6% are male. According to population density evaluated at district level, this population is not uniformly distributed. The highest population density was recorded in Save District with 43
people per km2 and the lowest in Tchaourou district where it is estimated at 18 individuals per km2. Ouesse District has 20 inhabitants per km2. The mean population density is estimated at 23 persons per km2. The availability of fertile soils has made this study area highly attractive to many migrants. Migrants come from the most populated regions in the south and north of the country (Mama and Oloukoi, 2010).
The selection of the study area was based on several reasons of which some are enumerated below:
(i) This area is characterized by a relative resource abundance which attracts during each growing season many migrants from the dense southern and northern regions of the country; (ii) This area is one of the regions of the country where there is widespread land use change despite many programmes involving participatory management being implemented in some parts of the country; (iii) Diversity in population of this area has induced diversity in land use types; (iv) This area is fully covered by satellite imageries (SPOT and LANDSAT TM) and aerial photographs which are of great importance in this study; (v) Accessibility of the area is easy because of its location in the Central part of the country.
Methods used
For this study Spot XS imageries in addition to Landsat sub scenes were used to evaluate the magnitude and the rate of biomass change. Where possible, aerial photographs were also used to provide additional information especially during the field check activities. These satellite imageries were the less cloud-free covering the study area. They were available on digital and on paper print format, thus, allowing interpretation using methods combining analogical and digital analysis. Classification of vegetation was performed on the basis of IGBP classification, which is an advanced, and an improved version of FAO’s classification (Baltaxe, 1985). In addition to vegetation classes, this classification takes into account other features, such as built-up areas, water table, bare soils, etc. To adopt this classification scheme, three assumptions were made: (i) The classification has to be exhaustive in a way that every pixel should be assigned to one of the proposed classification categories; (ii) No category in the classification shall overlap with another. Where a class is a mixture of two or more classes, the mixture has to be exclusive; (iii) The classification is structured in such a way that equivalent categories can be recognised on the imagery and on the ground (Baltaxe, 1985).
Growing stock volume estimation
A stratified random sampling design was adopted among other inventory methods commonly used. With this method, each stratum is allocated a plot number proportional to its area. According to Kent and Coker (1994) this method is appropriate when the number of strata is rather small and the area is well accessible. In addition this method offers some advantages in terms of cost effectiveness, time saving and ease of implementation. The method was implemented using a multiphase procedure. The first phase is the stratification through mapping and the second step is
the sampling itself based on legend units obtained from mapping. With this method, the following activities were undertaken: Mapping and stratification, Field survey, Data arrangement, Wood volume estimation. The total plots surveyed were determined as
follows:
SE Cv t n . ² ² .
With t = 2.0; Cv = 49% Then n = 5; E = 20% ; S = 2.1
[image:3.595.68.535.50.635.2]The plots surveyed were distributed within the main strata according to their importance
Figure 1. Study area location ! ! ! ! ! ! ! 940 Kilibo Ikèmon Camp Peulh Akpéro Ekpa Toui Toui Gare Malété Ogoutédo Odo Akaba
Papanè TCHAOUROU Boronè Worgui Gaa Baka Guinirou ! Ayétoro Owodé Owolafè Okpara Okpara Okpara Ogbagba Amadougba Tintinhou Afid ifa Odoliban Beffa Aouw o Kilibo Aouwo Beffa Esséakouon S inlingn in S inling in Koda Agbassa N I G E R I A
Toui PK
#
#
#
#
#
Toui VAP !! !! Forêt de Tchaourou
Toui - Kilibo
OUESSE SAVE 9°00' 8°30' 8°00' 2°49' 2°10' 2°25' 2°49' 2°25' 2°10' 9°00' 8°30' 8°00' 0 100Km AFRICA Gbébé Kokoro Okounfo Kaboua Alafia Montéwo Ouogui Idiho Yaoui Idouya Challa-Ogoyi Agboro-Kombon Idadjo Vossa Gbanlin Attata Gbéré Oké-Owo Moka Gobé Goro Djègbé 12°
1° 2° 3° 4°
11° 10° 9° 8° 7° 6° Cotonou Savè Kandi Natitingou Parakou 0 100km
Total study area : 586973 ha( 100%) Osaru Gah Akéké Gah-Okuta Gah-Koro Kassouala Boukorou TCHAOUROU DISTRICT OUESSE DISTRICT
SAVE DISTRICT
W a r i -M a ro Classified forest
Classified
forest
STUDY AREA LOCATION
REPUBLIC OF BENIN
Built-up
Water body
Tared road
Any weather road
Weighty trach
Railway
Gazetted forest border
Internationnal border
Namet of Department
District border
Scale : 1/750000
25 20 15 10 5 0 km
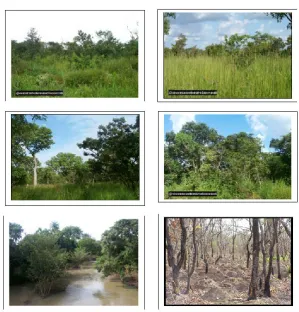
Figure 2. Different types of the physiognomy of the vegetation
Table 1. Classification accuracy confusion matrix
Field checked points
User’s accuracy % GF OF WS TS TSS SS AL B-u Water Total*
Classification results
GF 13 2 00 00 00 00 00 00 00 15 86.7
OF 1 11 3 00 00 00 00 00 00 15 73.3
WS 1 3 123 42 5 2 00 00 00 176 69.9
TS 00 2 42 157 19 4 00 00 00 224 70.1
TSS 00 00 4 3 50 00 13 00 00 70 71.4
SS 00 00 2 00 00 7 00 00 00 9 77.8
AL 00 00 00 38 45 00 200 2 00 285 70.2
B-U 00 00 00 00 00 00 00 3 00 3 100
Water 00 00 00 00 00 00 00 00 10 10 100.
Total 15 18 174 240 112 13 206 5 10 807
Producer accuracy % Confusion %
86.7 13.3
61.1 38.9
70.7 29.3
65.4 34.6
44.6 55.4
53.8 46.2
97.1 2.9
60 40
100 0
71.1
Note: * represents the total of given points per class. The amount of points increases proportionally with the extent of the LUC class.
Table 2. Rates of accuracy variation in case of merged LUC classes
Overall accuracy % 71.1 88.1 23.9%
User’s accuracy % 79.9 84.7 6.0%
Producer’s accuracy % 70.8
90 27.1%
Kappa
0.65 0.76 16.9% Normal classification
Merged classification Rate Variation %
Table 3. Distribution of LUC per district
LUC classes
Ouesse Save Tchaourou
ha % ha % ha %
Gallery forest 10889 3.4 2510 2.3 1153 0.7
Open and dense forest 11094 3.5 - - 4748 3.0
Woody savannah 81302 19.7 13850 12.4 33180 21.2
Tree savannah 83729 26.3 26147 18.1 51667 30.6
Tree shrub savannah 11 056 3.5 8333 13.4 16203 12.8
Plantation 26327 8.3 350 0.3 - -
Saxicolon Savannah 2209 0.7 643 0.6 4070 2.6
Agricultural lands 106214 33.3 56433 50.6 43989 28.1
Built-up 73 0,1 806 0.7 476 0.3
Water table 4455 1.4 1838 1.7 1131 0.7
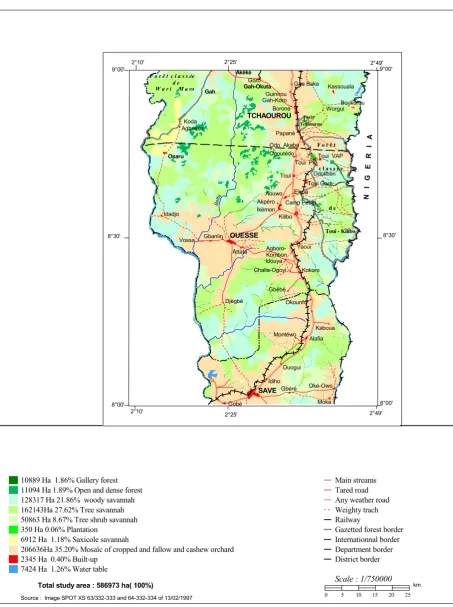
[image:4.595.131.465.586.637.2] [image:4.595.133.465.667.793.2]Figure 3. Land use/cover
Table 4. Tree species distribution
Stratum GF OF WS TS TSS Total
Number of plots 2 2 17 22 7 50
Number species 32 24 47 52 38 63
Number trees/ha 550 525 786 852 473 638
Number trees/species 4 5 28 20 16 17
Mean DBH (cm) 14,85 13,25 13 14,21 9 12,7 Mean TH (m) 9,35 10,36 7,66 8,31 5,81 7,68
GF: Gallery forest; OF: Open Forest; WS: Woody savannah; TS: Tree savannah
940
Kilibo Ikèmon
Camp Peulh Akpéro
Ekpa
Toui
Toui Gare
Malété
Ogoutédo Odo Akaba
Papanè
TCHAOUROU
Boronè Worgui
Gaa Baka
Guinirou
!
Ayétoro Owodé
Owolafè
Okp ara
O
kpara
O kpara
Ogbagba
Amado ugba Tintinhou
A
fid ifa
Odoliban
Beffa Aouwo
Kilibo
Aouwo
Be ffa
Esséa ko uon
S
inlingn
in
S inling
in
Koda Agbassa
N
I G
E R I
A
Toui PK
#
#
##
#
Toui VAP !! !!
F o r ê t
c l a s s é e
d e
Forêt de Tchaourou d e
F o r ê t c l a s s ée
W a r i M a ro
Toui - Kilibo
OUESSE
SAVE
9°00'
8°30'
8°00'
2°49' 2°10'
2°25'
2°49' 2°25'
2°10' 9°00'
8°30'
8°00'
REPUBLIC OF BENIN
Image SPOT XS 63/332-333 and 64-332-334 of 13/02/1997
Gbébé
Kokoro
Okounfo
Kaboua
Alafia Montéwo
Ouogui
Idiho Yaoui
Idouya Challa-Ogoyi
Agboro-Kombon Idadjo
Vossa Gbanlin
Attata
Gbéré Oké-Owo
Moka Gobé
Goro
Djègbé
LAND USE/COVER MAP
Total study area : 586973 ha( 100%) Osaru
Gah
Akéké
Gah-Okuta
Gah-Koro
Kassouala
Boukorou
Source :
10889 Ha 1.86% Gallery forest 11094 Ha 1.89% Open and dense forest 128317 Ha 21.86% woody savannah 162143Ha 27.62% Tree savannah 50863 Ha 8.67% Tree shrub savannah 350 Ha 0.06% Plantation
6912 Ha 1.18% Saxicole savannah
206636Ha 35.20% Mosaïc of cropped and fallow and cashew orchard 2345 Ha 0.40% Built-up
7424 Ha 1.26% Water table
Main streams Tared road Any weather road Weighty trach Railway
Gazetted forest border Internationnal border Department border District border
Scale : 1/750000
25 20 15 10 5 0
km
[image:5.595.135.458.718.787.2]To characterize tree species, indexes were calculated from data collected on species frequency. The frequency of a species is the recorded number of these species. These indexes are expressed as follows: (i) The Specific richness (N0); (ii) The
Shannon diversity index (ISH), one of the most well known and
widely used indices to compare diversity of different types of vegetation; (iii) Pielou equitability index (Eq) which was expressed as the ratio of the observed diversity with the maximum possible diversity for N species. Hence, its maximum value is 1. When the observed species have similar frequencies, Eq value becomes higher. In contrast, when the ratio is likely to be equal to zero, the observed population has some dominant species and some with small number of tree species; (iv) Coefficient of variation, which is a statistics, used in forest inventory to show the relative variability of tree stands surveyed. A high value indicates that the tree species is not well spread in all the plots or its frequencies vary a lot within localities. Linkage between vegetation groups within different tree stands was performed using factorial analysis. For data analysis, data were integrated using Excel and then transferred to STATSOFT for finite analysis. From above, it was stated that important changes in land use/land cover were recorded in the study area. These changes result from conversion of woody vegetation to agricultural lands and settlements. The driving forces behind these changes are attributed to human activities. In this regard, a population survey was conducted. A four-stage procedure was used to determine which settlements and households to target in the study area. Care was taken to have large samples including households with recent migrants as well as households without migrants. Analysis of these socio- economic data collected was performed using STATSOFT and Excel package software.
Data obtained from analysis of land use/cover over the study period and socio-economic survey, represents a panel that can be analyzed using regression modeling. The basic goal of developing the model is to test for linear functional relationships between land use/cover change variables and the predictors or independent variables influencing land use/cover change. The technique used in this study logistic multiple regressions (LMR). It is designed to estimate the parameters of a multivariate explanatory model in situation where the dependent variable is categorical and the independent variables are continuous or categorical.
RESULTS
Classification accuracy assessment
Based on results of the classification and the field-check points, nine land use/cover classes were identified. A confusion matrix was constructed to present the level of accuracy for each of the nine LUC classes. Analysis of this matrix indicates that some LUC classes were classified and mapped more reliably than others. Whereas some LUC classes show very low confusion index because they are easy to delineate, higher confusion indexes were recorded on other classes. The lowest confusion was for Water table (0%), Agricultural land (2.9%) and Gallery forest (13.3%). Tree Shrub Savannah and Saxicolon savannah scored the highest confusion indexes with respectively 55.4 % and 46.2%. This indicates a poor discrimination of these two areas from other classes. Overall, the classification accuracy permits full understanding of the maximum likelihood classification
performance. As it is confirmed by kappa index, the detail level of LUC classification offers reliable and satisfactory results which can be applied in the frame of this work.
Analysis of remotely sensed data of the study area resulted in the production of two series of LUC maps. As shown in Figure 3 & 4, savannah is the main tree formation. Tree shrub savannah is the dominant class with 36% of the entire study area. Forest tree community (gallery forests, open and dense forests) accounts only for 4 %. Plantations consist mainly of teak
(Tectona grandis). Cashew orchards are difficult to distinguish
from fallows. Detailed analysis of LUC per district reveals some discrepancy. As shown in Table 2, LUC classes are not equally distributed in each of the three districts. There was great variation from one district to another. Vegetation classes distribution presented the following order: Tchaourou (68.29%), Ouesse (56.32%) and Save (46.14%). Some LUC classes are either missing or in smaller proportion in some districts, others are in abundance. In Save district, the open and deciduous forests class was missing. In Tchaourou, no plantation was recorded.
The following observations were made from land use /cover pattern:
(i) Land use/land cover has developed in relation to the road network
(ii)Most settlements are recorded along the main roads (iii)New settlements are located not far away from the old
ones.
(iv) New farmlands are also detected in addition to the existing ones.
(v)Cultivated and built-up classes as shown in the land cover map amounted to about 36% of the total study area. This is an indication of the low density of the population, and by implication more land for new settlers.
(vi)There is evidence that high in-migration of settlers will continue to be recorded.
Consequently, a lot of forested lands will continue to be converted to croplands at an unprecedented rate. Due to the increasing human pressure on these resources, there is a need to evaluate the trends and rates of change in the status of these resources.
Importance of tree species distribution
The results of the survey are summarized in Table 4. A total of 63 tree species were recorded from 50 plots surveyed in which 2,978 individual trees with DBH more than 5 cm were recorded. The tree mean population per ha is 638. This is quite higher than data collected from Trois Rivieres gazetted forest located in a zone north of the study area (Mama and Oloukoi, 2010).
Characteristics of the tree species
A total of 63 different species and 2978 individual trees were recorded in the 50 surveyed plots. The dominant tree species recorded were as follows: Anogeissus leiocarpus, Burkea africana, Combretum molle, Daniellia oliveri, Khaya senegalensis,
Marantes polyandra, Pterocarpus erinaceus, Terminalia
Table 5. Distribution of the most abundant tree species per stratum
Species G F OF WS TS TSS TOTAL
Anogeissus leiocarpus 6 22 129 7 50 186
Burkea africana 4 3 54 25 84 163
Combretum molle 61 13 41 115
Daniellia oliveri 5 1 74 84 59 217
Khaya senegalensis 7 1 82 71 153
Marantes polyandra 6 1 60 15 77 152
Pterocarpus erinaceus 4 6 107 13 58 178
Tectona grandis 1 102 102
Terminalia avicennoides 4 1 3 55 44 102
Uapaca toboensis 3 5 102 10 112
No of trees/strata Total population
39 41 774 212 494 1480 117 105 1101 1054 601 2978
GF: Gallery forest; OF: Open Forest; WS: Woody savannah; TS: Tree savannah TSS: Tree Shrub savannah
Table 6. Analysis of tree stand
Stratum Specific richness No
Shannon Index Ish
Equitability Pielou index
Coefficient of variation Cv ( %)
Representative species
Gallery forest 32 3.88±0.05 0.92±0.02 159
Mytragina inermis, Anogeissus leiocarcarpus Daniellia olvieri
Isoberlinia doka Afzelia africana Burkea africana
Terminalia avicenoides Detarium microcarpa
Anona senegalensis Vitellaria paradoxa
Open Forest 24 2.80±0.56 0.77±0.03 257
Woody
Savannah 47 3.92±0.16 0.30±0.06 173
Tree savannah 52 3,76±0,16 0.28±0.10 127
Tree Shrub Savannah 38 3.41±0.40. 0.86±0.08 161
Table 7. Estimation of growing stock per stratum
Stratum GF OF WS TS TSS
Number of strata 2 2 17 22 7
Area/ stratum 10, 889 11,094 128 317 162 143 50 863 Total Volume recorded (m3) 14.9 11.1 76.1 96.9 11,5
Volume/ha (m3.ha-1) 74.8 55.4 44.8 44.1 16.4
Proportion of stratum (%) 1.8 1.9 21.9 27.6 8.7 Total volume (m3) 814,224.9 614,052.9 5,744,752.1 7,145,642.0 836,187.7
[image:7.595.39.568.229.339.2]GF: Gallery forest; OF: Open Forest; WS: Woody savannah; TS: Tree savannah TSS: Tree Shrub savannah
Table 8. Total growing stock estimate results
Total Volume of the study area 15,154,859.7 m3
Total average growing stock (m3/ha) 41.7 m3/ha
Total of strata variances 384.9
Stand error 2.7
Confidence Interval of average growing stock (m3/ha) 5.5
Error ratio 13.3%
Table 9. Mean annual rate of land use over change (ha/year)
1986 – 1997 1997-1999 1999-2007 Time Period 11 years 2 years 8 years Mean Annual rate of change 1.85 3.81 3.1
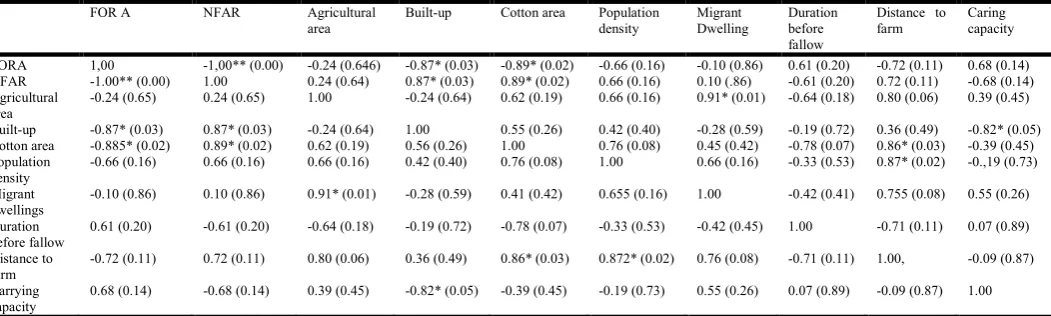
Table 10. Correlation matrix between different variables
FOR A NFAR Agricultural
area
Built-up Cotton area Population
density
Migrant Dwelling
Duration before fallow
Distance to farm
Caring capacity
FORA 1,00 -1,00** (0.00) -0.24 (0.646) -0.87* (0.03) -0.89* (0.02) -0.66 (0.16) -0.10 (0.86) 0.61 (0.20) -0.72 (0.11) 0.68 (0.14)
NFAR -1.00** (0.00) 1.00 0.24 (0.64) 0.87* (0.03) 0.89* (0.02) 0.66 (0.16) 0.10 (.86) -0.61 (0.20) 0.72 (0.11) -0.68 (0.14)
Agricultural area
-0.24 (0.65) 0.24 (0.65) 1.00 -0.24 (0.64) 0.62 (0.19) 0.66 (0.16) 0.91* (0.01) -0.64 (0.18) 0.80 (0.06) 0.39 (0.45)
Built-up -0.87* (0.03) 0.87* (0.03) -0.24 (0.64) 1.00 0.55 (0.26) 0.42 (0.40) -0.28 (0.59) -0.19 (0.72) 0.36 (0.49) -0.82* (0.05)
Cotton area -0.885* (0.02) 0.89* (0.02) 0.62 (0.19) 0.56 (0.26) 1.00 0.76 (0.08) 0.45 (0.42) -0.78 (0.07) 0.86* (0.03) -0.39 (0.45)
Population density
-0.66 (0.16) 0.66 (0.16) 0.66 (0.16) 0.42 (0.40) 0.76 (0.08) 1.00 0.66 (0.16) -0.33 (0.53) 0.87* (0.02) -0.,19 (0.73)
Migrant dwellings
-0.10 (0.86) 0.10 (0.86) 0.91* (0.01) -0.28 (0.59) 0.41 (0.42) 0.655 (0.16) 1.00 -0.42 (0.41) 0.755 (0.08) 0.55 (0.26)
Duration before fallow
0.61 (0.20) -0.61 (0.20) -0.64 (0.18) -0.19 (0.72) -0.78 (0.07) -0.33 (0.53) -0.42 (0.45) 1.00 -0.71 (0.11) 0.07 (0.89)
Distance to farm
-0.72 (0.11) 0.72 (0.11) 0.80 (0.06) 0.36 (0.49) 0.86* (0.03) 0.872* (0.02) 0.76 (0.08) -0.71 (0.11) 1.00, -0.09 (0.87)
Carrying capacity
0.68 (0.14) -0.68 (0.14) 0.39 (0.45) -0.82* (0.05) -0.39 (0.45) -0.19 (0.73) 0.55 (0.26) 0.07 (0.89) -0.09 (0.87) 1.00
** Correlation is significant at the 0.01 level (2-tailed); * Correlation is significant at the 0.05 level (2-tailed); () Probability
[image:7.595.133.474.369.438.2] [image:7.595.45.571.635.793.2]An analysis of each vegetation type or stratum shows the following richness: Open and gallery forests are characterized by Anogeissus leiocarpus, Daniellia oliveri, Dichrostachys cinerea, and
Isoberlinia doka. In wooded savannah where the highest tree
population per ha was recorded, the most abundant species were:
Vitellaria paradoxa, Terminalia avicennoides, Pterocarpus
erinaceus, Isoberlinia doka and Anogeissus leiocarpus. On the
other hand, tree savannah and shrub tree savannah are dominated
by Vitellaria paradoxa, Burkea africana, Parinari curatellifolia,
Pterocarpus erinaceus Terminalia avicennoides, Combretum
hypopilinum, Detarium microcarpum and Daniellia oliveri. Some
[image:8.595.112.496.53.372.2]tree species such asBurkea africana, Pterocarpus erinaceus
Figure 4. Land use/cover change trajectory analysis using time series and multi temporal image sources
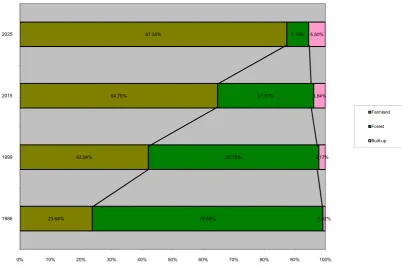
Figure 5. Estimated land use/cover of the study area share in years 2015 and 2025 23.64%
42.04%
64.70%
87.35%
75.55% 55.79%
31.47% 7.15%
0.82% 2.17% 3.84% 5.50%
0% 10% 20% 30% 40% 50% 60% 70% 80% 90% 100%
1986 1999 2015 2025
Farmland
Forest
[image:8.595.106.509.417.689.2]Anogeissus leiocarpus are well spread and are recorded across all the vegetation types. Others like Combretum molle and
Tectona grandis are present in great number only in some
vegetation. Table 5 shows the frequency of occurrence of the 10 most abundant tree species. These 10 listed species represent 50% of the total tree population recorded in the survey.
Analysis of diversity index per stratum
To analyze diversity of the tree stand, different indices and coefficients were used. Table 6 presents the results of this analysis. This table clearly shows that plant communities of the study area are diverse. The diversity in plant community varies from one stratum to another. In each stratum, the coefficient of variation is higher than 100%. The highest coefficient was recorded from open forest stratum whereas the smallest was recorded for the tree savannah stratum. On the other hand, the specific richness varies from 24 as recorded on open forest up to 52 recorded on tree savannah stratum. From this analysis, it can be stated that the higher the specific richness of a stratum, the lower the coefficient of variation. This also attests to the assumption that forest strata have less species than savannah strata type. Analysis of the plant diversity has revealed the degree of disturbance of the plant communities. From above, it was clearly demonstrated that human impact has a negative effect on the tree stand. Tree harvesting has the consequence to reduce the number of large and commercial species. Grazing results in reduction of not only grasses and epiphytes but also forage tree species. Agricultural practice reduces the woody land quantitatively and qualitatively. Human impact through tree harvesting, cutting, cropping etc, has been found at the centre of the change in land use/cover.
Modelling land use/cover change
Analysis of the transition probabilities indicates that forested areas are subject to high deforestation. Figure 4 highlights the pattern of deforestation through four plates extracted from different satellites images. As it was presented in Table 9, the rhythm of deforestation is not linear. To predict future values of these facts, Markov Chain Monte Carlo (MCMC) method, a simulation exercise was attempted. In order to understand the relationship between the selected variables, a correlation matrix was constructed. The result is presented in Table 10. The correlation between forest variables (FOR A) and non forest variables (NFAR) is negative (r = -1) and highly significant at 0.01 levels. Coefficients from regression simulations were used as input into the land use/cover ratio function to project scenario for the future land use/cover distribution in the study area. To get a thorough result, the land use/cover classes were merged in three categories: forested areas, built-up areas and farmlands. As it is observed, values of the land use/cover change occurring from 1986 to 1999 and the linear trend extrapolations for 2015 and 2025, are presented. The first two bars of the figure 5 show that from 1986 to 1999, farmlands and built-up areas have respectively increased by 18.4 % and 1.35% whereas the forested areas have decreases by 19.76% of the total of study area. The third and fourth bars show land use/cover shares in years 2015 and 2025 by trend extrapolation assuming that the past rates of changes continue until target years. This shows that farmland and built-up areas would increase greatly whereas the forested areas will continue to decrease.
Drivers of land use/cover changes
[image:9.595.106.492.54.380.2]This study has pointed that the main causes or proximate causes of the land use/cover change are human activities. Of
Figure 6. Land use/cover change process cycle
the underlying causes, the key factor, which probably has induced others, remains on demographic factor and more specifically on in-migration. In-migration into the study area has played an important role in the process of land use/cover change. It was observed in this study that some of these changes are negatively appreciated, because they lead to biophysical changes whereas others are positive such as new farming techniques introduced within the study area by the migrants. Because of migrants, there is still a food production surplus every year in the study area. The study also revealed that population (native and migrant) does not operate as a single force but is interlinked with other underlying forces such as: policy institutional, socio- political, economic, and technological factors. It was also observed that various underlying forces interact so that it is not easy to distinguish the effects from the causes. Finally, this study showed that land use/cover changes are result of a large number of interrelated processes and feedbacks, which are difficult to measure and quantify directly.
DISCUSSION
Land cover indicates the physical land type such as forest or open water whereas land use documents how people are using the land (Adeniyi and Omojola, 1999; Faye et al., 2016; Mertens and Lambin, 2000; Nelson, 2000). More concretely, Lambin, and Ehrlich (1997) stated that land cover data documents how much of a region is covered by forests, wetlands, impervious surfaces, agriculture, and other land and water types. Land use shows how people use the landscape – whether for development, conservation, or mixed uses. The different types of land cover can be managed or used quite differently. In definite, while land cover can be determined by analyzing satellite and aerial imagery, land use cannot be determined from satellite imagery. To see change over time, land cover maps for several different years are needed. Through information generated from maps, managers can evaluate past management decisions as well as gain insight into the possible effects of their current decisions before they are implemented. These keys principles were taken in account when designing the topic on land use/cover. The case study examined in this study, clearly demonstrated that land use/cover change is a complex phenomenon that requires an integrated study for its analysis. This complexity is due to the various factors or determinants of these changes, which interact so that it is not easy to distinguish them from the causes. One important finding of this study was that the methodology adopted has not only permitted to quantify the land use/cover changes, but also to focus and explain the interrelationships between the large numbers of land use/cover change drivers. This study has demonstrated some of the potentials of remote sensing and GIS technology to provide useful information on land cover, which helped to determine the magnitude, trends, rate, nature and location of these changes (Pare et al., 2008; Yeshaneh 2013). The study has also shown that to estimate the land cover change accurately, a combination of three sets of methodology was used. These include: (i) Post classification comparison method, (ii) Growing volume stock estimation, (iii) Socio-economic survey. Although this approach stems from the use of satellite data analysis, it permitted to tackle land use/cover change using growing stock volume estimation in addition to socio-economic data is an innovative approach. The results show the ability of using spatial demographic models to describe population change on a regional scale while at the same time
indicating the importance of including spatial factors, by comparing results from spatial and spatial models. The current research provides insights into why and how we should do it in order to measure population dynamics appropriately (Lambin
et al., 2014).
As observed in this study, the main causes or proximate causes of land use/cover change in the study area are human activities which Kaitmowitz and Angelen (1998) grouped in three categories as follows: Agriculture expansion, Wood extraction and Infrastructure expansion. Of these underlying forces, the key factor, which has induced others, is the demographic factor or more specifically in-migration. This study revealed that the numbers of migrants increased at an alarming rate annually. As a consequence of this, migrant population in some villages outnumbered native population. In this vein, another advantage of this study is that it permitted to develop a protocol that can investigate population dynamics in terms of population change, the natural environment, and land use and development with a spatiotemporal approach. However, this approach presents some weaknesses of which the most important are as follows: (i) Classification Accuracy: Although the overall classification accuracy estimated at 71.1% was good, this does not hide the difficulties arising from the satellite imageries analysis. These difficulties result from the use of multisource (Landsat and SPOT) and multi temporal satellite data that may differ in spectral quality. In addition, these satellite images were acquired in December, which is the starting period for bush fire. Due to the above statement, isolating the nine-land use/cover classes using imageries where there is prevalence of bush fire is not easy.
(ii) Modeling approach: One of the shortcomings of the Markov model used for this study is that the model is linear. According to Verburg (2000), this model involves no time delay longer than a single time step. Secondly, the amount of land transferred from one class to another during a time step is simply a portion of the area of each land use/cover class. However, vegetation dynamics are almost certainly non-linear and often involve time delays. The problem this situation raises is how to use a linear model to deal with a non-linear environment. Kramer (1996) explained that such a situation is possible since by essence, the transition represents a discrete change of state. However, to overcome Markov model limitation so far stated, time delays should be incorporated in Markov models by extending them to the second order (Nelson, 2000; Mertens and Lambin, 2000).
Although there are some methodological approach limitations so far stated, they however do not alter the consistency of the approach used. Overall, this approach is innovative because it has helped to enhance our understanding of land use/cover change processes. From the above, it can be concluded that the integrated methodological approach used in this study has helped to give an answer as shown if figure 6, to many questions related to land use/cover changes usually raised which has led to a clear understanding of issues such as: main causes of land use/cover changes; the drivers of changes; the consequences of the changes and the policies to be put in place. In total, all these methodologies stem from the use of satellite data analysis, the approach to tackle land use/cover change using growing stock volume estimation in addition to socio-economic data is an innovative approach.
Conclusion
analysis. This complexity is due to the various factors or determinants of these changes, which interact so that it is not easy to distinguish them from the causes. The methodology adopted has not only permitted to quantify the land use/cover changes, but also to focus on the interrelationships between the large numbers of land use/cover change drivers. To get a thorough understanding of the drivers’ interaction, a projection of land use/cover change was generated based on simulation models. Through this study, it was concluded that development of land use/cover change takes place at the expense of forested areas. From the above, it can be concluded that the integrated methodological approach used in this study has helped to give an answer to many questions related to land use/cover changes usually raised. It has led to a clear understanding of the causes of issues such as: (i) pattern, trends and magnitude of land use/cover changes; (ii) Processes of land use/cover changes; (iii) Human interventions and responses to land use/cover changes; (v) Driver interactions, etc.
REFERENCES
Adeniyi, P. O. and Omojola, 1999. A. Landuse/landcover evaluation in Sokoto-Rima basin of N.W. Nigeria based on archival remote sensing and GIS techniques. In: P. Adeniyi (ed.) Geoinformation Technology applications for resource
and Environmental management in Africa, pp: 143-172
Baltaxe, R. 1985. Guidelines for tropical forest cover monitoring based on remote sensing. FAO special study on forest management. Gcp/ras/106/JPN.Field doc.
Faye L. C., Sambou H., Kyereh B., Sambou B. 2016. Land Use and Land Cover Change in a Community-Managed Forest in South-Eastern Senegal under a formal Forest Management Regime. American Journal of Environmental Protection. Vol. 5, No. 1, pp. 1-10. doi: 10.11648/j.ajep. 20160501.11
Kazimowitz, D. and Angelsen A. 1998. Economic models of tropical Deforestation. A review. – Centre for International Forestry Research: Jakarta.
Kenkel, N.C., Juhasz-Nagy, P. and Podani, J. 1989. On sampling procedures in population and community ecology. : Vegetation N°83, 195-207.
Kent, M. and Coker, P. 1994. Vegetation description and analysis. A practical approach. John Wiley & Sons, England, 363pp.
Kramer, J. 1996. Integration of a GIS with a local scale self modifying urban growth model in South-eastern Orange County, New-York. M.A Thesis. Hunter College-CUNY. 87pp.
Lambin E. F, Meyfroidt P., Rueda X., Blackmane A. Börner J., Ceruttig P. O., Dietsch T., Jungmann L., Lamarque P., Listerj J., Walkerkl. Wunder N. F. 2014. Effectiveness and synergies of policy instruments for land use governance in tropical regions. Global Environmental Change. Volume 28, Pages 129-140 https://doi.org/10.1016/j.gloenvcha. 2014.06.007.
Lambin, E. 1997. Modelling and monitoring land-cover change processes in tropical regions. Progress in Physical
Geography, 21 (3): 375-393.
Lambin, E.F. and D. Ehrlich. 1997. Land-cover changes in sub-Saharan Africa (1982-1991): Application of a change index based on remotely sensed surface temperature and vegetation indices at a continental scale. Remote
Sens.Environ., 61, 181-200.
Mama, V.J. and Oloukoi, J. 2010. Modelling land use and land cover change in a central region of the Republic of Benin, using a Markov Model. Environtropica, Vols.5,6 & 7. Mertens, B. and Lambin, E.F. 2000. Land cover change
trajectories in Southern Cameroon. Annals of the
Association of American Geographers, Vol.90, N°3,
pp.467-494.
Nelson, G. C. 2000. Modelling deforestation and land use change; Sparse data Environments. IAAE Spatial Analysis learning Workshop. Berlin August. 14pp.
Pare, S., Soderberg, U., Sandewall, M. and Ouadba, J. M. 2008. Land use analysis from spatial and field data capture in southern Burkina Faso, West Africa. Agriculture,
Ecosystems & Environment, 127, 277–285.
Skole, D. and C. Tucker. 1993. Tropical Deforestation and Habitat Fragmentation in the Amazon: Satellite data from 1978 to 1988. Science, 260: pp 1905-1910.
Turner II, B.L. 1997. Socializing the pixel. LUCC Newsletter
1: pp 10-11.
Veldkamp, A., Fresco, L. O. 1997. Reconstructing land use drivers and their spatial scale dependence for Costa Rica 1973 and 1984. Agricultural Systems, N°55 pp 19-43. Verburg, P.H. 2000. Exploring the spatial and temporal
dynamics of land use. With special reference to China. PhD- thesis. Wageningen University and research Centre, Wageningen. 144 pp.
Yeshaneh, E., Wagner, W., Exner-Kittridge, M., Legesse, D., and Blöschl, G. 2013. Identifying Land Use/Cover Dynamics in the Koga Catchment, Ethiopia, from Multi-Scale Data, and Implications for Environmental Change.
International Journal of Geo-Information, 2, 302-323.
61044 International Journal of Current Research, Vol. 9, Issue, 11, pp.61034-61044, November, 2017