8th International Colloquium on Bluff Body Aerodynamics and Applications Northeastern University, Boston, Massachusetts, USA June 7 - 11, 2016
BBAA VIII
Wind tunnel studies of pressure distribution around a 5:1
rectangular cylinder
Dinh Tung Nguyen
a, John Owen
b, David Hargreaves
ca
University of Nottingham, Nottingham, United Kingdom, [email protected]
b
University of Nottingham, Nottingham, United Kingdom, [email protected]
c
University of Nottingham, Nottingham, United Kingdom, [email protected]
SUMMARY:
In this paper, a wind tunnel study is described focusing on analysing the pressure distribution and correlation around both static and dynamic 5:1 rectangular cylinders in smooth and turbulent flow. Results from the static tests highlighted the significant influences of the turbulence on the surface pressure distribution. For the dynamic section, the VIV was triggered by the motion-induced leading edge vortex; a strongly correlated flow feature close to the trailing edge was found to be responsible for an increase in the amplitude of the vortex-induced vibration. An increase in the turbulence effectively weakened the motion-induced leading edge vortex or removed the flow feature close to the trailing edge, which led to a large reduction in the VIV response.
Keywords: Bridge aeroelasticity, 5:1 ratio, Rectangular cylinder, Pressure distribution, Wind tunnel, Turbulence.
1. INTRODUCTION
The rectangular cylinder has been considered as a simplified geometry of many structures in the built environment and has been widely studied by researchers. In this study, the 5:1 rectangular cylinder is selected as a case study since it is considered as a basic bridge deck geometry and it is the main subject of the study “Benchmark on the Aerodynamics of a Rectangular 5:1 Cylinder” (Bruno et al., 2014). In contrast to the circular cylinder, the rectangular cylinder is characterised by permanent separation points at the leading edge causing two unstable shear layers which can interact with the after-body length or with each other in the wake, largely affecting their responses (Nakamura et al 1991).
For the rectangular cylinder with a long after-body length, the leading edge vortex is found to propagate downstream and its arrival at the trailing edge is phase-locked to the shedding of the trailing edge vortex (Mills et al 2003). However, this synchronisation is poor and intermittent in the case of the 5:1 rectangular cylinder, where the aforementioned shear layers reattach at points very close to the trailing edge. Wind tunnel experiments have found the Strouhal number in this case is not unique; it randomly switches between two values indicating that there are two different flow structures in the wake region (Ozono et al., 1992).
The rectangular cylinder has been found to be prone to the vortex-induced vibration (VIV) due to the motion-induced vortex shed from the leading edge or the von Karman vortex shed from the trailing edge (Matsumoto et al., 2008). However, for aspect ratio of 2.6 to 8 including the 5:1 rectangular cylinder, these mechanisms are indistinguishable. In addition, different harmonics of the VIV can be observed, which are associated with different numbers of vortices present along the surface of the body because of the long after-body length.
Further studies on the buffeting response of a bluff body have shown a significant effect of the turbulence on the pressure distribution and on the aeroelastic behaviour. Matsumoto et al. (1993) reported the turbulence-induced stabilisation effect on VIV of the rectangular cylinder. One deterministic effect of turbulence is to increase the vorticity diffusion and thus reduces the strength of vortices. However, the effect of turbulence on the induced vortex or motion-induced force is still very limited (Scanlan, 1997; Kareem and Wu, 2013). The stabilisation effect on the VIV could be due the turbulence-induced decrease in the pressure span-wise correlation as being observed in the static section. However, Wu and Kareem (2012) proposed an opposite and different mechanism, given that the turbulence does not affect the motion-induced vortex, the VIV response can be increased since turbulence weakens the von Karman vortex and its mitigation effects on the motion-induced vortex, leading to an increase in the VIV response as discussed by Matsumoto et al. (2008). Therefore, further studies are required to provide a more comprehensive explanation on the turbulence-induce effects on the motion-induced flow feature.
This paper presents a wind tunnel study of the aerodynamics of a 5:1 rectangular cylinder focusing on the analysis of the surface pressure distributions between static and dynamic models in smooth and turbulent flows. The result will help identify the mechanism of the turbulence-induced effect on the VIV of a rectangular cylinder and to validate the on-going CFD study.
2. METHODOLOGY
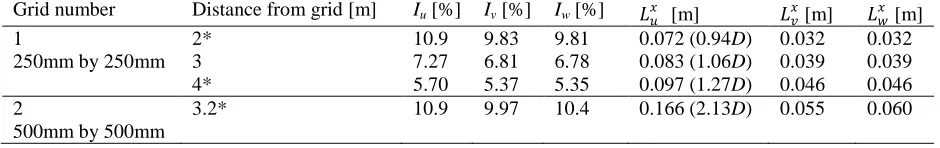
The Atmospheric Boundary Layer wind tunnel at the University of Nottingham features a 14.5 m long working section with a cross section of 1.8 m by 2.4 m .The main test section and 2 m, turntable are located at the end of an 11 m fetch. For aerodynamic tests such as the work described here, the low turbulence section immediately downwind of the contraction is used. With no additional turbulence generation, there is a uniform flow with a turbulence intensity of less than 0.2%. For this study, two different square lattice grids constructed from flat bars were used to generate homogeneous and isotropic turbulence. By using two different grids and adjusting the position of the model relative to the grid, a range of turbulence regimes could be considered, as summarised in Table 1, which shows the variation of turbulence intensity, Ii, and
[image:2.612.72.542.624.698.2]length scales, 𝐿𝑥𝑖, for i = u, v and w.
Table 1. Experimental turbulence parameters considered; * regimes used for the dynamic test.
Grid number Distance from grid [m] Iu[%] Iv[%] Iw[%] 𝐿𝑢𝑥 [m] 𝐿𝑣𝑥[m] 𝐿𝑤𝑥 [m]
1 2* 10.9 9.83 9.81 0.072 (0.94D) 0.032 0.032
250mm by 250mm 3 7.27 6.81 6.78 0.083 (1.06D) 0.039 0.039
4* 5.70 5.37 5.35 0.097 (1.27D) 0.046 0.046
2
500mm by 500mm
Figure 1. Arrangement of pressure taps.
Figure 2. Distribution of pressure taps at each array (units are in mm).
Table 2. Distancebetween the arrays of pressure taps and the centre line of the model.
Array A B C D E F G
Distance
[mm] 560 360 110 60 40 340 440
The 5:1 rectangular sectional model is 1.6 m long with a 0.308 m by 0.076 m section and was instrumented with 7 arrays pressure taps as shown in Figure 1 and Figure 2; the distance between the array and the centre line of the model is listed in Table 2. Pressure taps were connected to individual pressure sensors and logged at a rate of 500Hz. The total mass of the model is 38.5 kg.
2.1. Static Test Procedures
For the static test, the section was rigidly supported on load cells in a frame within the aerodynamic working section. The model was tested for 5 different wind speeds, 2, 4, 6, 8 and 10 ms-1 and for angles of attack from -8o to 8o in 2o increments. At each wind speed, the surface pressure was measured and force coefficients were calculated from the load cell data. Tests were performed in smooth flow and three levels of incident turbulence generated using Grid 1.
2.2. Dynamic Test Procedures
For the dynamic tests, the section was mounted on a set of 8 springs and restrained by light wires so that it could respond in one of three different modes: heaving only, pitching only and heaving and pitching. The natural frequencies of the heaving and damping ratio were fn,h = 4.68Hz and
fn,p = 5.70Hz respectively; the values of the Scruton number were Scr,h = 15.9 and Scr,p = 6.09
respectively. The wind speed was increased from 1 to 10 ms-1 with increments of 0.1 ms-1 during the lock-in region. At each wind speed, the response was recorded using accelerometers located at the four corner of the model and the surface pressure was measured. Tests were performed in smooth flow and three levels of the incident turbulence marked * in Table 1.
Position 1 (x/B = 0.04)
Position 2 (x/B = 0.22)
Position 3 (x/B = 0.78)
3. RESULTS AND DISCUSSION 3.1. Static Test Results
Force coefficients and Strouhal number calculated at the Reynolds number of 5×10⁴ in the smooth flow are summarised in Table 3. The width B of the model is used as the characteristic length scale for all coefficients. The results obtained from this wind tunnel study were compared against another wind tunnel studies together with the current Computational Fluid Dynamic (CFD) study (Nguyen et al., 2016) and a good agreement could be drawn. In addition, throughout the range of the Reynolds numbers selected in this study (Re = 1×10⁴ - 5×10⁴), no significant Reynolds-number effects on the Strouhal number were observed. The other wind tunnel studies in Table 3 predicted slight different values of the Strouhal number, which is probably due to the influence of the span/width ratio (L/B) of the model.
Table 3. Force coefficients and Strouhal number in the smooth flow; Re = 6×10⁴ (Schewe, 2013); Re = 2.7×10⁴ (Nguyen et al., 2016).
Current WT study Schewe, 2013 Matsumoto et al., 2003 Nguyen et al. (2016)
0o 6o 0o 6o 0o 0o
St 0.64 - 0.55 - 0.66 0.609
CL 0.034 0.508 0 0.5468 - -0.063
CD 0.238 0.367 0.208 0.3212 - 0.206
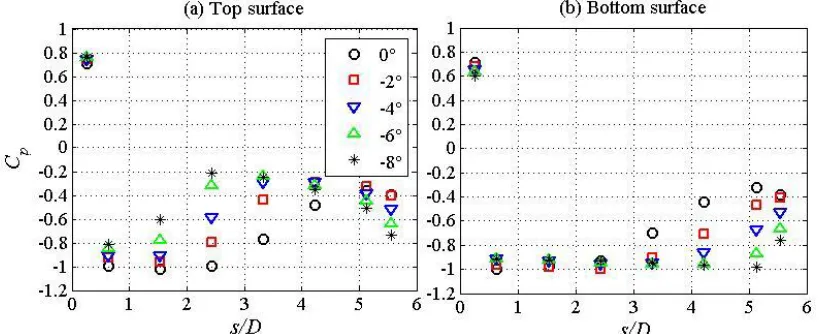
[image:4.612.78.531.262.323.2]The variation of the angle of attack was found to have significant effects on the geometry of the two separation bubbles on the side surfaces. As can be seen in Figure 3, the angle of attack has little effect on the pressure on the front and back faces. In this wind tunnel test, as the angle of attack increased, suppression of the separation bubble on the top surface was observed, indicated by an upstream shift of the reattachment point and a decrease in the suction peak. On the bottom surface, a different behaviour was found where the separation bubble was longer and eventually the section reached the stall position at an angle of attack of -6o, where the shear layer shed from the leading edge detached completely from the bottom surface.
[image:4.612.93.503.460.627.2]Figure 4. Distribution of 𝐶𝑝 and 𝐶𝑝′ around the static section as a function of normalised distance, s/D, in different flow condition (Re = 5×10⁴; 0o angle of attack).
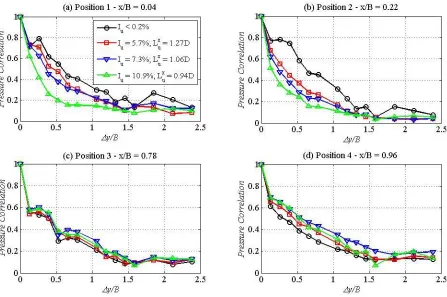
Figure 5. Effect of turbulence levels on the pressure correlation at 4 stream-wise positions (Re = 2.5×10⁴).
The separation bubble was also influenced by the turbulence as shown in Figure 4. Its effect was limited at the back face (s/D = 5.676). However, on the top and bottom surfaces, an increase in the turbulence level led to a stronger and shorter separation bubble accompanied by a quicker pressure recovery as illustrated by an upstream shift of the peaks of the 𝐶𝑝 and 𝐶𝑝′ distribution
[image:5.612.78.525.267.564.2]Figure 5) is significantly higher than that close to the trailing edge (Positions 3 and 4 in Figure 5); these positions are shown in Figure 2. This result could be inferred from the flow structure of the impinging leading edge vortex shedding where the shear layer created by the flow separation at the leading edge reattached intermittently at Position 3. In the turbulent flow, the pressure correlation is very low at Positions 1 and 2 indicating more frequent breaking-up of the separation bubble in the span-wise direction. There was little effect of turbulence at Position 3; however the turbulence enhanced the pressure correlation at Position 4. In fact, the pressure correlation measured at Positions 1 and 2 was lower than that at Position 4. It showed, typically for the 5:1 rectangular cylinder, that turbulence significantly alters the flow structure around the model and promotes the trailing edge vortex shedding instead of the impinging leading edge vortex shedding as found in the smooth flow.
3.2. Dynamic Test Results in the Smooth Flow
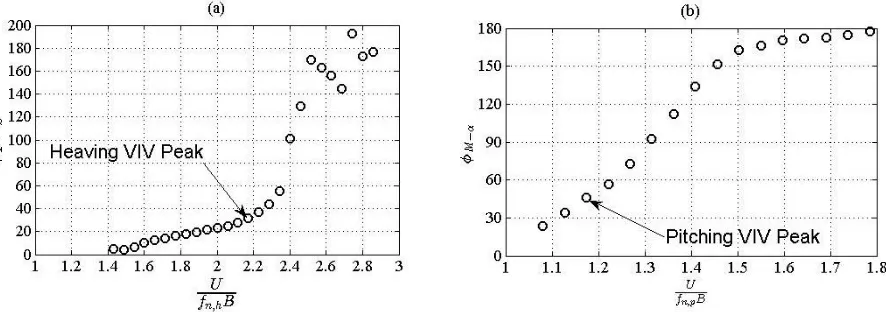
In this section, the behaviour of the model restrained to the heaving and pitching modes in the smooth flow is discussed; the pressure correlation results are also analysed to reveal the effect of the motion-induced leading edge vortex and the trailing edge vortex. Figure 6a and Figure 7a illustrate the behaviour of the model restrained to the heaving mode only in the smooth flow. Two VIV lock-in regions were observed at the reduced velocities of Ur = 0.77 and 1.54; the
former was smaller in magnitude. They were the two harmonics of the heaving VIV response. The phase angle of the lift force against the displacement (Figure 8a) possessed a dramatic change especially at the lock-out when the phase lag suddenly changed to about 180o. This transition implied a change in the flow structure during and after the lock-in.
Concentrating on the larger heaving VIV peak, the variation in the span-wise pressure correlation close to the leading edge (Positions 1 and 2) and close to the trailing edge (Positions 3 and 4) during the lock-in is illustrated in Figure 9. Before the lock-in occurred, the pressure correlation around the leading edge was higher than that of the trailing edge. The rise in the amplitude of the response increased the correlation of the surface pressure. However, during the lock-in, the correlation level around Position 3 was higher than those around the leading edge. It indicates the presence of a strongly correlated flow feature at Position 3 leading to the increase in response whereas the motion-induced leading edge vortex was only responsible for triggering the motion. This flow feature could be created by the motion-induced vortex shed from the leading edge. Due to the vertical motion of the model, the vortex slowed down around Position 3 causing a local rise in the suction before it was shed into the wake from the trailing edge. This flow feature was observed in the 3D heaving simulation in our on-going CFD study (Nguyen et al., 2016). It is noticed the presence of the step change in the pressure correlation at y/B = 1.5 in all dynamic tests, which could probably be due to the effect of the end plate and the motion of the model generating mixing vortex structures in the span-wise length.
When the model was restrained to the pitching mode only, two different behaviours were observed as showed in Figure 6b and Figure 7b. The torsional flutter occurred at higher wind speeds characterised by a dramatic increase in the angular displacement. In contrast to the heaving mode, only the second harmonic of the pitching VIV was found at the reduced wind speed Ur = 1.03. Analysing the phase angle of the pitching moment against the angular
lock-in (Figure 10) was very similar to when the model was restrained to the heaving mode only; the reduction of the pressure correlation at Position 3 led to a decrease in the amplitude. It further emphasises the different role of the motion-induced leading-edge vortex and its impingement and shedding at the trailing edge in the VIV response of the 5:1 rectangular cylinder in particular.
[image:7.612.87.536.321.491.2]Figure 6. Heaving motion (a) and pitching motion (b) of the model in the smooth flow.
Figure 7. Variation of the vortex shedding (VS) frequency and oscillation frequency in the heaving (a) and pitching (b) VIV response in the smooth flow.
[image:7.612.92.535.532.688.2]Figure 9. Pressure correlation measured at 4 stream-wise positions in smooth flow when the model underwent the heaving lock-in; black: position 1; red: position 2; blue: position 3; green: position 4.
Figure 10. Pressure correlation measured at 4 stream-wise positions in smooth flow when the model underwent the pitching lock-in; black: position 1; red: position 2; blue: position 3; green: position 4.
3.2. Dynamic Test Results in the Turbulent Flow
The effect of the different turbulence levels on the VIV of the model restrained to either the heaving mode or the pitching mode is showed in Figure 11; some differences between the heaving and pitching VIV response were observed. As for the heaving mode, no clear VIV responses could be seen. The increase in the turbulence intensity and length scale induced a larger overall buffeting heaving response. However, the effect of the turbulence intensity was limited at the reduce wind speeds above Ur = 3, which could be due additional influence of the
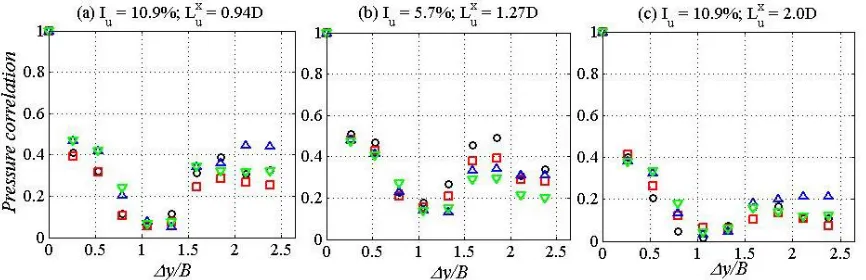
length scale. In Figure 12, a similar turbulence-induced effect on the pressure correlation as observed for the static sectional model can be seen, especially at the turbulence intensity of 10.9%. At the turbulence intensity of 5.7%, although Position 1 showed reasonably high correlation level, the impinging flow feature discussed in Section 3.2 did not occur at Position 3. Therefore, the turbulence effectively weakened the leading-edge vortex and promoted the trailing-edge vortex shedding leading suppression of the heaving VIV response.
When the model restrained to the pitching mode, the turbulence was found to completely damp the torsional flutter. The different turbulence level induced very little variation in the buffeting response. However, some pitching VIV response was observed at Ur = 1.01 when the turbulence
[image:8.612.82.528.263.406.2]model allowed the separation bubble to be formed around the leading edge triggering the VIV response. It is indicated by a higher correlation level around the leading edge (Figure 13b) in a comparison with other turbulence levels (Figure 13a and c). This difference in the span-wise pressure correlation was due to the additional effect on the shear layer caused by an increase in turbulence intensity.
Figure 11. The heaving (a) and pitching (b) response of the model in different turbulence levels.
Figure 12. Pressure correlation measured at 4 stream-wise positions (as showed in Figure 9) when the model was restrained to the heaving mode (Ur = 1.76).
[image:9.612.84.554.156.324.2] [image:9.612.99.509.368.507.2] [image:9.612.87.520.555.695.2]4. CONCLUSION
In this wind tunnel study, the effect of the turbulence on the flow field around and the VIV of a 5:1 rectangular cylinder have been investigated. In smooth flow, this cylinder was characterised by the impinging leading-edge vortex shedding where the shear layer created from the separation at the leading edge reattached to the surface at the point close to the trailing edge. It then separated again at the trailing edge in a synchronising manner with the shear layer at the leading edge. The turbulence was found to reduce the correlation level of the leading edge vortex, interfere with the aforementioned synchronisation and promote the trailing edge vortex shedding.
The 5:1 rectangular section was found to experience the VIV in the heaving and pitching modes. For this section, the VIV occurred due to two separate mechanisms. The motion-induced leading edge vortex was responsible as a triggering mechanism of the lock-in; the flow feature where the leading edge vortex impinged on the surface induced a raise in the local suction leading to an increase in the response. In this study, all selected turbulence levels were found to suppress the VIV by two possible manners which were either to weaken the motion-induced leading-edge vortex or to remove the impinging flow feature close to the trailing edge. As for the section restrained to the pitching mode, the angular motion enhanced the vortex shedding at the leading edge in the low turbulence flow, which allowed a low VIV response to be observed.
REFERENCES
Bruno, L., Salvetti, M.V. and Ricciardelli, F., 2014. Benchmark on the aerodynamics of a rectangular 5:1 cylinder: An overview after the first four years of activity. Journal of Wind Engineering and Industrial Aerodynamics, 126, 87 – 106.
Kareem, A. and Wu, T., 2013. Wind-induced effects on bluff bodies in turbulent flow: Nonstationary, non-Gaussian and nonlinear features. Journal of Wind Engineering and Industrial Aerodynamics, 122, 21 – 37.
Lee, B.E., 1975. The effects of turbulence on the surface pressure field of a square prism. Journal of Fluid Mechanics, 69(2), 263 – 282.
Matsumoto, M., Shiraishi, N., Shirato, H., Stoyanoff, S. and Yagi, T., 1993. Mechanism of, and turbulence effect on vortex-induced oscillations for bridge box girders. Journal of Wind Engineering and Industrial Aerodynamics, 49(1 – 3), 467 – 476.
Matsumoto, M., Shirato, H., Araki, K., Haramura, T. and Hashimoto, T., 2003. Spanwise coherence characteristics of surface pressure field on 2D bluff bodies. Journal of Wind Engineering and Industrial Aerodynamics, 91(1 – 2), 155 – 163.
Matsumoto, M., Yagi, T., Tamaki, H. and Tsubota, T., 2008. Vortex-induced vibration and its effect on torsional flutter in the case of B/D = 4 rectangular cylinder. Journal of Wind Engineering and Industrial Aerodynamics, 96(6 – 7), 971 – 983.
Mills, R., Sheridan, J. and Hourigan, K., 2003. Particle image velocimetry and visualization of natural and forced flow around rectangular. Journal of Fluid Mechanics, 478, 299 – 323.
Nakamura, Y., Ohya, Y. and Tsuruta, H, 1991. Experiments on vortex shedding from flat plates with square leading and trailing edge. Journal of Fluid Mechanics, 222, 437 – 447.
Nguyen, D.T., Hargreaves, D.M. and Owen, J.S., 2016. Computational studies of pressure distribution around a bending 5:1 rectangular cylinder. BBAA VIII International Colloquium on Bluff Body Aerodynamics and Applications, Boston, USA.
Ozono, S., Ohya, Y., Nakamura, Y. and Nakayama, R., 1992. Stepwise increase in the Strouhal number for flows around flat plates. International Journal for Numerical Methods in Fluid, 15(9), 1025 – 1036.
Scanlan, R.H., 1997. Amplitude and turbulence effects on bridge flutter derivatives. Journal of Structural Engineering, 123(2), 232 – 236.
Schewe, G., 2013. Reynolds-number-effect in flow around a rectangular cylinder with aspect ratio 1:5. Journal of Fluids and Structures, 36(0), 15 – 26.