Advance Image Classification System
N.N.Khalsa PRMIT&R Badnera
Amravati, India
Parag.P.Gudadhe VYWS Polytechnic Badnera
Amravati, India
Dr. V. T. Ingole PRMIT&R Badnera
Amravati, India
Abstract— Advance image classification system focuses on synthetic (e.g non-photographic) & Natural (e.g photographic) images. The classification of images based on semantic description is a challenging and important problem in automatic image identification. An algorithm for natural and synthetic image classification has been developed. Some features are extracted from the raw images data in order to exploit the difference of color pattern and spatial correlation of pixels in natural and synthetic images. These features have poor accuracy if used alone but when combined together forming a more complex and accurate global classifier, their precision can be boosted. Our image classification algorithm will use low-level image features such as Color map, edge map, energy level, Threshold ratio & nearest neighborhood classifier for classifying the image into synthetic and natural.
Key Words:-Synthetic image, Natural image, Color map, Edge map, Energy Level,Threshold value
I. INTRODUCTION
Images created entirely by digital means are growing in importance. Such synthetic images are an important means for recording and presenting visual information. The accurate classification of these images – such as icons, maps, figures and charts is increasingly important. With the advent of the web, images are being used not just to communicate content but also for decoration, formatting and alignment. An image classification system can improve image search and retrieval engines and can act an input filter for downstream web processing as well as image understanding systems. On the other hand, very often a Natural image depicts real life objects and subjects. These have usually textures, smooth angles, larger variety of colors but less saturated[1] & [2].
For an human being, distinguishing between a photograph and a graphic is almost always an easy task. It is often just matter of a glance. Unfortunately it is not for a computer, there is not a simple and easy feature to just extract and process. Number of color, edge map & edge location energy level, & threshold ratio is derived from the raw data available from the picture in different ways. Those features must be then combined together in order to build a solid classifier. since if used individually, they can lead to poor or even wrong results The purpose of an image classification system is to separate images into different classes. An ideal system should be able to discern different images with no hesitation just like an human being. Unfortunately, sometimes the classification task is hard and ambiguous even for an human[3]. This makes the problem even more challenging. In this project, a binary
classifier will be developed. The two classes involved in the classification shall be Natural and Synthetic images. Given an image, the classifier will extract and analyze some of the most relevant features and combine them in order to generate advance image classification system.
II. IMAGE DATASET
The choice for creating the database was JPEG images. This chose was made because of a main assumption, since images can be compressed in a different way, the classification algorithm has to be tuned accordingly to each format, multiple factors have to been taken into account such as the reduced/altered palette and the noise added while resizing/compressing. Hence a mixed dataset can not be used with a single classification method. GIF and PNG formats are very popular formats for synthetic images but less used for encoding photographs. For transmissions of true color images over the internet, especially photographic ones, JPEG is almost always a better choice. Most of the image are down loaded from web site & some are directly capture from digital camera [4]& [5]. The image is resized into 256*256, balance dataset was created taking 500 synthetic & 500 natural image. Images are hand-labeled as natural and synthetic image The main step in order to be able to classify an image is to extract numerical features from the raw data. These common features will be then combined in different ways according to the classification methods.
III. IMAGE FEATURES &THEIR EFFECTS
The features used in classification system are color map, edge map, energy level, threshold. & Nearest neaighourhood classifier. The main step in order to be able to classify an image is to extract numerical features from the raw data, If this features are combine to gather, exhibit promising performance and accuracy level is increased. In the following section of paper I will describe & analyzed the effect of single feature in classifying the images as natural & synthetic.
IV. EFFECTS OF FEATURES
photograph, some noise is added to the subject and that causes neighbor pixels to have different RGB values (even when they are supposed to have the same color). It is possible to exploit these simple features related to colors by extracting and analyzing the features. Photographs often have more color than graphics. This is because synthetic images tend to have large uniform regions with the same color. On the Web in particular, graphics with few color are more popular because they compress better. The number of different colors of an image is extracted but it cannot be directly used as metric since the raw number is also dependent from the size of the image. Therefore a more accurate metric is used: the rate between the number of different colors and the number of total pixels[7] & [8]. Color map of input image is plot for black & white image histogram(gray) of image is calculated for color image extended histogram is used .The fig 1.1a & 1.1b show the color map Natural image & synthetic image
Fig 1.1a
Fig 1.1b
For edge map edges of image is taken and from edge location edge map is created. The fig 1.2a & 1.2b show the edge map of Natural image & synthetic image.
Fig 1.2b
color map & edge map is taken to achieve the high level of accuracy. Analysis of color map & edge map of 300 image is done separately for natural & synthetic image. If the value of color map is in the range 0 to 30 image is classify as synthetic & as the value extend this rang image is classify as natural image. Edge map show small different in value for natural & synthetic image. The spike found in natural image is higher then the synthetic image. By combining this two feature the performance of classification system is boosted & 87% of accuracy is achieved.
Energy Level
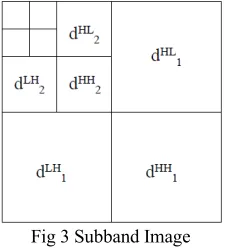
The evaluation of energy level start form converting the image into gray scale. For texture analysis rangfilt function is used which returns the array of image, where each output pixel contains the range value (maximum value − minimum value) of the 3-by-3 neighborhood around the corresponding pixel in the input image . The image can have any dimension. The output image is the same size as the input image . First the total energy is calculated using DWT. Then the precision of image is double to calculate Single-level discrete 2-D wavelet transform. Which performs a single-level 2-D wavelet decomposition with respect to particular wavelet .DWT2 computes the approximation coefficients matrix and details coefficients matrices ( horizontal, vertical ,diagonal) obtained by a wavelet decomposition of the input matrix of image. In this work only one set of DWT derived features is considered. It is a vector, which contains energies of wavelet coefficients calculated in subbands at successive scales[14]& [15]. To compute the wavelet features Harr wavelet is calculated for whole Image it transfer the image into 4 subband image at its scale.
Fig 3 Subband Image
The natural images that are directly capture from digital camera chosen for analysis, energy level found for natural image are e1=54.36, e2=108.71,
& e3 = 217.43. As synthetic image belonging to one of the following categories: Logos, Maps, Chart, Drawing, & Windows Application Screen shoot. The energy belong to each categories is shown below in table.
Table: Energy level
From above analysis if energy level is higher the image is classified as natural other wise image is classified as synthetic image.
Threshold
Threshold of the image is calculated using the OTSU method.
The intensity of a gray level image be expressed in L gray level [ 1, 2, ……..L]. The number of point with gray level at I is denoted by and the entire number of point can be expressed as The histogram of this gray level image is regarded as a occurrence distribution of probability.
The image pixel are divided into two parts and i.e
Foreground and background by a threshold t. Where Represent pixels with levels [ t + 1, …….L ]. The
occurrence probabilities of this class and average can be expressed as
Total mean can be writeen as
We can find that
Where and denote probabilities of foreground parts and background parts. Beside and refer to the mean in gray level of the foreground of the gray image, the background of gray image. And the entire gray level image.
The between-class variance of the two classes & variance is given by [16]
The separate degree of the class , in discrimination analysis is
Finally, maximizing to chose the optimal threshold t.
Props function is used if the distribution of class (K = o, or 1 ) is skew or heavy-tailed. It is well known that the mean value is very robust estimate value compared with average gray level. We find that the mid value replace of the average may obtained optimal threshold that is very accurate to the presence of heavy-tailed distribution for compare with this threshold chosen by OTSU method [16]
So we can replace the total mean with the total medium level of all the point in the entire gray level image Similarly to the whole image mean value . the mean value
& can be replace by medium gray level. and for foreground part and the background part respectively.
The between-class variance of the two classes & Can be rewritten as.
And the threshold is chosen by maximizing
Threshold calculated by OTSU method shown the good performance in classification of image. Threshold of 400 natural image 500 synthetic image was calculated. If the value is between 0.0001 to 0.0002 image is classified as synthetic image & if the value is between 0.0005 to 0.0006 the image is classified as natural image. This feature shown the error rate of 37%.
V.CLASSIFICATION SYSTEM
Every feature used in this paper has different accuracy level The color map of image shown the accuracy rate of 87percent for synthetic and 88% percent for natural image Edge map shown the low level of accuracy then color map. Combine result of color map & edge is also calculated which result the accuracy of 87% for natural & synthetic image. The three energy level are calculated from image and combine together to evaluate the class of image which shown the 75% accuracy for natural & 80% for synthetic image. The optimal threshold is calculate using OTSU method give the error rate of 37 percent. To increase the accuracy by 1 or 2 percent become very difficult by using single feature. Therefore algorithm is design to increase the accuracy in classification system. Which combine all the feature extracted from images & combine together to produce optimum result. The activity diagram & flow diagram of design algorithm is given
Energy Logo Maps Drawing Win App Screen Shot
E1 10.33 22.11 23.26 22.89
E2 20.65 44.22 45.14 45.78
KNN Classifier
The k-Nearest Neighbors algorithm (or k-NN for short)
is a non-parametric method used for classification and regression. In both cases, the input consists of the k closest training examples in the feature space. The output depends on whether k-NN is used for classification or regression:
In k-NN classification, the output is a class membership. An object is classified by a majority vote of its neighbors, with the object being assigned to the class most common among its k nearest neighbors (k is a positive integer, typically small). If k = 1, then the object is simply assigned to the class of that single nearest neighbor.
In k-NN regression, the output is the property value for the object. This value is the average of the values of its k nearest neighbors.
K-NN is a type of instance-based learning, or lazy learning, where the function is only approximated locally and all computation is deferred until classification. Using K-NN Classifier the time required to evaluate the image is also reduce.
Firg.4 Flow Diagram
Step
Creation of Database 1. Loading the data base 2. Pick a image file 3. Image Reading
4. Resized the image size to 256*256 5. Covert image rgb2gray
6. Evaluating edge map, Extended histogram, Energy level , & threshold.
7. Combine the feature 8. Lode it into the database Testing Image
1. Pick a image file 2. Image Reading
3. Resized the image size to 256*256 4. Covert image rgb2gray
5. Evaluating edge map, Extended histogram, Energy level , & threshold.
6. Combine the feature 7. Compare it with database
8. Check which is the best match using KNN classifier
9. Show out put class ‘’ natural or synthetic”
VI. Conclusion
The color map of image shows the accuracy rate of 87percent for synthetic and 88% percent for natural image Edge map shows the low level of accuracy then color map. Combined results of color map & edge map is also calculated which results in the accuracy of 87% for natural & synthetic image. The three energy levels are calculated from image and combined together to evaluate the class of image which shows 75% accuracy for natural & 80% for synthetic image. The optimal threshold is calculated using OTSU method gives the error rate of 37 percent. If this feature is used individually the overall average accuracy is 78%. The algorithm with all the features taken together & finding the best match using K-NN Classifier has increased the accuracy to 90% and the computational time is reduced to a significant amount.
REFERENCES
[1] Chunxiao Zhang; Yongmei Hu; and et al; “The application of
Wavelet in Face Image Pre-processing” 4th International Conference on Bioinformatics and Biomedical Engineering (iCBBE), 2010; 978-1-4244-4713-8/102010 IEEE, sponsored by the National Science Foundation of Shandong Provience.2010
[2] N. N. Khalsa, Dr. V. T. Ingole, Optimal Image Compression
Technique based on Wavelet Transforms, INTERNATIONAL JOURNAL OF ADVANCED RESEARCH IN ENGINEERING & TECHNOLOGY (IJARET), (ISSN: 0976-6499 online), Volume 5, Issue 3, March-2014
[3] Nikkoo N. Khalsa, Dr. Vijay T. Ingole , “Novel method for
classification of Artificial and Natural images, INTERNATIONAL JOURNAL OF SCIENTIFIC & ENGINEERING RESEARCH, FRANCE (ISSN 2229-5518), Volume 5, Issue 3, March-2014
[4] Nikkoo Khalsa et. al. /Factors influencing the image compression
of artificial and Natural image using wavelet transform International Journal of Engineering Science and Technology Vol. 2(11), 2010, 6225-6233
[5] B.S. Shajeemohan ; Dr.V.K.Govindan ; Baby Vijilin; “ A scheme
for Classification and Adaptive Mother Wavelet Selection” IEEE International Conference on Advanced Computing and Communications, 2006. ADCOM 2006.1-4244-0716-8/ 2006.
[6] Marc Antonini, Michel Barlaud, Pierre Mathieu and Ingrid
Daubechies, “Image Coding Using Wavelet Transform” IEEE Transactions on Image Processing, Vol.1, No.02, 1992
[7] M. K. Bashar, “Exploring Duplicated Regions in Natural Images”,
[8] Sonja Grgic, Mislav Grgic; “ Performance Analysis of Image Compression Using Wavelets” IEEE Transactions on Industrial Electronics, Vol. 48, No. 03, June 2001
[9] Vinay U Kale, Nikkoo N Khalsa, “ An Evaluation of still image
compression using Wavelet transform”, National Conference on Application of Real Time systems (NAC- ARTS), DSCE, Bangalore, 2nd – 3rd Nov. 2009.
[10] Jean-Luc Starck, Michael Elad, and David L. Donoho; “ Image
Decomposition via the Combination of Sparse Representations and a Variational Approach” IEEE TRANSACTIONS ON IMAGE PROCESSING, VOL. 14, NO. 10, OCTOBER 2005
[11] Stephane G. Mallat; “A Theory for Multiresolution signal
decomposition: the wavelet representation” IEEE Transactions on Pattern analysis and Machine Intelligence , Vol. 11, No. 7, July 1989.
[12] Christoph Ueffing; “ Wavelet based ECW Image compression”,
Photogrammetric Week 01, Wichmann Verlag, Heidelberg, 2001
[13] Sara Brooks and Mohammad Tabbara; “ Wavelet Image
compression: a heuristic approach to space frequency quantization”, Austalian Jouranal, 2007
[14] Chopra, S. Kaur, H. Kaur, A; “Selection of best wavelet basis for
image compression at decomposition level 5”: IEEE 2nd
International Conference on Computer Technology and Development (ICCTD), 2010.
[15] V. Athitsos, M.J. Swain, and C. Frankel. Distinguishing
photographs and graphics on the world wide web. Proceedings of the IEEE Workshop on Content-Based Access of Image and Video Libraries, pages 10–17, 1997.
[16] B. Bradshaw. Semantic based image retrieval: a probabilistic