Investigating the structural compaction of biomolecules
upon transition to the gas-phase using ESI-TWIMS-MS
Paul W. A. Devine
1, Hen y C. Fishe
r
r
1, Antonio N. Calab ese
r
1, Fiona Whelan
2, Daniel R. Higazi
3,
r
Jennife R. Potts
2, Davi C. Lowe
d
4, Sheena E. Ra fo *
d rd
1, Alison E. Ashc oft*
r
11Astbu y Cent e fo St uctu al Biology, School of olecula an Cellula Biology, Unive sity of Lee s,r r r r r M r d r r d d
Lee s, LS2 9JT, UK
2Depa tment of Biology, Unive sity of Yo k, Yo k, YO10 5DD, UKr r r r
3Ipsen Lt . UK, W exham In ust ial Estate, 9 Ash Roa No th, W exham, LL13 9UF, UK d r d r d r r
4M de Immune, Si Aa on Klug Buil ing,r r d G anta Science Pa k, r r Camb i ge, CB21 6GH, UKr d
Abstract
Collision cross-section (CCS) measurements obtained from ion mobility spectrometry-mass
spectrometry (IMS-MS) analyses often provide useful information concerning a protein’s size
and shape and can be complemented by modelling procedures. However, there have been
some concerns about the extent to which certain proteins maintain a native-like conformation
during the gas-phase analysis, especially proteins with dynamic or extended regions. Here
we have measured the CCSs of a range of biomolecules including non-globular proteins and
RNAs of different sequence, size and stability. Using travelling wave IMS-MS, we show that
for the proteins studied the measured CCS deviates significantly from predicted CCS values
based upon currently available structures. The results presented indicate that these proteins
collapse to different extents varying on their elongated structures upon transition into the
gas-phase. Comparing two RNAs of similar mass but different solution structures, we show
that these biomolecules may also be susceptible to gas-phase compaction. Together the
results suggest that caution is needed when predicting structural models based on CCS data
Introduction
The advent of electrospray ionisation (ESI) transformed the field of mass spectrometry (MS)
by providing the ability to routinely analyse not only large proteins but also non-covalently
bound biomolecular complexes. In the three decades since this development, there has
been a significant body of literature providing evidence of the native-like state of
biomolecules measured by both ESI-MS and, more recently, ESI-ion mobility
spectrometry-MS (ESI-Ispectrometry-MS-spectrometry-MS) [1-3].
Ion mobility spectrometry (IMS) is a separation technique based on the gas-phase mobility of
ions as they travel, under the influence of a weak electric current, through a drift tube filled
with an inert gas [4-6]
. Ions are separated based on their charge and shape: briefly, compact ions travel faster
than extended ions carrying the same number of charges, whilst ions with a high number of
charges travel faster than ions carrying a lower number of charges derived from the same
precursor molecules. When coupled with MS, the data output is a 3D array of m/z vs
intensity vs IMS drift time. The IMS drift time for ions can be converted to collision
cross-section (CCS) directly if the IMS drift tube is a linear one [6-8], or indirectly following a
calibration procedure [9-12] if the drift tube is of a travelling wave (TW) [13] design. The CCS
of an ion corresponds to the averaged rotational 2D projection of the biomolecule’s 3D
structure. Hence, ESI-IMS-MS is a unique and powerful tool that can separate and
characterise biomolecules, providing both mass and shape (via CCS) information on
individual species within an ensemble in a single, rapid, experiment. Indeed, ESI-IMS-MS
has been employed to study the 3D architecture and conformational properties of many
In 1997, Joseph Loo stated there are three camps of opinion concerning the retention of
native protein structure upon transition into the gas-phase: “believers, nonbelievers and
undecided” [2], and quite possibly he was correct to hint at caution because, despite the high
number of successes reported, there has been a slow, low level emergence of literature
demonstrating the “collapse” of certain proteins upon transition into the gas-phase [23-25],
one key example being antibodies [26-28]. Here, by systematic analysis of different
non-globular proteins and RNA molecules using ESI-TWIMS-MS, we provide evidence of
compaction in the gas-phase, highlighting a potential caveat in studying these specific
biomolecules using this technique. The degree of compaction has been revealed by
comparing the CCS values estimated from the ESI-IMS-MS data with CCS values calculated
from the PDB structures of these biomolecules and also, in the case of the proteins, with in
vacuo Molecular Dynamics (MD) simulations.
Methods
Biomolecules
The monoclonal antibody, mAb1, was supplied by Medimmune (Cambridge, UK); (I27)5 was
expressed recombinantly as described elsewhere [29] with amino acid linkers in between
each sub-unit (See Supporting Information Table S1); POTRAs were cloned and expressed
recombinantly as described elsewhere [30]; a SasG construct (G51-G57-Strep-CysCys) was
produced as described previously [31]. The RNA molecules were purchased from Integrated
DNA Technologies BVBA, Leuven, Belgium.
Protein mass spectrometry analyses
All nanoESI-TWIMS-MS protein measurements were carried out using a Synapt HDMS
mass spectrometer (Waters Corp., Wilmslow, UK). Samples were introduced to the mass
Novato, CA, USA) coated with palladium using a sputter coater (Polaron SC7620, Quorum
Technologies Ltd, Kent, UK). All protein samples were analysed in positive ESI mode. The
m/z scale was calibrated using 10 mg/mL aqueous caesium iodide (CsI) clusters across the
acquisition range (typically m/z 500-15,000).
Protein samples were dialysed into 150 mM aqueous ammonium acetate before being
infused into the Synapt G1 instrument. nESI-MS and nESI-TWIMS-MS experiments were
conducted under the following settings: capillary voltage, 1.5 kV; sample cone, 30 V;
extraction cone, 4 V; source temperature, 60-80 ⁰C; backing pressure, 3.0-5.0 mBar; trap
voltage, 10-40 V; trap/transfer gas flow, 1.5 mL/min; IMS nitrogen gas flow, 20 mL/min, IMS
wave height (ramped), 5-30 V and travelling wave speed, 300 ms.
All data were processed and analysed with the MassLynx v4.1 and Driftscope software,
supplied with the mass spectrometer.
ESI-TWIMS-MS Collision Cross-Section (CCS) calibrations for proteins
ESI-TWIMS-MS experiments were carried out on a Synapt HDMS mass spectrometer using
travelling wave IMS. Calibration of the travelling wave drift cell was carried out using a
previously published method [11]. The calibrant proteins used were: beta-lactoglobulin,
concanavalin A, alcohol dehydrogenase, and pyruvate kinase, taken from the Clemmer/Bush
database [12]. Calibrant proteins were dissolved at a concentration of 10 µM in 200 mM
ammonium acetate before being analysed under the same conditions as the protein
analytes.
Calibrant proteins were corrected for mass-dependant flight time using Equation 1 [11]:
t'D=tD−
[
CEDC
√
mz
1000
]
Where t’D is the corrected drift time, tD the measured drift time of the analyte, m/z the
mass-to-charge ratio of the ion, and CEDC the enhanced duty cycle (EDC) delay coefficient of the
instrument (in this case 1.57). The corrected drift times were plotted against the reduced
cross-sections (Ω’) as outlined in [11], and the plot fitted to a linear relationship (Equation 2):
Ω'=X ×lnt 'D+lnA
Equation 2
where A is a fit determined constant and X the exponential factor.
The calibrations were converted to linear plots to allow for straightforward extrapolation for
measurements of unknown proteins and complexes. For this, a new corrected drift time was
calculated using Equation 3:
t ' '
D=
t '
D X× z×
(
1
μ
)
1/2
Equation 3
where µ is the reduced mass of the ion.
The new corrected drift time (t’’D) was then plotted against the cross-section of the calibrant
proteins (taken from the database [12]) to generate the calibration plots (see Supporting
Information: Figures S1, S2, and S3).
RNA mass spectrometry analyses
All nanoESI-TWIMS-MS RNA measurements were carried out using a Synapt G2-S mass
spectrometer (Waters Corp., Wilmslow, UK). Samples were introduced to the mass
spectrometer using in-house pulled borosilicate capillaries (Sutter Instrument Company,
Novato, CA, USA) coated with palladium using a sputter coater (Polaron SC7620, Quorum
Technologies Ltd, Kent, UK). All RNA samples were analysed in negative ESI mode. The m/
z scale was calibrated using 10 mg/mL aqueous caesium iodide (CsI) clusters across the
On receipt, the two 35-nucleotide RNAs (PDB structures 2PCV and 2DRB) were diluted to
200 µM in RNAse-free MilliQ water, separated into 100 µL aliquots and stored at -80 oC.
When ready for analysis, these samples were diluted with 50 mM ammonium acetate to a
concentration of 40 µM, desalted using spin columns (BioRad, Hemel Hempstead, UK) and
then diluted to 8 µM with 50 mM ammonium acetate. nESI-TWIMS-MS experiments were
conducted under the following settings: capillary voltage, -0.8 kV; sample cone, 30 V; source
temperature, 60-80 ⁰C; IMS sheath gas, He 2.42e-2 bar; IMS buffer gas, Ar 3.01 bar; IMS
wave height 40 V; IMS wave velocity 400-750 m/s per scan.
ESI-TWIMS-MS Collision Cross-Section (CCS) calibration for RNAs
ESI-TWIMS-MS experiments for the RNAs were carried out on a Synapt G2-S mass
spectrometer using travelling wave ion mobility separation with negative ionisation
electrospray. Calibration of the travelling wave drift cell was carried out using the method
described previously in this document for protein samples but with an enhanced duty cycle
delay coefficient (CEDC) of 1.41. The calibrant was a DNA polythymine of ten nucleotides
(d[T]10) whose CCS had been measured and reported by Clemmer [32] (see Supporting
Information: Figure S4).
Theoretical CCS calculation
MOBCAL software was used to calculate the theoretical CCSs for the samples studied and
was implemented using a Linux operating system. The MOBCAL Projection Approximation
value [33] was used to generate the Projection Superposition Approximation (PSA) as
outlined in [34]. Equation 4 was used for this:
PSA=
(
PA−81)
x1.299In vacuo Molecular Dynamics (MD) simulations
MD simulations were run using the NAMD software (NAMD 2.9), using the CHARMM force
field [35]. Structures were simulated in a solvent free system. For the simulation, a constant
temperature of 300 K with Langevin thermostat was used and a time-step of 2.0 fs with a
radial cut-off distance of 12 Å used throughout. Energy minimization in vacuo was
implemented for a total of 0.5 ns before an equilibration of 10 ns, the cut-off distance, force
field and time step remained as described above throughout the simulation. Visual Molecular
Dynamics (VMD) [36] was then used to visualise the simulation and individual frames were
saved as PDB coordinates in order to compute the CCS using MOBCAL. The VMD software
was also used to calculate the root mean square deviation (RMSD) and radius of gyration
(Rg). Analysis of the root-mean-square deviation (RMSD) revealed whether a protein had
equilibrated by the end of the 10 ns simulation; any sample that had not finished equilibrating
was re-submitted for a further 10 ns until equilibration was reached. The NAMD and VMD
software was operated under a Linux operating system.
Results and Discussion
Insights into the gas-phase collapse of monoclonal antibodies
Using ESI-TWIMS-MS under non-denaturing conditions to characterise an IgG1 monoclonal
antibody, mAb1, we observed that, despite presenting a narrow ESI charge state distribution
(+21 to +25 ions) usually indicative of a “native-like” protein, the experimentally estimated
CCS value of the lowest charge state (68.2 nm2) was significantly lower (32.4 %) than the
computationally determined CCS (101 nm2) based on the published structure (PDB = 1IGY
[37]) (Figures 1a i, ii, iii). Similar behaviour of monoclonal antibodies (mAbs) has been
reported by others [27, 28], and Pacholarz et al. carried out in vacuo MD simulations to
interrogate the observed compaction of IgG molecules in the gas-phase, demonstrating that
the protein likely collapsed around the hinge region in between the fragment antigen-binding
Molecular modelling is a useful tool to aid the study of biomolecules in the gas-phase.
Although CCSs measured using ESI-TWIMS-MS methods can be compared directly to
solved X-ray crystal or NMR structures from the Protein Data Bank (PDB), it is becoming
clearer that this is not suitable for all proteins. For example, the conditions used to crystallise
proteins can be very different to the conditions used for mass spectrometric analysis.
Further, some proteins are inherently flexible or disordered, and may not have a PDB
structure with which to compare the measured CCS, and additionally a subset of structures
in the PDB consist only of fragments of the full protein in question. In vacuo modelling,
therefore, allows us to achieve a glimpse of how such proteins may behave within the
gas-phase. Adopting a similar in vacuo MD simulation approach as used by [28], we also
observe a collapse around the hinge region of mAb1 such that the measured CCS of the
mAb is substantially less than both the predicted CCS from its crystal structure [37] and the
in vacuo MD simulation (Figure 1a iii).
To understand the role of the hinge region and determine whether this flexible linker was the
main attributor to the collapse observed, we released the Fab and Fc regions of mAb1 using
Lys-C proteolysis and analysed the two fragments independently (Figures 1b, 1c). The CCS
values determined by ESI-TWIMS-MS, estimated from the PDB co-ordinates, and indicated
by in vacuo MD simulations are compared for both the Fab and the Fc regions (Figures 1b
and 1c, respectively). The MD simulations indicated that both proteins collapsed to some
extent in vacuo compared with their crystal structures, with the Fab region collapsing 11 %
compared with the 17 % collapse of the Fc region. Furthermore, the CCS of the Fab region
measured by ESI-TWIMS-MS was closer in agreement to the CCS predicted from its PDB
structure than with its equilibrated collapsed MD structure, while the CCS of the Fc region
measured by ESI-TWIMS-MS was closer to that of its collapsed MD structure than with its
retains the majority of the hinge region, supporting the notion that the flexible hinge plays a
Figure 1: Monoclonal antibodies collapse around the flexible hinge region in the gas-phase.
(a) ESI-TWIMS-MS (i) Driftscope plot of m/z vs TWIMS drift time vs intensity and (ii) mass
spectrum for mAb1 with (iii) the TWIMS CCSs for each charge state compared with the CCS
calculated from the protein’s PDB co-ordinates and the CCS estimated from the end-point of
the in vacuo MD simulation. The ESI-TWIMS-MS CCS data for (b) the Fab and (c) the Fc
regions of mAb1 isolated by lys-C digestion: the calculated CCS values from the PDB
co-ordinates and those after in vacuo MD equilibration are reported for both proteins (dotted
lines). Insets show the PDB structures (transparent surface) alongside the in vacuo MD
equilibrated structures (solid wire frame).
Investigating the gas-phase collapse of other non-globular proteins
To investigate the generality of the role of flexible hinge regions in gas-phase protein
collapse, using ESI-TWIMS-MS we analysed an I27 concatamer, (I27)5 [29] (Figure 2a) and
the POTRA domains from BamA [38] (Figure 2b). (I27)5 is a mechanically robust pentamer,
whose folded Ig subunits are connected by flexible linkers of 4-6 amino acids. This construct
is used widely for AFM and mechanical stability studies [29, 39]. Furthermore, poly-Ig
domains as well as I27 polyproteins have been shown to be flexible in solution and can
adopt various conformations as revealed by electron microscopy [40, 39, 41]. The POTRA
domains were chosen as, similar to (I27)5, the protein consists of five subunits (POTRAS
1-5) connected by short linker regions [42, 43].
The mass spectrum of (I27)5 indicated a narrow charge state distribution (13+ to 16+ ions)
(Figure 2a i). As neither a crystal nor NMR structure was available for (I27)5, a model was
built based on the solution structure of the I27 monomer (1TIT, [44]) and building in the 4-6
residue linker regions (see Supporting Information) (Figure 2a i). This enabled a theoretical
CCS for the five-domain construct to be established and formed the starting point for the in
vacuo MD simulations (see Supporting Information). The measured CCS for (I27)5 (39.8
and the MD simulation end point (49.4 nm2) (Figure 2a ii). Upon in vacuo minimisation and
equilibration, the protein undergoes compaction then collapses around the flexible linker
regions between the individual subunits, which is reflected by the CCS at the end of the
simulation.
ESI-TWIMS-MS analysis of the combined POTRA domains from BamA again produced a
mass spectrum with a narrow charge state distribution (12+ to 16+ ions) (Figure 2b i). The
ESI-TWIMS-MS data indicate that the CCS (35.1 nm2) obtained for the lowest charge state
ions (+12) is closer to the predicted CCS of the in vacuo-equilibrated structure (37.1 nm2)
than the CCS value predicted from the crystal structure (5D0O; 45.3nm2) (Figure 2b ii). The
MD collapse observed for the POTRA domains is attributable to compaction around the
short hinge regions between the individual domains, as well as to an overall collapse with
POTRA1 moving towards POTRA5, resulting in a more ring-like structure in the equilibrated
molecule (Figure 2b iii).
Together, the data presented for mAb1, (I27)5 and the POTRA domains suggest that
non-globular proteins with flexible linker or hinge regions are susceptible to gas-phase collapse.
To determine how linear, elongated molecules without any distinct linker regions behave
upon transition to the gas-phase, we studied the protein SasG (Figure 2c). SasG consists of
repeats of two domains (G5 and E), in which the C-terminus of any given domain is directly
connected to the N-terminus of the subsequent domain (Figure 2c). Furthermore, SasG
(G51-G57) has been shown to form long, elongated fibrillary structures that maintain a highly
extended conformation in solution, with no evidence of compaction [31]. The ESI-MS data
indicate a native-like conformation, centred on the 20+ and 21+ charge state ions, together
with a highly charged, more unfolded conformation (centred on the 48+ charge state ions)
(Figure 2c i). The ESI-TWIMS-MS CCS of the compact conformation was measured at 57.7
collapses in the absence of solvent to a species with a CCS of 80.7 nm2 (Figure 2c ii, iii).
Thus, an elongated linear protein, with no obvious linker or hinge regions can also undergo
Figure 2: Compaction in the gas-phase is observed for a range of non-globular proteins: (a)
(I27)5, (b) BamA POTRA domains and (c) SasG. ESI-TWIMS-MS (i) mass spectra and (ii)
CCS data for each protein are shown together with the theoretical CCS values before (from
the PDB co-ordinates) and after in vacuo MD equilibration (dotted lines). The starting and
Gas-phase collapse of other biomolecules
Recent ESI-TWIMS-MS studies indicated that the DNA duplex (d(GCGAAGC)) is a dynamic
ensemble in the gas-phase [46], in contrast to earlier work on G-complexes of ≥20
nucleotides which suggested that their chemical topology remained unaltered in the
gas-phase [47]. Here, we carried out ESI-TWIMS-MS analyses on two RNAs, each of 35
nucleotides and of very similar mass, but different sequences and secondary structures
(2PCV [48]; 11,217 Da and 2DRB ([49]; 11,219 Da) (Table 1;Figure 3a) to determine if their
3D structures were preserved in the gas-phase and hence if it was possible to differentiate
between the two. An NMR solution structure has been published for 2PCV [48] and a crystal
structure for 2DRB [49] and these were used to calculate CCS values (Figure 3b).
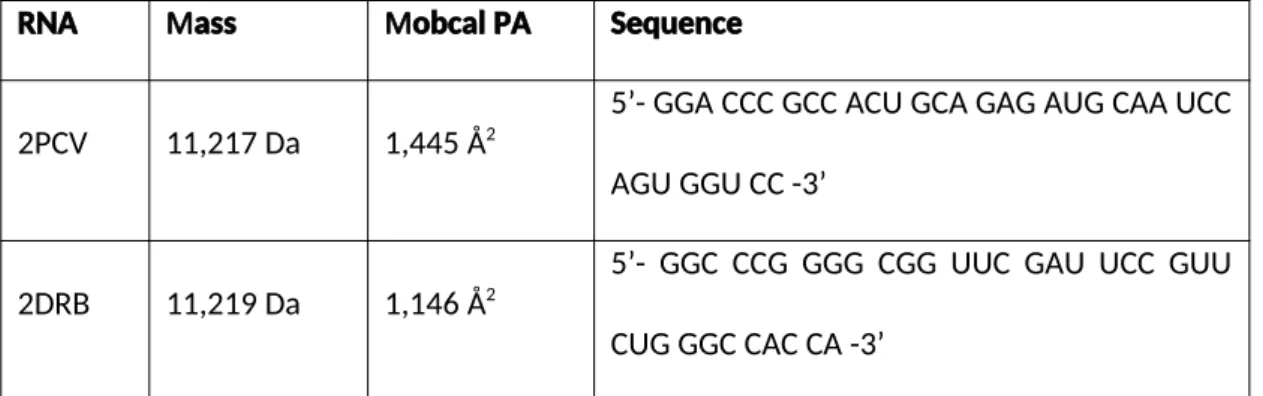
RNA Mass Mobcal PA Sequence
2PCV 11,217 Da 1,445 Å2
5’- GGA CCC GCC ACU GCA GAG AUG CAA UCC
AGU GGU CC -3’
2DRB 11,219 Da 1,146 Å2
5’- GGC CCG GGG CGG UUC GAU UCC GUU
CUG GGC CAC CA -3’
Table 1: The molecular masses, sequences and predicated CCSs of the two 35-nucleotide
RNAs: 2PCV and 2DRB.
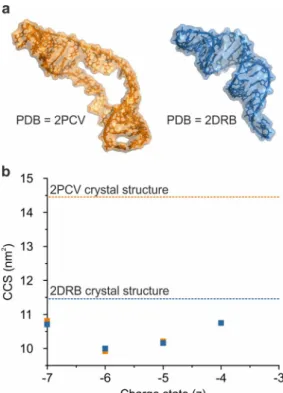
ESI-TWIMS-MS analysis of the RNAs yielded identical CCSs for all of the corresponding
charge state ions (4- to 7- ions; CCS ~10-11 nm2) (Figure 3b). Comparing the TWIMS CCS
values with the CCSs estimated from the PDB structures, the TWIMS CCS data were
significantly lower than the predicted values for either 2PCV (14.46 nm2) or 2DRB (11.46
nm2). For example, in the case of the 5- ions, TWIMS CCSs of 10.21 nm2 for 2PCV and
collapse. It may be argued that the ESI-MS solution conditions (50 mM aqueous ammonium
acetate) differ from the crystallography conditions used for 2DRB (50 mM HEPES, 80 mM
ammonium sulfate (n.b. some crystals were detected in the absence of the sulfate ions), 0.2
M tri-lithium citrate and 20% PEG4000 [49]) and from the NMR solution conditions used for
2PCV (5 mM cacodylate, 50 mM NaCl, and 0.1 mM EDTA [48]), and that this may have
affect the CCS values obtained from the three biophysical techniques. While beyond the
scope of this study, a systematic analysis of the effects of counterions, pH, oligonucleotide
length and sequence on collapse in the gas-phase with parallel MD simulations [46, 50]
could be informative to cast more light on the response of RNA molecules in the gas-phase
in general. However here, the collapse of both of the RNAs to a similar degree in the
gas-phase is evident.
Figure 3: Observed gas-phase collapse of RNAs. (a) The structures of two 35-nucleotide
RNA molecules: 2PCV [48] (orange) and 2DRB [49] (blue). (b) ESI-TWIMS-MS CCS data for
the 4- to 7- charge state ions of the two RNAs, together with the predicted values derived
Conclusion
The question remains: can the solution structure of proteins be retained upon transfer into
the gas-phase? For stable, globular proteins the answer is undoubtedly “yes”, backed by an
impressive number of literature examples. However, here we have presented a small
number of protein examples from our 14 years’ experience with ESI-IMS-MS where we have
found that the CCS values measured underestimate the physical size of the solution
structure and modelled data of the biomolecule under scrutiny. This phenomenon has been
reported elsewhere in the case of antibodies [26-28], but here we have shown by studying
isolated regions of an antibody that the Fc region, which contains the majority of the flexible
hinge region, is more prone to gas-phase compaction than the Fab region. Other proteins we
have identified that undergo gas-phase compaction include those with flexible hinge regions
in between more structured domains, such as an engineered concatamer, (I27)5, in addition
to the BamA complex with its extended array of POTRA domains. Other non-globular
proteins such as SasG, an elongated linear protein, can also exhibit this behaviour.
Gas-phase compaction is not limited to proteins, as illustrated with reference to two 35-nucleotide
RNA molecules of similar mass but different shape. Both RNAs appeared from the
ESI-TWIMS-MS data to be significantly smaller than expected from their 3D crystal or solution
structures.
We do not intend this report to be perceived as a negative message to the use of
ESI-TWIMS-MS. Indeed, the advantages of this technique far outweigh any disadvantages.
However, there are certain classes of biomolecules for which due caution should be
employed when interpreting the results.
We thank the Biotechnology and Biological Sciences Research Council (BBSRC) and
Medimmune for funding PWAD (BB/J011819/1) and the Engineering and Physical Sciences
Research Council (EPSRC) and GSK for funding HCF (EP/I501495/1). The Synapt HDMS
mass spectrometer was funded by the BBSRC (BB/E012558/1) and the Synapt G2-S
donated by Drs M. Morris and K. Giles, Waters UK Ltd. SER and AEA also acknowledge
funding from the European Research Council under the European Union's Seventh
Framework Programme (FP7/2007-2013; ERC grant 322408). We thank Drs D. R. Brockwell
References
M r r M
1. Leney, A. C., Heck, A. J.: Native ass Spect omet y: What is in the Name? J. Am. Soc. ass r
Spect om., 28, 5-13 (2017).
d r r r r r
2. Loo, J. A.: Stu ying noncovalent p otein complexes by elect osp ay ionization mass spect omet y. Mass Spect om. Rev., r 16, 1-23 (1997).
M r r r r r r
3. a coux, J., Robinson, C. V.: Twenty yea s of gas phase st uctu al biology. St uctu e, 21, 1541-1550 (2013).
r r M r r d r r d r
4. Boh e , B. C., e enbloom, S. I., Koenige , S. L., Hil e b an , A. E., Clemme , D. E.: Biomolecule
M r r
analysis by Ion obility Spect omet y. Annu. Rev. Anal. Chem., 1, 1-10 (2008).
r M r r r d M
5. Bowe s, . T.: Ion mobility spect omet y: A pe sonal view of its evelopment at UCSB. Int. J. ass r
Spect om., 370, 75-96 (2014).
r rr d M M r d r r d
6. Clemme , D. E., Ja ol , . F.: Ion obility measu ements an thei applications to cluste s an
M r
biomolecules. ass Spect om., 32, 577-592 (1997).
M r r r r r d d
7. osie , P. D., Counte man, A. E., Ju s, P. C., Clemme , D. E.: P e iction of pepti e ion collision
r r r r r d d r r
c oss sections f om topological molecula st uctu e an amino aci pa amete s. Anal. Chem., 74, 1360-1370 (2002).
r M r r r r r
8. Reve comb, H. E., ason, E. A.: Theo y of plasma ch omatog aphy/gaseous elect opho esis: a review. Anal. Chem., 47, 970-983 (1975).
M r r r
9. Knapman, T. W., o ton, V. L., Stonehouse, N. J., Stockley, P. G., Ashc oft, A. E.: Dete mining the
r r d r r
topology of vi us assembly inte me iates using ion mobility spect omet y-mass
r r d M r
spect omet y. Rapi Commun. ass Spect om., 24, 3033-3042 (2010).
M rr d rd
10. Smith, D. P., Knapman, T. W., Campuzano, I., alham, R. W., Be yman, J. T., Ra fo , S. E.,
r r dr r r r
Ashc oft, A. E.: Deciphe ing ift time measu ements f om t avelling wave ion mobility
r r r r d r M r
spect omet y - mass spect omet y stu ies. Eu . J. ass Spect om., 15, 113-130 (2009).
d r M
11. Ruotolo, B. T., Benesch, J. L., San e cock, A. ., Hyung, S. J., Robinson, C. V.: Ion mobility-mass
r r r r r
spect omet y analysis of la ge p otein complexes. Nat. P otoc., 3, 1139-1152 (2008).
M r
12. Bush, . F., Hall, Z., Giles, K., Hoyes, J., Robinson, C. V., Ruotolo, B. T.: Collision c oss sections of
r d r r r r d d r r r
p oteins an thei complexes: a calib ation f amewo k an atabase fo gas-phase st uctu al biology. Anal. Chem., 82, 9557-9565 (2010).
r r d
13. Giles, K., P ingle, S. D., Wo thington, K. R., Little, D., Wil goose, J. L., Bateman, R. H.: Applications
r d r d r d r d d
of a t avelling wave-base a io-f equency-only stacke ing ion gui e. Rapi Commun. Mass Spect om., r 18, 2401-2414 (2004).
r dr M M
14. Be nstein, S. L., Dupuis, N. F., Laz, N. D., Wyttenbach, T., Con on, . ., Bitan, G., Teplow, B. D.,
r M d r r
Shea, J., Ruotolo, B. T., Robinson, C. V., Bowe s, . T.: Amyloi -β p otein oligome ization
d r r r d d d r r d
an the impo tance of tet ame s an o ecame s in the aetiology of Alzheime 's isease. Nat. Chem., 1:326, (2009).
r d M rr M r r d r r
15. Beve i ge, R., Chappius, Q., acphee, C., Ba an, P.: ass spect omet y metho s fo int insically diso e e p oteins. Analyst, rd r d r 138, 32-42 (2013).
r d M M
16. Hoppe , J. T., Yu, Y. T., Li, D., Raymon , A., Bostock, ., Liko, I., ikhailov, V., Laganowsky, A.,
r M r r
Benesch, J. L., Caff ey, ., Nietlispach, D., Robinson, C. V.: Dete gent-f ee mass
r r r r M d
spect omet y of memb ane p otein complexes. Nat. etho s, 10, 1206-1208 (2013).
r r r r r d r d
17. Konijnenbe g, A., Butte e , A., Sobott, F.: Native ion mobility-mass spect omet y an elate
d r r
metho s in st uctu al biology. Biochim. Biophys. Acta, 1834, 1239-1256 (2013).
d M d r M M d
18. Laganowsky, A., Rea ing, E., Allison, T. ., Ulmschnei e , . B., Degiacomi, . T., Bal win, A. J.,
M r r d d d r r r d
Robinson, C. V.: emb ane p oteins bin lipi s selectively to mo ulate thei st uctu e an r
function. Natu e, 510, 172-175 (2014).
d r M
19. Ruotolo, B. T., Giles, K., Campuzano, I., San e cock, A. ., Bateman, R. H., Robinson, C. V.:
d r r r r r r
d M M M rr M r r r r 20. Schmi t, ., Zhou, ., a iott, H., o gne , N., Politis, A., Robinson, C. V.: Compa ative c
oss-d r r r r r
linking an mass spect omet y of an intact F-type ATPase suggest a ole fo phospho ylation. Nat. Commun., 4, 1985 (2013).
r dr r r
21. Van Dujin, E., Ba en egt, A., Synowsky, S., Ve sluis, C., Heck, A. J.: Chape onin complexes
r d r r
monito e by ion mobility mass spect omet y. J. Am. Chem. Soc., 131, 1452-1459 (2009).
M r
22. Zhou, ., Politis, A., Davies, R. B., Liko, I., Wu, K.-J., Stewa t, A., Stock, D., Robinson, C. V.: Ion
r r r r r d d r d
mobility mass spect omet y of a ota y ATPase eveals ATP-in uce e uction in r
confo mational flexibility. Nat. Chem., 6, 208-215 (2014).
r d d M r d d r
23. Hogan, C. J., Ruotolo, B. T., Robinson, C. V., Fe nan ez e la o a, J.: Tan em iffe ential
r r r r r
mobility analysis-mass spect omet y eveals pa tial gas-phase collapse of the G oEL complex. J. Phys. Chem., 115, 3614-3621 (2011).
r M d r d
24. Jenne , ., Ellis, J., Huang, W. C., Lloy Raven, E., Robe ts, G. C., Ol ham, N. J.: Detection of a
r r r r r
p otein confo mational equilib ium by elect osp ay ionisation-ion mobility-mass
r r d
spect omet y. Angew. Chem. Int. E . Engl., 50, 8291-8293 (2011).
r rr r r r r r
25. Ju neczko, E., Ba an, P. E.: How useful is ion mobility mass spect omet y fo st uctu al biology?
r r r r r d r r
The elationship between p otein c ystal st uctu es an thei collision c oss sections in the gas phase. Analyst, 136, 20-28 (2011).
rr r M d M r r
26. Campuzano, I. D. G., La iba, C., Bagal, D., Schnie , P. D.: Ion obility an ass Spect omet y Measu ements of the Humanize IgGk NIST r d Monoclonal Antibo y. Chapte 4, ACSd r
r r d r r r
Symposium Se ies, Vol. 1202, State-of-the-A t an Eme ging Technologies fo The apeutic Monoclonal Antibo y Cha acte ization Volume 3. Defining the Next Gene ation of Analyticald r r r
d
an Biophysical Techniques, 75-112 (2015).
r r r r
27. Debaene, F., Boeuf, A., Wagne -Rousset, E., Colas, O., Ayoub, D., Co vaia, N., Van Do sselae , A.,
r M d r d dr
Beck, A., Cianfe ani, S.: Innovative native S metho ologies fo antibo y ug conjugate
r r r M d M M r r d d r
cha acte ization: High esolution native S an I - S fo ave age DAR an DAR ist ibution assessment. Anal. Chem., 86, 10674-10683 (2014).
r rr M r r r r rr
28. Pachola z, K. J., Po ini, ., Ga lish, R. A., Bu nley, R. J., Taylo , R. J., Hen y, A. J., Ba an, P. E.:
r d dr r r
Dynamics of intact immunoglobulin G explo e by ift-tube ion-mobility mass spect omet y
d r d d
an molecula mo eling. Angew. Chem. Int. E . Engl., 53, 7765-7769 (2014).
r dd rd r r r d
29. B ockwell, D. J., Be a , G. S., Cla kson, J., Zinobe , R. C., Blake, A. W., T inick, J., Olmstea , P.
d rd r d
D., Smith, D. A., Ra fo , S. E.: The effect of co e estabilization on the mechanical resistance of I27. Biophys. J., 83, 458-472 (2002).
d M r r r r
30. Ia anza, . G., Higgins, A. J., Sch iffen, B., Calab ese, A. N., B ockwell, D. J., Ashc oft, A. E.,
d rd r rr r
Ra fo , S. E., Ranson, N. A.: Late al opening in the intact beta-ba el assembly machine y
r d r M
captu e by c yo-E . Nat. Commun., 7:12865, (2016).
r rr r M r
31. G uska, D. T., Whelan, F., Fa ance, O. E., Fung, H. K., Paci, E., Jeff ies, C. ., Sve gun, D. I.,
d r r r d
Bal ock, C., Baumann, C. G., B ockwell, D. J., Potts, J. R., Cla ke, J.: Coope ative fol ing of
r d rd r d d dr r d r
int insically iso e e omains ives assembly of a st ong elongate p otein. Nat. Commun., 6:7271, (2015).
d M r
32. Hoaglan , C. S., Liu, Y. H., Ellington, A. D., Pagel, ., Clemme , D. E.: Gas-phase DNA: r r
Oligothymine ion confo me s. J. Am. Chem. Soc., 119, 9051-9052 (1997).
M M r M r r rr d M r r
33. esleh, . F., Hunte , J. ., Shva tsbu g, A. A., Schatz, G. C., Ja ol , . F.: St uctu al
r r r r
info mation f om oion mobility measu ements: Effects of the long- ange potential. J. Phys. Chem., 100, 16082-16086 (1996).
d r r M r r r r
34. Bleihol e , C., Wyttenbach, T., Bowe s, . T.: A novel p ojection app oximation algo ithm fo the
d r r r M d M
fast an accu ate computation of molecula collision c oss sections (I). etho . Int. J. ass r
Spect om., 308, 1-10 (2011).
r r r r M
35. B ooks, B. R., B uccole i, R. E., Olafson, B. D., States, D. J., Swaminathan, S., Ka plus, .:
MM r r r r r r d d
r M r d M r
36. Humph ey, W., Dalke, D., Schulten, K.: V D: visual molecula ynamics. J. ol. G aph., 14, 27-28 (1996).
rr M r r r r r
37. Ha is, L. J., Skaletsky, E., cPhe son, A.: C ystallog aphic st uctu e of an intact IgG1 monoclonal
d M
antibo y. J. ol. Biol., 275, 861-872 (1998).
M M
38. Fleming, P. J., Patel, D. S., Wu, E. L., Qi, Y., Yeom, . S., Sousa, . C., Fleming, K. G., Im, W.: BamA
r d M r r
POTRA Domain Inte acts with a Native Lipi emb ane Su face. Biophys. J., 110, 2698-2709 (2016).
r r M r rr M r d M r
39. Obe hause , A. F., a szalek, P. E., Ca ion-Vazquez, ., Fe nan ez, J. .: Single p otein
d r d r r r
misfol ing events captu e by atomic fo ce mic oscopy. Nat. St uct. Biol., 6, 1025-1028 (1999).
r r d rr M r r d M
40. Li, H., Obe hause , A. F., Re ick, S. D., Ca ion-Vazquez, ., E ickson, H. P., Fe nan ez, J. .: Multiple confo mations of PEVK p oteins etecte by single-molecule techniques. P oc. Natl.r r d d r
d
Aca . Sci. USA, 98, 10682-10686 (2001).
r M r M r r r d r
41. von Castelmu , E., a ino, ., Sve gun, D. I., K eplak, L., Ucu um-Fotia is, Z., Kona ev, P. V.,
r M r r r r d
U zhumtsev, A., Labeit, D., Labeit, S., ayans, O.: A egula patte n of Ig supe -motifs efines
r d
segmental flexibility as the elastic mechanism of the titin chain. P oc. Natl. Aca . Sci. USA,
105, 1186-1191 (2008).
r r rd M r r d
42. Gatzeva-Topalova, P. Z., Wa ne , L. R., Pa i, A., Sousa, . C.: St uctu e an flexibility of the
r d r r r
complete pe iplasmic omain of BamA: the p otein inse tion machine of the oute
r r r
memb ane. St uctu e, 18, 1492-1501 (2010).
M M d r rd M
43. Knowles, T. J., Jeeves, ., Bobat, S., Dancea, F., cClellan , D., Palme , T., Ove uin, .,
d r d d d r r d d r
Hen e son, I. R.: Fol an function of polypepti e t anspo t-associate omains esponsible
r d r d d r r M M r
fo elive ing unfol e p oteins to memb anes. ol. ic obiol., 68, 1216-1227 (2008).
r r d r d
44. Imp ota, S., Politou, A. S., Pasto e, A.: Immunoglobulin-like mo ules f om titin I-ban : extensible
r r
components of muscle elasticity. St uctu e, 4, 323-337 (1996).
d rd r d r r d
45. Smith, D. P., Ra fo , S. E., Ashc oft, A. E.: Elongate oligome s in beta(2)-mic oglobulin amyloi
r d r r r r r d
assembly eveale by ion mobility spect omet y-mass spect omet y. P ocee ings Of The
d d r
National Aca emy Of Sciences Of The Unite States Of Ame ica, 107, 6794-6798 (2010).
r r r r r r M
46. A cella, A., D eye , J., Ippoliti, E., Ivani, I., Po tella, G., Gabelica, V., Ca loni, P., O ozco, .:
r r d d d d
St uctu e an ynamics of oligonucleoti es in the gas phase. Angew. Chem. Int. E . Engl., 54, 467-471 (2015).
r r r M dr
47. Bake , E. S., Be nstein, S. L., Gabelica, V., De Pauw, E., Bowe s, . T.: G-qua uplexes in
r r r r d r r M r
telome ic epeats a e conse ve in a solvent-f ee envi onment. Int. J. ass Spect om., 253, 225-237 (2006).
r M r r r r r d
48. Jin, H., Lo ia, J. P., oo e, P. B.: Solution st uctu e of an RNA subst ate boun to the
d r d M
pseu ou i ylation pocket of a box H/ACA snoRNA. ol. Cell, 26, 205-215 (2007).
r r r d
49. Tomita, K., Ishitani, R., Fukai, S., Nu eki, O.: Complete c ystallog aphic analysis of the ynamics of
dd r
CCA sequence a ition. Natu e, 443, 956-960 (2006).
M r M r d r M d
50. Li, R., acnama a, L. ., Leuchte , J. D., Alexan e , R. W., Cho, S. S.: D Simulations of tRNA an
d d d r M