Article
1
Developing an ANFIS-PSO Model to Estimate
2
Mercury Emission in Combustion Flue Gases
3
Shahaboddin Shamshirband 1,2, Alireza Baghban 3, Masoud Hadipoor 4 and Amir Mosavi 5,6,*
4
1 Faculty of Information Technology, Ton Duc Thang University, Ho Chi Minh City, Viet Nam
5
2 Department for Management of Science and Technology Development, Ton Duc Thang University, Ho Chi
6
Minh City, Viet Nam; [email protected]
7
3 Department of Petroleum Engineering, Ahwaz Faculty of Petroleum Engineering, Petroleum University of
8
Technology (PUT), Ahwaz; [email protected]
9
4 Department of Chemical Engineering, Amirkabir University of Technology (Tehran Polytechnic),
10
Mahshahr Campus, Mahshahr; [email protected]
11
5 Kando Kalman Faculty of Electrical Engineering, Obuda University, Budapest, Hungary
12
6 School of Built the Environment, Oxford Brookes University, Oxford, UK; [email protected]
13
* Correspondence: [email protected]
14
Abstract: Accurate prediction of mercury content emitted from fossil-fueled power stations is of
15
utmost important for environmental pollution assessment and hazard mitigation. In this paper,
16
mercury content in the output gas of power stations’ boilers was predicted using adaptive
neuro-17
fuzzy inference system (ANFIS) method integrated with particle swarm optimization (PSO). The
18
input parameters of the model include coal characteristics and the operational parameters of the
19
boilers. The dataset has been collected from 82 power plants and employed to educate and examine
20
the proposed model. To evaluate the performance of the proposed ANFIS-PSO model the statistical
21
meter of MARE% was implemented, which resulted 0.003266 and 0.013272 for training and testing
22
respectively. Furthermore, relative errors between acquired data and predicted values were
23
between -0.25% and 0.1%, which confirm the accuracy of the model to deal nonlinearity and
24
representing the dependency of flue gas mercury content into the specifications of coal and the
25
boiler type.
26
Keywords: ANFIS-PSO; air pollution prediction; flue gas, emission, mercury; adaptive neuro-fuzzy
27
inference system (ANFIS); particle swarm optimization (PSO); hybrid machine learning model
28
29
1. Introduction
30
Intelligent monitoring of the industrial air pollutants is of utmost important to maintain an
31
acceptable air quality [1-4]. Among the numerous industrial pollutants, the mercury contamination
32
has been identified as one of the most acute air pollutants produced by conventional fossil fueled
33
power stations [5-8]. Mercury contamination can cause significant ecological hazard with a
34
considerable effect on human well-being around the world [9-12] . As a lethal and hugely volatile
35
metal, mercury can cause contamination of the surface streams and lakes, as well as groundwater
36
[13]. It is the most dangerous hazard for infants and young adults as it influences the central nervous
37
system, causing utero and severe illnesses [14]. Previous studies, e.g. [7-11] report that a substantial
38
amount of mercury outflows to the earth comes from coal-fired power plants. In 2010, roughly 2000
39
mg mercury outflows to the air from various sections worldwide [15]. Coal burning had a share of
40
24%, which is a relatively high share [16]. Power plants are in charge of around 33% Mercury
41
outflows, and this type of emission is caused by human beings [17], and Elemental mercury emission
42
is about 20-50% of mercury emissions which originate from combustion of coal [18, 19]. Nowadays,
43
mercury emission from coal consumption has become a global concern [12,13,14]. In 2006, total coal
44
consumption in China was about 40.1% of world consumption, which is equivalent to 1238.3 million
45
tons of oil [20]. Thus, some studies suggest that the amount of mercury emission is more likely to
46
increase during the next years because of more uses in developing countries [21]. The environmental
47
protection agency of United States of America announced mercury as one of the most dangerous air
48
pollutants. In 1999, an approximated amount of 45 tons of mercury outflows from coal-consuming
49
plants to the environment (Alto 2000). The developing worry of this contamination in the U.S has
50
incited government and specialists to start endeavors to recognize, estimate, and cut off on the
51
anthropogenic emissions. As a result of the absence of cost-effective, promptly accessible and efficient
52
practical control methodologies in the U.S, discharge of this dangerous contaminant from
coal-53
consuming boilers are not basically under control. It gets worse when the greater of part power
54
supply in a big country such as the United States originates from utility boilers that use coal (EPA
55
2001) and furthermore About 70% of electricity power in china is produced by burning coal, in which
56
50% of this coal is burned in coal-based power plants [22-24].
57
In 1998, Paying attention to the enormous potential for environmental dangers, EPA proposed
58
a request to ask coal-consuming plants to publish information on the amounts of mercury
59
contaminant outflows from their systems. This request was designed to gather information in three
60
primary stages precisely. The first and principal stage was intended to collect all standard data on
61
coal-burning power plants around the U.S. afterward, as the second stage of the program, analyzed
62
feed data at the entrance of every plant during a year were collected. Eventually, in the third phase,
63
EPA chose 84 out of 1084 plants to gather data of mercury emission in some specified points within
64
the selected plants. This selection was based on some statistic activities on the feed specifications and
65
also the operational structure of each plant. Resulted in information from the third phase of the
66
program was evaluated. Representing correlations were developed to predict the emission of
67
mercury in each plant concerning coal qualities and operating conditions. It was found that the best
68
input data were characteristics of coal, for example, the concentration of mercury, heating value,
69
chlorine sulfur, operating parameters such as temperatures and pressures and also yield parameters
70
in boilers such as the amount of mercury oxidization. Beside abovementioned backgrounds, artificial
71
intelligence approaches are powerful tools to forecast parameters by finding correlations between
72
variables. This kind of networks can see the nonlinear relationship between parameters, so they are
73
valuable method [25].
74
A deep understanding of the power plant is needed to control the amounts of mercury
75
emissions. Therefore, an accurate estimation of emission is of utmost important to control and reduce
76
mercury emission [26]. Numerous investigations were published in the literature regarding
77
applications of artificial intelligence approaches. Computational intelligence has been both used to
78
predict the amount of mercury emission and also to model the elimination of elemental mercury from
79
boilers’ outlet gas [27]. Dragomir and Oprea [28] present a multi-agent prediction tool for intelligent
80
monitoring of the pollutants on the power plants. They used a model based on neural networks to
81
predict the amount of SO2, NOx, particulate matters (PMs), and mercury emissions. Jensen et al. [29]
82
presented a study on the relationship between mercury in the flue gas and coal specifications and the
83
type of boiler using a multilayer perceptron model. They derived an accurate model with a
84
correlation coefficient of 0.9750. Antanasijevic et al. [30] developed a prediction model using neural
85
networks and genetic algorithm (GA) to accurately calculate the amount of PM10 emissions for up to
86
two years ahead. Zhao et al. [31] used support vector machine to develop a model which provided
87
better performance and accuracy. In 2016, Wang et al. [32] worked on the application of GA-back
88
propagation (GA-BP) for predicting the amount of mercury component in flue gases of 20 different
89
coal-fired boilers. Correlation coefficient training data points was as high as 0.895, and they showed
90
that GA-BP is a promising method for this goal. Li et al. [33] employed computational intelligence
91
approach to cut off on the elemental mercury in coal-fired boilers, and finally, they found that the
92
increment of capture efficiency can approximately improve up to 15%.
93
Although, the application of machine learning for prediction of pollutants and mercury
94
emissions is well stablished within the scientific communities, the potential of the novel machine
95
learning models (e.g., ensembles and hybrids) is still not explored for mercury prediction. In
96
particular a wide range of novel hybrid machine learning methods have been recently developed to
97
which is an integration of adaptive neuro-fuzzy inference system (ANFIS) and particle swarm
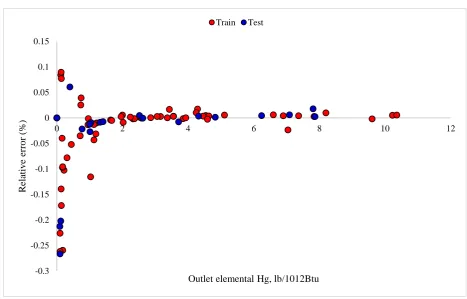
99
optimization (PSO) has shown to deliver promising results [37]. The aim of the present study is to
100
find a reliable relationship between elemental mercury in the output gas, the specification of feed,
101
and the type of boilers by utilizing an ANFIS-PSO based approach.
102
2. Model development
103
The description of the hybrid model of ANFIS-PSO is presented in [37]. Note that, when there is
104
not enough data on the detailed information of an operating power plant, it is extremely difficult to
105
build a precise model to predict the amount of mercury outflow.In the present study, an endeavor
106
has made to develop a model to predict mercury outflows from boilers at some specified testing
107
locations. In this kind of locations, every single factor that may influence the mercury discharge is
108
considered and incorporated into the model. A total number of 82 data points were gathered from
109
literature to train and evaluate the model [29]. The concentration of mercury in the inlet feed, ash
110
content, chlorine content, the heating value of coal, sulfur content, and temperature were chosen as
111
the most effective variables. This data bank comprises a total number of 82 data points, from which
112
75% were used as training, and the rest of them were exploited testing samples. In the developed
113
ANFIS model, six previously mentioned parameters were considered as input parameters, and the
114
elemental mercury emission was selected as the target variable. Furthermore, the PSO algorithm was
115
used to find the optimized Gaussian membership function parameters of the proposed ANFIS model.
116
The method of ANFIS is proposed by Jang [38, 39] and is a versatile and very intelligent hybrid
117
system. ANFIS approach can be expressed as a complete collaboration between computing activities
118
and neuro-fuzzy system [40]. This method integrates natural and neural networks and uses their
119
strength into its advantage. Such methodology exploits back-propagation calculation from the
120
information gathering process to make the essential basics of the fuzzy system. Its framework is
121
related to an arrangement of fuzzy IF-THEN rules which have learning ability to estimate nonlinear
122
functions. Basics of the ANFIS method are approximately similar to a fuzzy system developed by
123
Takagi-Sugeno-Kang [41, 42]. In reverse spread learning capability of the ANFIS method, which is
124
based on the calculation of derivatives of squared errors in a backward manner form output nodes
125
to the input ones, this method constructs and utilizes robust learning methodology based on gradient
126
least-squares approach. To determine the consequence factors in the forward section, the least square
127
approach is utilized. Then the preset parameters will reset by gradient descent in the regressive
128
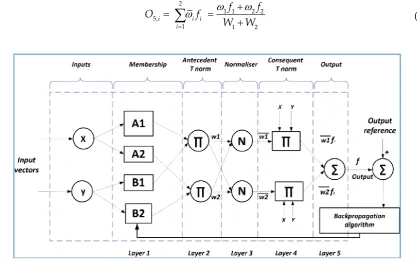
advance [43]. The adaptive network is constructed of five layers. Figure 1 shows these layers, their
129
nodes and connections with the assumption of two inputs to the fuzzy inference system expressed
130
by “x” and ”y” and a single output of “f”. As an explanation about the configuration of ANFIS, it
131
must be noted that two fuzzy 'if-then' rules are utilized which they follow sugeno FIS as:
132
133
1 1 1 1 1 1
2 2 2 2 1 1
x=A , y
=B
x=A
assume
as
s
um
e
,
y
=B
f
P
q y
r
f
P
q y
r
134
135
Fuzzification layer, which is the first layer of the structure produces all membership grades for
136
each variable. Node functions in this layer can be defined as follows:
137
1,i Ai
( )
1, 2
O
x
i
(1)
1,i Bi 2
( )
3, 4
O
x
i
(2)Memberships of a fussy set are (Ai, Bi) and O1, i represents the resulted value from the ith node of
138
the first layer. The input signals are generated by the nodes of layer 2.
139
(
2,i i Ai
( )
Bi x)1, 2
O
w
x
i
(3)
3,1 2
1, 2
ii
W
O
i
W
W
(4)Where Wi is ruled firing strengths of node i which has a normalized firing strength of ωi. Results
141
of layer four can be written as follows:
142
4,i i
(
i i i)
1,
2
O
f
i
P
q
y
r
i
(5)In this notation pi, qi, and ri are called consequent parameters. Eventually, the general output
143
can be defined as follows, which is calculated in the nodes of layer 5:
144
2 1 1 2 21 1 2
5,i i i
i
O
f
f
f
W
W
(6)145
146
Figure 1. A schematic view of the ANFIS intelligent system.
147
ANFIS, has shown promising results in a wide range of applications for developing prediction
148
models [44-47]. However, optimization of the model parameters can dramatically improve the
149
quality and accuracy of modeling [37]. For that matter, a huge number of optimization
150
methodologies, such as PSO, are available to reinforce the parameters and answers of the ANFIS
151
system [48]. PSO is extraordinary compared to other approaches with the end goal of optimization.
152
This study takes the benefits of this algorithm.
153
Particle swarm optimization method has been inspired from birds behavior seeking food [49,
154
50]. In this model, particles update their places and pathways based on their and others information;
155
so it was proposed that the particle possess a memory function. The optimization process is based on
156
competition and collaboration between particles. When PSO is used to solve optimization problems,
157
one can follow the particles state by their pathways, and velocities. Three vectors Xi, Vi, Pbesti are
158
introduced to explain the properties of a particle: Xi is the current place; Vi the current speed; Pbesti
159
the best spatial placement sought by the particle and gbesti is the optimal solution searched by the
160
whole group of particles. The position and pathway of the particle will be updated gradually, based
161
on the following formula:
162
1 2
(
1)
( )
(0,1) [
( )
( )]
(0,1) [
( )
( )] (7)
v k
v k
c rand
pbest k
persent k
c rand
gbest k
persent k
163
164
present (k + 1) = present (k) + v (k + 1) (8)
165
Where, v( ) is particle speed in kth and k+1th iterations; present ( ) is particle position; c1, c2 are
166
rand( ). Formula (7) represents the updating process of the particle’s speed, which includes a particle’s
168
historical velocities and personal and global best positions [51].
169
3. Results
170
The amount of mercury emission was estimated using an ANFIS approach. Emission of mercury
171
into the environment generally is a strong function of mercury six previously mentioned variables.
172
We used MATLAB software to construct our model. A Gaussian function was used to optimize the
173
parameters. In addition to that, the total number of 10 clusters were utilized in the ANFIS hybrid
174
system. Optimization was conducted on a total number of parameters that were determined by:
175
N =N N N
T c mf(9)
176
Where the number of parameters for undergoing optimization is denoted by NT, and Nmf, is used to
177
show the number of Gaussian membership functions that are used, Nυ and Nc show how many
178
variables, and clusters are used in the model, respectively. It is noteworthy to state that in this study,
179
two membership functions, seven input and output variables, and 10 clusters are used. Eventually,
180
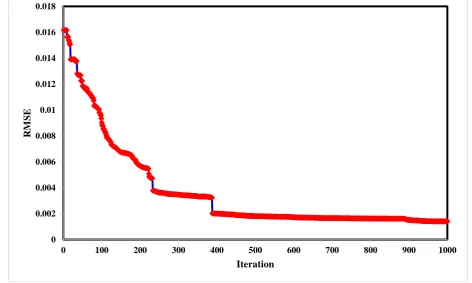
using a PSO algorithm, optimization was conducted for 140 tuning parameters. As is shown in Figure
181
2, to evaluate the functionality of the PSO algorithm, a root means square error (RMSE) analyze was
182
used. Results show that in a total number of 1000 iterations, the minimum value of RMSE is touched.
183
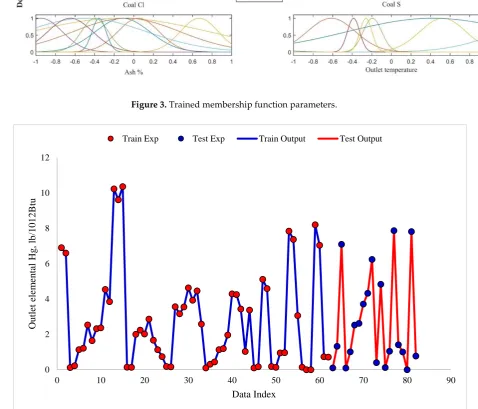
Figure 3 indicates train membership function parameters for each input variables. It is seen that the
184
results of the presented model are in good agreement with the obtained data, which is the result of
185
great learning capability of the developed ANFIS model. Figure 4 illustrates the obtained data of
186
mercury emissions versus the test and training ofANFIShybrid system.
187
188
Figure 2. Root mean square errors versus number of iterations.
189
0 0.002 0.004 0.006 0.008 0.01 0.012 0.014 0.016 0.018
0 100 200 300 400 500 600 700 800 900 1000
RM
SE
190
Figure 3. Trained membership function parameters.
191
192
Figure 4. Obtained data form plants and ANFIS values for mercury emissions in the stages of training
193
and testing.
194
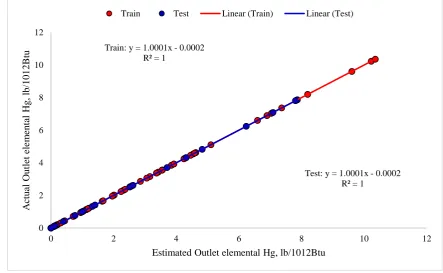
As is shown in Figure 5, actual and predicted mercury emissions are located on a straight line
195
with an approximate slope of 1 (45o line) which indicates that the obtained information and ANFIS
196
predicted ones are in good agreement. The obtained cross-fit line in both test and training data sets
197
have an 𝑅2 Equal to 1, which shows the accurateness of the model. To compare the results of the
198
model and evaluate its precision, the method of mean absolute relative error is used. For training and
199
testing steps, using mean absolute relative error percentage (MARE %) method, percentage values of
200
0.003266 and 0.013272 are calculated, respectively. Resulted relative deviations are presented in the
201
0 2 4 6 8 10 12
0 10 20 30 40 50 60 70 80 90
Ou
tlet
elem
en
tal
Hg
,
lb
/1
0
1
2
B
tu
Data Index
Figure 6. Low relative deviations are observed due to accurately-predicted values. Different statistical
202
analyses were also presented in Table 1 for the suggested model.
203
204
Figure 5. Regressions derived between estimated and collected data of mercury emissions.
205
Table 1. Statistical analysis of the model for all phases.
206
Train Test R2 1.000 1.000 MSE 1.40E-07 1.39E-07 MRE (%) 0.037 0.044
207
Train: y = 1.0001x - 0.0002 R² = 1
Test: y = 1.0001x - 0.0002 R² = 1
0 2 4 6 8 10 12
0 2 4 6 8 10 12
A
ctu
al
Ou
tlet
elem
en
tal
Hg
,
lb
/1
0
1
2
B
tu
208
Figure 6. Deviation between the obtained data from plants and predicted mercury emissions.
209
4. Conclusions
210
Emission of mercury is known as one of the most perilous environmental contamination. In this
211
study, a comprehensive literature review was done, and a predictive model was built to predict the
212
amount of mercury emission based on the characteristics of the coal supply, operational conditions,
213
and so forth. The presented model is based on the ANFIS system, which utilizes a PSO algorithm to
214
estimate the amount of mercury emission to the environment. Data from 82 power plants have been
215
used to train and develop the ANFIS model. The MARE% for training and testing were 0.003266 and
216
0.013272, respectively. Furthermore, relative errors between acquired data and predicted values were
217
between -0.25% and 0.1%, which confirm the accuracy of PSO-ANFIS model. It was seen that for both
218
training and testing parts, the coefficient of determination was calculated to equal to unity, which
219
reflects the accuracy of the proposed ANFIS-PSO based model.
220
Author Contributions: For research articles with several authors, a short paragraph specifying their individual
221
contributions must be provided.
222
Conflicts of Interest: The authors declare no conflict of interest.
223
References
224
1. Hong E, Lee S, Kim GB, Kim TJ, Kim HW, Lee K, et al. Effects of environmental air pollution on pulmonary
225
function level of residents in Korean industrial complexes. International Journal of Environmental Research
226
and Public Health. 2018;15.
227
2. Jirik V, Brezna B, Machaczka O, Honkysova S, Miturova H, Janout V. Associations between air pollution
228
in the industrial and suburban parts of Ostrava city and their use. Environmental Monitoring and
229
Assessment. 2017;189.
230
3. Lyanguzova IV. Dynamic trends of heavy metal contents in plants and soil under different industrial air
231
pollution regimes. Russian Journal of Ecology. 2017;48:311-20.
232
4. Oyjinda P, Pochai N. Numerical Simulation to Air Pollution Emission Control near an Industrial Zone.
233
Advances in Mathematical Physics. 2017;2017.
234
-0.3 -0.25 -0.2 -0.15 -0.1 -0.05 0 0.05 0.1 0.15
0 2 4 6 8 10 12
R
elativ
e
er
ro
r
(%)
5. Gao W, Jiang W, Zhou M. The spatial and temporal characteristics of mercury emission from coal
235
combustion in China during the year 2015. Atmospheric Pollution Research. 2019;10:776-83.
236
6. Marczak M, Budzyń S, Szczurowski J, Kogut K, Burmistrz P. Active methods of mercury removal from flue
237
gases. Environmental Science and Pollution Research. 2019;26:8383-92.
238
7. Sung JH, Back SK, Lee ES, Jang HN, Seo YC, Kang YS, et al. Application of powdered activated carbon
239
coating to fabrics in a hybrid filter to enhance mercury removal. Journal of Environmental Sciences (China).
240
2019;80:58-65.
241
8. Zhao S, Pudasainee D, Duan Y, Gupta R, Liu M, Lu J. A review on mercury in coal combustion process:
242
Content and occurrence forms in coal, transformation, sampling methods, emission and control
243
technologies. Progress in Energy and Combustion Science. 2019:26-64.
244
9. Bourtsalas AC, Themelis NJ. Major sources of mercury emissions to the atmosphere: The U.S. case. Waste
245
Management. 2019;85:90-4.
246
10. Budnik LT, Casteleyn L. Mercury pollution in modern times and its socio-medical consequences. Science
247
of the Total Environment. 2019;654:720-34.
248
11. Li X, Li Z, Wu T, Chen J, Fu C, Zhang L, et al. Atmospheric mercury emissions from two pre-calciner cement
249
plants in Southwest China. Atmospheric Environment. 2019:177-88.
250
12. Zhou H, Hopke PK, Zhou C, Holsen TM. Ambient mercury source identification at a New York State urban
251
site: Rochester, NY. Science of the Total Environment. 2019;650:1327-37.
252
13. Zhao S, Duan Y, Chen L, Li Y, Yao T, Liu S, et al. Study on emission of hazardous trace elements in a
253
350 MW coal-fired power plant. Part 1. Mercury. Environmental Pollution. 2017;229:863-70.
254
14. Mahavong K, Pataranawat P, Chinwetkitvanich S. Mercury contamination in environment surrounding
255
coal-fired power plant. International Journal of GEOMATE. 2017;12:71-7.
256
15. Amap/Unep. Technical background report for the Global Mercury Assessment 2013. Arctic Monitoring and
257
Assessment Programme, Oslo, Norway/UNEP Chemicals Branch Geneva, Switzerland. 2013.
258
16. Burmistrz P, Kogut K, Marczak M, Zwoździak J. Lignites and subbituminous coals combustion in Polish
259
power plants as a source of anthropogenic mercury emission. Fuel Process Technol. 2016;152:250-8.
260
17. Alto P. Power plants and mercury, environmental issues. CA: Electric Power Research Institute; 2001.
261
18. Carpi A. Mercury from combustion sources: a review of the chemical species emitted and their transport
262
in the atmosphere. Water Air Soil Pollut. 1997;98:241-54
263
19. Srivastava RK, Hutson N, Martin B, Princiotta F, Staudt JX. Control of mercury emissions from coal-fired
264
electric utility boilers. Environmental Science & Te chnology. 2006:1385-93.
265
20. Zhang L, Zhuo Y, Chen L, Xu X, Chen C. Mercury emissions from six coal-fired power plants in China.
266
Fuel Process Technol. 2008;89:1033-40.
267
21. Streets DG, Zhang Q, Wu Y. Projections of global mercury emissions in 2050. Environ Sci Technol.
268
2009;43:2983-8.
269
22. Tian H, Wang Y, Cheng K, Qu Y, Hao J, Xue Z, et al. Control strategies of atmospheric mercury emissions
270
from coal-fired power plants in China. Journal of the Air & Waste Management Association.
2012;62:576-271
86.
272
23. Tian H, Wang Y, Xue Z, Qu Y, Chai F, Hao J. Atmospheric emissions estimation of Hg, As, and Se from
273
coal-fired power plants in China, 2007. Sci Total Environ. 2011;409:3078-81.
274
24. You CFa, Xu XC. Coal combustion and its pollution control in China. Energy. 2010;35:4467-72.
275
25. Baghban A, Ahmadi MA, Shahraki BH. Prediction carbon dioxide solubility in presence of various ionic
276
liquids using computational intelligence approaches. The Journal of supercritical fluids. 2015;98:50-64.
277
26. Song J, Romero CE, Yao Z, He B. A globally enhanced general regression neural network for on-line
278
multiple emissions prediction of utility boiler. Knowledge Based Syst. 2017;118:4-14.
279
27. Li Q, Wu J, Wei H. Reduction of elemental mercury in coal-fired boiler flue gas with computational
280
intelligence approach. Energy. 2018;160:753-62.
281
28. Dragomir EG, Oprea MJIPV. A Multi-Agent System for Power Plants Air Pollution Monitoring.
2013;46:89-282
94.
283
29. Jensen RR, Karki S, Salehfar H. Artificial neural network-based estimation of mercury speciation in
284
combustion flue gases. Fuel Processing Technology. 2004;85:451-62.
285
30. Antanasijević DZ, Pocajt VV, Povrenović DS, Ristić MĐ, Perić-Grujić AA. PM10 emission forecasting using
286
artificial neural networks and genetic algorithm input variable optimization. Journal of Science of the Total
287
Environment. 2013;443:511-9.
31. Zhao B, Zhang Z, Jin J, Pan W-P. Modeling mercury speciation in combustion flue gases using support
289
vector machine: Prediction and evaluation. J Hazard Mater. 2010;174:244-50.
290
32. Wang F, Tian G, Wang X, Liu Y, Deng S, Wang H, et al. Application of genetic algorithm-back propagation
291
for prediction of mercury speciation in combustion flue gas. Clean Technologies Environmental Policy.
292
2016;18:1211-8.
293
33. Li Q, Wu J, Wei H. Reduction of elemental mercury in coal-fired boiler flue gas with computational
294
intelligence approach. J Energy. 2018;160:753-62.
295
34. Ardabili SF, Najafi B, Alizamir M, Mosavi A, Shamshirband S, Rabczuk T. Using SVM-RSM and ELM-RSM
296
approaches for optimizing the production process of methyl and ethyl esters. Energies. 2018;11.
297
35. Qasem SN, Samadianfard S, Nahand HS, Mosavi A, Shamshirband S, Chau KW. Estimating daily dew
298
point temperature using machine learning algorithms. Water (Switzerland). 2019;11.
299
36. Torabi M, Mosavi A, Ozturk P, Varkonyi-Koczy A, Istvan V. A Hybrid Machine Learning Approach for
300
Daily Prediction of Solar Radiation. Lecture Notes in Networks and Systems: Springer; 2019. p. 266-74.
301
37. Basser H, Karami H, Shamshirband S, Akib S, Amirmojahedi M, Ahmad R, et al. Hybrid ANFIS-PSO
302
approach for predicting optimum parameters of a protective spur dike. Applied Soft Computing Journal.
303
2015;30:642-9.
304
38. Roger JJ-S. ANFIS: adaptive-network-based fuzzy inference system. IEEE Transactions on Systems, Man,
305
and Cybernetics. 1993;23:665-85.
306
39. Jang J-SR. Fuzzy Modeling Using Generalized Neural Networks and Kalman Filter Algorithm. AAAI.
307
1991;91:762-7.
308
40. Baghban A. Application of the ANFIS strategy to estimate vaporization enthalpies of petroleum fractions
309
and pure hydrocarbons. Pet Sci Technol. 2016;34:1359-66.
310
41. Takagi T, Sugeno M. Fuzzy identification of systems and its applications to modeling and control.
311
transactions on systems, man, and cybernetics. 1985:116-32.
312
42. Sugeno M, Kang. Structure identification of fuzzy model. Fuzzy Sets Syst. 1988;28:15-33.
313
43. Baghban A, Bahadori M, Ahmad Z, Kashiwao T, Bahadori. Modeling of true vapor pressure of petroleum
314
products using ANFIS algorithm. Pet Sci Technol. 2016;34:933-9.
315
44. Dehghani M, Riahi-Madvar H, Hooshyaripor F, Mosavi A, Shamshirband S, Zavadskas EK, et al. Prediction
316
of hydropower generation using grey Wolf optimization adaptive neuro-fuzzy inference system. Energies.
317
2019;12.
318
45. Mosavi A, Edalatifar M. A Hybrid Neuro-Fuzzy Algorithm for Prediction of Reference Evapotranspiration.
319
Lecture Notes in Networks and Systems: Springer; 2019. p. 235-43.
320
46. Mosavi A, Salimi M, Ardabili SF, Rabczuk T, Shamshirband S, Varkonyi-Koczy AR. State of the art of
321
machine learning models in energy systems, a systematic review. Energies. 2019;12.
322
47. Rezakazemi M, Mosavi A, Shirazian S. ANFIS pattern for molecular membranes separation optimization.
323
Journal of Molecular Liquids. 2019;274:470-6.
324
48. Baghban A, Kashiwao T, Bahadori M, Ahmad Z, Bahadori A. Estimation of natural gases water content
325
using adaptive neuro-fuzzy inference system. Pet Sci Technol. 2016;34:891-7.
326
49. Chen G, Huang X, Jia J, Min Z. Natural exponential inertia weight strategy in particle swarm optimization.
327
2006 6th World Congress on Intelligent Control and Automation: IEEE; 2006. p. 3672-5.
328
50. El-Gallad A, El-Hawary M, Sallam A, Kalas A. Enhancing the particle swarm optimizer via proper
329
parameters selection. IEEE CCECE2002 Canadian Conference on Electrical and Computer Engineering
330
Conference Proceedings (Cat No 02CH37373): IEEE; 2002. p. 792-7.
331
51. Meng X, Pian Z. Intelligent Coordinated Control of Complex Uncertain Systems for Power Distribution
332
and Network Reliability: Elsevier; 2015.