Higgs physics at CMS
MilosDordevic on behalf of the CMS Collaboration1,∗ 1Vinca Institute of Nuclear Sciences, University of Belgrade
Abstract.The most recent results of a Higgs boson production and properties from the CMS Collaboration using the LHC Run 1 and Run 2 data are reported. These include analyses of a Higgs boson decaying to a pair of photons, four leptons via Z boson pair decays and the associated production of a Higgs boson with top quark pair, predicted by the Standard Model (SM). The studies of a Higgs boson decays to a pair of bottom quarks, a pair of tau leptons and a charm quark pair are also presented. The Higgs boson production via vector boson fusion (VBF) and decaying to invisible particles is reported here as well. The analysis of a Higgs boson decay to a pair of muons is also presented. The study of a Higgs boson pair production at 13 TeV is performed as well and projections of a Higgs boson self couplings together with the couplings to other particles at the HL-LHC are made.
1 Introduction
The Higgs boson was discovered in 2012 at CERN by the ATLAS and CMS Collaborations [1–3], with mass measured to be around 125 GeV and precise measurements of its spin-parity, width, boson and fermion couplings were pursued ever since the discovery. All the performed measurement have turned out to be consistent with the prediction of the SM. With the full LHC Run 2 data available, the focus of the Higgs boson studies shifted from the Higgs boson discovery also to the precision measurements of the Higgs boson couplings and properties. The yet not accessible decay modes are being studied, the Higgs boson anomalous couplings are being searched for and a large available datasets have enabled to study also the differential
cross sections. The recent results of the Higgs boson studies by the CMS Collaboration [4] are presented in this report.
2 Higgs boson decay to two photons
The analysis of a Higgs boson decaying to two photons was performed targeting the gluon-gluon fusion (ggF) and the vector boson fusion (VBF) production modes, using the data recorded by the CMS experiment in 2016 and 2017 [5]. The simplified template cross section (STXS) framework [6] that minimizes a theory dependence of the Higgs boson measurement was used in this analysis. The extensive usage of Boosted Decision Trees (BDT) was applied and dedicated BDTs were trained for the photon and vertex identification, signal extraction and the event categorization. The signal plus background fit was performed in all analysis categories. The fitted diphoton invariant mass spectrum for the sum of all categories, each
∗e-mail: [email protected]
weighted by the ratio of the number of signal over signal plus background events, S/(S+B),
is presented in Fig. 1. The measured cross section, normalized to the corresponding SM pre-diction, targeting the ggF and VBF production modes is found to be:σggH/σS MggH=1.15+0.15
−0.15 andσqqH/σS MqqH = 0.8+0.4
−0.3. The results of a seven parameter fit performed using the STXS framework are presented in Fig. 2, each showing a good agreement with the SM prediction, within the uncertainties.
S/(S+B) Weighted Events / GeV 0 5000 10000 15000 20000 25000 30000 35000
Data S+B fit B component
σ
1
± σ
2
±
S/(S+B) weighted All categories
--Preliminary
CMS 77.4 fb-1 (13TeV)
γ γ →
H
(GeV)
γ γ
m
100 110 120 130 140 150 160 170 180
500
−
0 500
1000 B component subtracted
Figure 1. Signal plus background
model fit to the diphoton invariant mass spectrum for the sum of all categories. The bottom plot shows the residuals af-ter the background component is sub-traction [5].
theo
σ /
proc
σ
2
− 0 2 4 6 8
-0.3 +0.4
0.8
qqH
-0.8 +0.8
2.2
ggH BSM
-0.5 +0.6
0.8
ggH GE2J
-0.7 +0.9
1.7
ggH 1J high
-0.4 +0.4
0.7
ggH 1J med
-0.5 +0.6
1.3
ggH 1J low
-0.20 +0.20
1.18
ggH 0J
profiled H m
Observation
SM Prediction Preliminary
CMS γ γ →
H
TeV) (13
-1
77.4 fb
Figure 2. The results of a
seven-parameter fit in the STXS framework. Cross section ratios are shown with approximate 68% CL intervals (black points), and compared to the SM expec-tations and uncertainties (blue bands) [5].
3 Higgs boson decay to four leptons
The decay of a Higgs boson to four leptons, being either electrons or muons, via production of a Z boson pair has a clean experimental signature with a large signal to background ratio, due to an excellent lepton momentum resolution. It also provides a possibility for a precise measurement of the Higgs boson mass and width.
3.1 Measurement of the Higgs boson mass
The Higgs boson mass was measured with the 2016 data recorded by the CMS experiment, using its decay to four leptons via production of a Z boson pair [7]. The reconstructed in-variant mass of the four lepton system is presented in Fig. 3. This analysis applies matrix element discriminants in order to enhance the signal sensitivity. The three-dimensional fit, taking account the four lepton invariant mass, a per-event estimate of the mass resolution and a kinematic discriminant variable as the inputs was performed. This lead to the measured combined value of the Higgs boson mass ofmH=125.26±0.20 (stat.) ±0.08 (syst.) GeV.
The likelihood scan versus the Higgs boson mass, while profiling the signal strength modifier
µalong with all other nuisance parameters, is shown in Fig. 4. The systematic uncertainty in the mass measurement is totally dominated by the uncertainty in the lepton momentum scale.
3.2 Measurement of the Higgs boson width
weighted by the ratio of the number of signal over signal plus background events, S/(S+B),
is presented in Fig. 1. The measured cross section, normalized to the corresponding SM pre-diction, targeting the ggF and VBF production modes is found to be:σggH/σS MggH=1.15+0.15
−0.15 andσqqH/σS MqqH = 0.8+0.4
−0.3. The results of a seven parameter fit performed using the STXS framework are presented in Fig. 2, each showing a good agreement with the SM prediction, within the uncertainties.
S/(S+B) Weighted Events / GeV 0 5000 10000 15000 20000 25000 30000 35000 Data S+B fit B component σ 1 ± σ 2 ± S/(S+B) weighted All categories --Preliminary
CMS 77.4 fb-1 (13TeV)
γ γ → H (GeV) γ γ m
100 110 120 130 140 150 160 170 180
500
−
0 500
1000 B component subtracted
Figure 1. Signal plus background
model fit to the diphoton invariant mass spectrum for the sum of all categories. The bottom plot shows the residuals af-ter the background component is sub-traction [5]. theo σ / proc σ 2
− 0 2 4 6 8
-0.3 +0.4 0.8 qqH -0.8 +0.8 2.2 ggH BSM -0.5 +0.6 0.8 ggH GE2J -0.7 +0.9 1.7
ggH 1J high
-0.4 +0.4
0.7
ggH 1J med
-0.5 +0.6
1.3
ggH 1J low
-0.20 +0.20 1.18 ggH 0J profiled H m Observation SM Prediction Preliminary CMS γ γ → H TeV) (13 -1 77.4 fb
Figure 2. The results of a
seven-parameter fit in the STXS framework. Cross section ratios are shown with approximate 68% CL intervals (black points), and compared to the SM expec-tations and uncertainties (blue bands) [5].
3 Higgs boson decay to four leptons
The decay of a Higgs boson to four leptons, being either electrons or muons, via production of a Z boson pair has a clean experimental signature with a large signal to background ratio, due to an excellent lepton momentum resolution. It also provides a possibility for a precise measurement of the Higgs boson mass and width.
3.1 Measurement of the Higgs boson mass
The Higgs boson mass was measured with the 2016 data recorded by the CMS experiment, using its decay to four leptons via production of a Z boson pair [7]. The reconstructed in-variant mass of the four lepton system is presented in Fig. 3. This analysis applies matrix element discriminants in order to enhance the signal sensitivity. The three-dimensional fit, taking account the four lepton invariant mass, a per-event estimate of the mass resolution and a kinematic discriminant variable as the inputs was performed. This lead to the measured combined value of the Higgs boson mass ofmH=125.26±0.20 (stat.) ±0.08 (syst.) GeV.
The likelihood scan versus the Higgs boson mass, while profiling the signal strength modifier
µalong with all other nuisance parameters, is shown in Fig. 4. The systematic uncertainty in the mass measurement is totally dominated by the uncertainty in the lepton momentum scale.
3.2 Measurement of the Higgs boson width
The Higgs boson width was studied in the four lepton final state using the combination of the Run 1 data with the Run 2 data recorded by the CMS experiment in 2016 and 2017 [8].
(GeV)
l 4
m
80 100 200 300 400 500
Events / 4 GeV
0 20 40 60 80 100 700 900 (13 TeV) -1 35.9 fb CMS Data H(125) * γ ZZ, Z → q q * γ ZZ, Z → gg Z+X
Figure 3. Distribution of the
recon-structed four-lepton invariant mass m4l
in the full mass range [7].
(GeV)
H
m
120 121 122 123 124 125 126 127
lnL ∆ -2 0 1 2 3 4 5 6 7 8 µ 4 µ 2e2 4e Combined Combined (stat. only)
(13 TeV)
-1
35.9 fb CMS
Figure 4. 1D likelihood scans as a
function of the mass for a different
fi-nal states and a combination of all fifi-nal states for the 3D mass measurement [7].
The kinematic information from the decay particles and the associated jets are combined us-ing matrix element techniques in order to identify the production mechanism and to increase the sensitivity to the Higgs boson couplings in both production and decay. The Higgs boson width was measured using the off-shell production method that relies on the relative ratio of
the off-shell to the on-shell measurement. The width constraints are shown in Fig. 5 which
represents the observed (solid) and expected (dashed) likelihood scans. The constraints on the anomalous HVV couplings are found to be consistent with the SM expectation in both on-shell and off-shell regions. With the assumption of a coupling structure similar to that
in the SM, the Higgs boson width is constrained to be 3.2+2.8
−2.2MeV, while the expected con-straint based on simulation is 4.1+5.0
−4.0 MeV. This width measurement is significantly better than using the on-shell method alone, that is approximately 1 GeV [7–9]. No anomalous HVV interactions were observed.
0 2 4 6 8 10 12 14
(MeV) H Γ 0 5 10 15 lnL ∆ -2
=0 (SM-like analysis)
ai f ) unconstrained a3 φ cos( a3 f ) unconstrained a2 φ cos( a2 f ) unconstrained 1 Λ φ cos( 1 Λ f Observed Expected (13 TeV) -1 (8 TeV) + 80.2 fb -1
(7 TeV) + 19.7 fb -1
5.1 fb
CMS
68% CL 95% CL
Figure 5.Observed (solid) and expected (dashed) likelihood scans ofΓH. Results of the combined Run
1 and Run 2 data analyses, with the 2015 data included in the on-shell case. The dashed horizontal lines show the 68% and 95% CL regions [8].
3.3 Differential and fiducial cross sections
The differential and fiducial cross sections were measured in the four lepton final state using
the full Run 2 dataset [11]. The cross section for the Higgs boson decay to four leptons in a fiducial region closely matching the experimental selection of the leptons is measured to beσ=2.73+0.23
−0.22(stat.)−+00..2419(syst.) fb atmH=125.09 GeV, compared to the SM prediction of 2.76±0.14 fb. The inclusive fiducial cross section in different final states and their
combina-tion is shown in Fig. 6. The differential cross sections as a function of thepT and rapidity of the Higgs boson, the number of associated jets and thepT of the leading associated jet are de-termined. In the Fig. 7 the differential cross section as a a function of thepT is presented. All results are consistent with the expectations for the SM Higgs boson, within the uncertainties.
4l 2e2µ 4µ 4e
(fb)
fid
σ
0.5 1 1.5 2 2.5 3 3.5 4
4.5 Combined Data (stat. 2016 Data (35.9 fb-1)⊕ sys. unc.) )
-1
2017 Data (41.5 fb )
-1
2018 Data (59.7 fb Systematic uncertainty
H (NNLOPS) + XH → gg
H (POWHEG) + XH → gg
XH = VBF + VH + ttH (POWHEG) =125.09 GeV)
H
(LHC HXSWG YR4, m
(13 TeV)
-1
137.1 fb
CMSPreliminary
Figure 6. The measured inclusive
fidu-cial cross section in different final states
[11].
(H) (fb/GeV) T
/dp
fid
σ
d
4
−
10 3
−
10 2
−
10 1
−
10
1 Data (stat. ⊕ sys. unc.) Systematic uncertainty H (NNLOPS) + XH → gg
H (POWHEG) + XH → gg
XH = VBF + VH + ttH (POWHEG) =125.09 GeV)
H
(LHC HXSWG YR4, m
(13 TeV)
-1
137.1 fb
CMSPreliminary
(H) > 200 GeV)T
(p
σ
50
1
(H) (GeV)
T
p
0 50 100 150 200 250
Ratio to NNLOPS 0.20 0.4 0.6
0.81
1.2 1.4
Figure 7.The results of the differential
cross section measurement forpT[11].
4 Higgs boson production with top quark pair
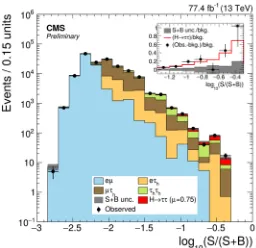
The observation of a Higgs boson production in association with a top quark-antiquark pair (ttH) is reported in [12], where the analyses performed with data recorded at 7, 8 and 13 TeV were combined. This analysis of ttH production allows for a direct measurement of the top quark Yukawa coupling (yt). The results of a statistically independent search for Higgs boson production associated to a top quark pair and decaying to a pair of W bosons, Z bosons, photons, tau leptons or bottom quark jets are combined to maximize sensitivity. The presence of a ttH signal is assessed by performing a simultaneous fit to the data from the different decay modes. The distribution of alog10(S/B) is shown in Fig. 8, where the S and B are the expected post-fit signal (withµttH=1) and background yields, respectively, in each bin of the distributions considered in the combination. The value of a test statistic q as a function of theµttHis shown in Fig. 9, withµttHbased on the combination of decay modes described above for the combined fit. The observed significance is 5.2 standard deviations, while the expected significance for a SM Higgs boson with a mass of 125.09 GeV is 4.2 standard deviations.
The ttH analysis with multilepton final states, including Higgs boson decays to a pair of W bosons, Z bosons and tau leptons is performed also with 2017 data and reported in [13]. The analysis used BDT and matrix-element discriminant methods for signal extraction, also combined in a two-dimensional approach (2D BDT), trained againsttt¯and ttV(W/Z)
3.3 Differential and fiducial cross sections
The differential and fiducial cross sections were measured in the four lepton final state using
the full Run 2 dataset [11]. The cross section for the Higgs boson decay to four leptons in a fiducial region closely matching the experimental selection of the leptons is measured to
beσ=2.73+0.23
−0.22(stat.)−+00..2419(syst.) fb atmH=125.09 GeV, compared to the SM prediction of
2.76±0.14 fb. The inclusive fiducial cross section in different final states and their
combina-tion is shown in Fig. 6. The differential cross sections as a function of the pT and rapidity of
the Higgs boson, the number of associated jets and thepTof the leading associated jet are
de-termined. In the Fig. 7 the differential cross section as a a function of thepTis presented. All
results are consistent with the expectations for the SM Higgs boson, within the uncertainties.
4l 2e2µ 4µ 4e
(fb) fid σ 0.5 1 1.5 2 2.5 3 3.5 4
4.5 Combined Data (stat. 2016 Data (35.9 fb-1)⊕ sys. unc.) )
-1
2017 Data (41.5 fb )
-1
2018 Data (59.7 fb Systematic uncertainty
H (NNLOPS) + XH → gg
H (POWHEG) + XH → gg
XH = VBF + VH + ttH (POWHEG) =125.09 GeV)
H
(LHC HXSWG YR4, m
(13 TeV)
-1
137.1 fb
CMSPreliminary
Figure 6. The measured inclusive fidu-cial cross section in different final states [11].
(H) (fb/GeV) T
/dp fid σ d 4 − 10 3 − 10 2 − 10 1 − 10
1 Data (stat. ⊕ sys. unc.) Systematic uncertainty H (NNLOPS) + XH → gg
H (POWHEG) + XH → gg
XH = VBF + VH + ttH (POWHEG) =125.09 GeV)
H
(LHC HXSWG YR4, m
(13 TeV)
-1
137.1 fb
CMSPreliminary
(H) > 200 GeV)T
(p σ 50 1 (H) (GeV) T p
0 50 100 150 200 250
Ratio to NNLOPS 0.20 0.4 0.6
0.81
1.2 1.4
Figure 7.The results of the differential
cross section measurement forpT[11].
4 Higgs boson production with top quark pair
The observation of a Higgs boson production in association with a top quark-antiquark pair (ttH) is reported in [12], where the analyses performed with data recorded at 7, 8 and 13 TeV were combined. This analysis of ttH production allows for a direct measurement of
the top quark Yukawa coupling (yt). The results of a statistically independent search for
Higgs boson production associated to a top quark pair and decaying to a pair of W bosons, Z bosons, photons, tau leptons or bottom quark jets are combined to maximize sensitivity. The presence of a ttH signal is assessed by performing a simultaneous fit to the data from
the different decay modes. The distribution of alog10(S/B) is shown in Fig. 8, where the S
and B are the expected post-fit signal (withµttH =1) and background yields, respectively, in
each bin of the distributions considered in the combination. The value of a test statistic q as
a function of theµttHis shown in Fig. 9, withµttHbased on the combination of decay modes
described above for the combined fit. The observed significance is 5.2 standard deviations, while the expected significance for a SM Higgs boson with a mass of 125.09 GeV is 4.2 standard deviations.
The ttH analysis with multilepton final states, including Higgs boson decays to a pair of W bosons, Z bosons and tau leptons is performed also with 2017 data and reported in [13]. The analysis used BDT and matrix-element discriminant methods for signal extraction,
also combined in a two-dimensional approach (2D BDT), trained againsttt¯and ttV(W/Z)
backgrounds, where the 2D space is partitioned using recursive methods, maximizing sig-nal sensitivity. An excess of events is observed in the highest bins of the BDT distribution,
Events 1 10 2 10 3 10 4 10 5 10 6
10 ObservedBackground Uncertainty =1.26) µ H ( t t =1.00) µ H ( t t CMS Supplementary (13 TeV) -1
(8 TeV) + 35.9 fb
-1
(7 TeV) + 19.7 fb
-1 5.1 fb (S/B) 10 log 3.0
− −2.5 −2.0 −1.5 −1.0 −0.5 0.0
Obs. / Bkg. 1.0 1.5 2.0 2.5
Figure 8. Distribution of the events as a function of the decimal logarithm of S/B, where the S and B are the expected
post-fit signal (withµttH=1) and
back-ground yields, respectively, in each bin of the distributions in this combination [12].
H tt µ
0 0.5 1 1.5 2 2.5 3 3.5
q 0 5 10 15 20 25 30 35 σ 1 σ 2 σ 3 σ 4 σ 5 σ 5.2 σ 4.2 σ 4.5 σ 3.2 CMS (13 TeV) -1 (8 TeV) + 35.9 fb -1 (7 TeV) + 19.7 fb -1 5.1 fb Combined SM expected 13 TeV 7+8 TeV
Figure 9.The test statistic q, described
in the text, as a function ofµttH for all
decay modes at 7+8 TeV and at 13 TeV, separately, and for all the decay modes at all the system of center of mass ener-gies [12].
as shown in Fig. 10, corresponding to the observed significance of 3.2 standard deviations, with the expected significance of 4.0 standard deviations. The analysis of a Higgs boson de-caying to a pair of bottom quarks is also updated in [14], yielding with observed (expected) signal significance of 3.9 (3.5) standard deviations. These results represent a first evidence of ttH(bb) production, following also the updated b-tagger and the optimized analysis. The analysis of the ttH production where a Higgs boson decays to a pair of photons is also per-formed using the 2017 data [14], yielding an observed signal significance of 4.1 and expected significance of 2.7 standard deviations.
x
2 4 6 8 10
Events 0 20 40 60 80 100 µ (ttH)= µ ± l ± 2lss l
Observed Uncertainty Non-prompt Charge mis-m Conv. Rares EWK ttW + ttWW ttZ ttH
CMSPreliminary 41.5 fb-1 (13 TeV)
BDT
2 4 6 8 10
Data/pred. 0.6 0.8 1 1.2 1.4
Figure 10. The distribution of the dis-criminating observable used for the sig-nal extraction in the 2lss categories [13].
0.2 0.25 0.3 0.35 0.4 0.45 0.5 0.55 0.6 0.65
Events / 0.03
1 10 2 10 3 10 4 10 5
10 Data signal~~~
+lf tt Single t
c +c tt V+jets
+b tt tt+V~~~
+2b tt Diboson
b +b
tt Uncertainty
3 b tags)
≥ 6 jets, ≥ SL ( H node tt Post-fit Preliminary
CMS 41.5 fb-1 (13 TeV)
ANN discriminant
0.2 0.25 0.3 0.35 0.4 0.45 0.5 0.55 0.6 0.65
Data / Pred. 0.6 0.81 1.2 1.4
Figure 11.The final discriminant shape in the categories with high sensitivity in the semi-leptonic channel after a fit to data [14].
5 Higgs boson decay to bottom quarks
The analysis of a Higgs boson decay to bottom quarks, allowing to test the top quark Yukawa coupling to the down-type quark, is presented in [15]. The most sensitive Higgs boson pro-duction process is the associated propro-duction to a vector boson, being either a W or Z boson. Depending on the decay of vector bosons, the final states with either 0, 1 or 2 leptons, together with a two bottom quark jets are considered in this analysis. The most important backgrounds to this process are the V+jets,tt¯and single top quark production and the QCD multijet
pro-cess. A deep neural network (DNN) discriminant was used to tag the bottom quark jets. The dijet mass resolution is improved using the DNN regression method. The signal is ex-tracted by fitting the DNN score. An alternative to fitting the DNN score is to fit the m(jj) distribution, which results in less sensitivity but enables a more direct visualization of the Higgs boson signal, as shown in Fig. 12. The best fit to the signal strength in the individual channels and their combination is presented in Fig. 13. Combining this result with the pre-vious measurements of this decay by the CMS Collaboration, in the events where the Higgs boson is produced through gluon fusion, vector boson fusion, or in an association with top quarks, the observed (expected) significance is 5.6 (5.5) standard deviations. This constitutes an observation of the Higgs boson decay to a bottom quark pair, by the CMS Collaboration.
m(jj) [GeV] 60 80 100 120 140 160
S/(S+B) weighted entries
0 500 1000
Data b b
→
VH,H b b
→
VZ,Z S+B uncertainty CMS
(13 TeV)
-1
77.2 fb
Figure 12.Dijet invariant mass
distribu-tion for events weighted by S/(S+B) in
all channels combined in the 2016 and 2017 datasets. The weights are derived from a fit to the dijet mass distribution [15].
µ
Best fit
0 1 2 3 4 5 6 7 8 9
Combined ZH WH ttH VBF ggF
stat syst
0.14
±
0.14
±
1.04 0.16
±
0.24
±
0.88 0.24
±
0.29
±
1.24 0.37
±
0.23
±
0.85 1.17
±
0.98
±
2.53 1.30
±
2.08
±
2.80
CMS
(13 TeV)
-1
77.2 fb
≤
(8 TeV) +
-1
19.8 fb
≤
(7 TeV) +
-1
5.1 fb
≤
b b
→
H
Observed syst)
⊕
(stat
σ
1
±
(syst)
σ
1
±
Figure 13. Best-fit value of the
sig-nal strength for Higgs boson decaying to pair of bottom quarks, for the five in-dividual production modes considered, as well as the overall combined results [15].
6 Higgs boson decay to tau lepton pair
The Higgs boson decays to a tau lepton pair with the second largest branching fraction among the fermionic Higgs boson decays. In the analysis reported here [16] the cross section for a Higgs boson decaying to a tau lepton pair was measured by the CMS Collaboration. The STXS framework was used to split the cross section measurement by the production and de-cay modes. The neural network classification was used to categorize the events. Four different
tau pair final states were considered: eµ,eτhad,µτhadandτhadτhad. A deep neural network method was used to identify the bottom quark jets, while the hadron-plus-strip algorithm was used for the reconstruction of tau leptons. The signal is present in the highest bins of the distribution in Fig. 14. The observed significance was measured to be 4.7 standard devia-tions, while the expected significance is estimated at 6.6 standard deviations. The inclusive
cross section times the branching fraction of Higgs boson decay to tau pair is measured to be
σincl×B(H→ττ)=2.56±0.46(stat.)±0.34(syst.) pb. When split into a production mode,
the cross section corresponding to a gluon-gluon fusion merged with abb¯plus Higgs boson production is measured to beσ(gg→H,bbH)×B(H→ττ)=1.11±0.81(stat.)±0.78(syst.)
pb, while the VBF plus V(jj)H has a cross section ofσ(VBF+V(qq)H)×B(H → ττ)=
0.34±0.08(stat.)±0.09(syst.) pb. The measured cross sections are in a good agreement with SM predictions, within the uncertainties.
Figure 14. Distribution of the decimal
logarithm of the signal purity after the fit to the data, evaluated in the bins of the signal categories used to extract the results. The signal and the background contributions from each decay channel are stacked on top of each other [16].
0 0.5 1 1.5 2 2.5 3
Bes t fit μX=σX/σSM
0 0.5 1 1.5 2 2.5 3
τhτh - 0.40 +0.47 1.48
μτh - 0.25 +0.26 0.43
eτh - 0.38 +0.36 0.28
eμ - 0.59 +0.62 1.39
Inclusive - 0.17 +0.18 0.75
(13 TeV) -1 77.4 fb
CMS
Preliminary
Figure 15. Results of the maximum
likelihood fit to the data, for a model with one signal strength parameter, as discussed above, split by final state and inclusively, for all final states combined [16].
7 Higgs boson decay to charm quarks
The Higgs boson decaying to a pair of charmed quarks is searched for in this analysis [17] of the CMS Collaboration. This decay has around 20 times smaller branching fraction than the Higgs boson decay to a pair of bottom quarks and there is a larger contribution of the vector boson plus light flavour jets background. The search is performed considering asso-ciated production of a Higgs boson to a vector boson, being either a W or Z boson. The leading backgrounds are vector boson production associated with jets and also thett¯process. Two distinctive topologies were considered in this analysis: the "resolved jet" topology in which the Higgs boson candidate is reconstructed from a two distinct charm quark jets and the "merged-jet" topology, in which the two charm quark jets are reconstructed as a single jet. The former focuses on the Higgs boson candidates with a low transverse momentum, while the latter performs better for the Higgs boson candidates with a high transverse momentum. The central feature of this search is the identification of a charm quark jets. Advanced ma-chine learning techniques are used for the charm-jet identification. The merged-jet topology makes use of jet substructure information to further suppress the backgrounds. The perfor-mance of the charm-jet identification is presented in Fig. 16. A three different final states were
two analysis yieldsµ=70 (37+−1611). This result is the most stringent direct limit on theH→cc
cross section times branching fraction.
Figure 16. The two curves showing
separately the tagging efficiency and the corresponding bottom jet and light jet
mistag rate. The jets withpT>20 GeV
and clustered using the AK4 algorithm
have been considered from att¯plus jets
MC sample before the application of any data-to-simulation reshaping [17].
cc) → (VH,H µ 95% CL upper limit on
0 50 100 150 200
SM
×
Obs.=70 SM
×
Exp.=37 Combination
SM
×
Obs.=93 SM
×
Exp.=57 2L
SM
×
Obs.=110 SM
×
Exp.=72 1L
SM
×
Obs.=83×SM
Exp.=79 0L
CMSPreliminary 35.9 fb-1 (13 TeV)
Observed Median expected 68% expected 95% expected
Figure 17. The 95% confidence level
upper limits on µ for the VH(H →
cc) process from the combination of the
resolved-jet and merged-jet analyses in the different channels (0L, 1L and 2L) and combined [17].
8 VBF Higgs boson decay to invisible particles
The analysis [18] of a Higgs boson produced via the VBF production mode and decaying to invisible particles is performed by the CMS Collaboration. In the SM, the Higgs boson decays invisibly only through the decay to four neutrinos, via a pair of Z bosons. The rate for the invisible decays of a Higgs boson may be enhanced in the context of several BSM scenarios, including those in which the Higgs boson acts as a portal to dark matter (DM) [19–21]. In the targeted VBF events, a Higgs boson is produced along with a two jets that
exhibit a large separation in pseudorapidity (|∆ηj j|) and a large dijet invariant mass (mj j).
This analysis optimally exploits the distinctive kinematic features of the VBF topology by
fitting the shape of themj jdistribution. The observed and the expected 95% CL upper limits
on (σ/σS M) B(H→inv) for a partial combination based either on the 7+8 or 13 TeV data as
well as their combination is shown in Fig. 18. The results were interpreted also in the context
of a Higgs-portal model of DM interaction, where the most stringent limits formχ smaller
than 18(7) GeV, assuming a fermion (scalar) DM candidate, were provided, as shown in Fig. 19. These limits are computed at the 90% CL so that they could be compared with those from the direct detection experiments such as XENON1T [22], LUX [23], PandaX-II [24], CDMSlite [25], CRESST-II [26] and CDEX- 10 [27] which provide the strongest constraints
in themχrange probed by this search.
9 Higgs boson decay to muon pair
The analysis [28] of a Higgs boson decaying to a pair of muons is performed by the CMS Collaboration. There is a small expected branching fraction for a Higgs boson decay to a
pair of muons, having a value of 2.17 x 10⁻⁴. The primary production mechanisms are the
two analysis yieldsµ=70 (37+−1611). This result is the most stringent direct limit on theH→cc
cross section times branching fraction.
Figure 16. The two curves showing
separately the tagging efficiency and the corresponding bottom jet and light jet
mistag rate. The jets withpT>20 GeV
and clustered using the AK4 algorithm
have been considered from att¯plus jets
MC sample before the application of any data-to-simulation reshaping [17].
cc) → (VH,H µ 95% CL upper limit on
0 50 100 150 200
SM × Obs.=70 SM × Exp.=37 Combination SM × Obs.=93 SM × Exp.=57 2L SM × Obs.=110 SM × Exp.=72 1L SM ×
Obs.=83×SM
Exp.=79 0L
CMSPreliminary 35.9 fb-1 (13 TeV)
Observed Median expected 68% expected 95% expected
Figure 17. The 95% confidence level
upper limits on µ for the VH(H →
cc) process from the combination of the
resolved-jet and merged-jet analyses in the different channels (0L, 1L and 2L) and combined [17].
8 VBF Higgs boson decay to invisible particles
The analysis [18] of a Higgs boson produced via the VBF production mode and decaying to invisible particles is performed by the CMS Collaboration. In the SM, the Higgs boson decays invisibly only through the decay to four neutrinos, via a pair of Z bosons. The rate for the invisible decays of a Higgs boson may be enhanced in the context of several BSM scenarios, including those in which the Higgs boson acts as a portal to dark matter (DM) [19–21]. In the targeted VBF events, a Higgs boson is produced along with a two jets that
exhibit a large separation in pseudorapidity (|∆ηj j|) and a large dijet invariant mass (mj j).
This analysis optimally exploits the distinctive kinematic features of the VBF topology by
fitting the shape of themj jdistribution. The observed and the expected 95% CL upper limits
on (σ/σS M) B(H→inv) for a partial combination based either on the 7+8 or 13 TeV data as
well as their combination is shown in Fig. 18. The results were interpreted also in the context
of a Higgs-portal model of DM interaction, where the most stringent limits formχsmaller
than 18(7) GeV, assuming a fermion (scalar) DM candidate, were provided, as shown in Fig. 19. These limits are computed at the 90% CL so that they could be compared with those from the direct detection experiments such as XENON1T [22], LUX [23], PandaX-II [24], CDMSlite [25], CRESST-II [26] and CDEX- 10 [27] which provide the strongest constraints
in themχrange probed by this search.
9 Higgs boson decay to muon pair
The analysis [28] of a Higgs boson decaying to a pair of muons is performed by the CMS Collaboration. There is a small expected branching fraction for a Higgs boson decay to a
pair of muons, having a value of 2.17 x 10⁻⁴. The primary production mechanisms are the
Combined 7+8+13 TeV Combined 13 TeV Combined 7+8 TeV
SM σ inv)/ → x B(H σ
95% CL upper limit on
0 0.1 0.2 0.3 0.4 0.5 0.6 0.7 0.8 0.9 1 Observed Median expected 68% expected 95% expected (13 TeV) -1 (8 TeV) + 38.2 fb -1 (7 TeV) + 19.7 fb -1 4.9 fb
CMS
Figure 18.Observed and expected 95%
CL upper limits on (σ/σS M) B(H→inv)
for partial combinations based either on 7+8 or 13 TeV data and combination, assuming SM production cross sections for a Higgs boson mass of 125.09 GeV [18].
[GeV]
χ
m
1 10 102 103
] 2 [cm DM-nucleon SI σ 47 − 10 46 − 10 45 − 10 44 − 10 43 − 10 42 − 10 41 − 10 40 − 10 39 − 10 38 − 10 37 − 10
90% CL limits inv) < 0.16 → B(H Fermion DM Scalar DM Direct detection XENON-1T LUX PandaX-II CDMSLite CRESST-II CDEX-10 (13 TeV) -1
(8 TeV) + 38.2 fb
-1
(7 TeV) + 19.7 fb
-1
4.9 fb
CMS
Higgs-portal models
Figure 19. The 90% CL upper
lim-its on the spin-independent DM-nucleon scattering cross section in Higgs-portal models, assuming a scalar (solid orange) or fermion (dashed red) DM candidate [18].
VBF and ggH processes. To suppress the Drell-Yan, single top andtt¯backgrounds, boosted
decision trees were used. An iterative procedure is applied in order to optimize the event categories, based on the sum of a signal events squared, over the number of background events. A total of 15 categories were utilized in this analysis. A maximum likelihood fit to the dimuon invariant mass was perfomed, as shown in Fig. 20. The analysis of the 2016 data yielded an observed (expected) upper limit on the Higgs boson to dimuon decay of 3.0(2.5) times the SM, while combined with the 7 and 8 TeV data the observed(expected) upper limit is 2.9(2.2) times the SM expectation at 95% confidence level, as shown in Fig. 21. Assuming the SM production cross sections for a Higgs boson, the observed upper limit on the Higgs
boson branching fraction to two muons is 6.4x10⁻⁴.
0 2 4 6 8 10 3 10 × S/(S+B) weighted All categories =125 GeV H =0.7 for m
µ CMS TeV) (13 -1 35.9 fb µ µ → H Data S+B fit
1 s.d. (2 s.d.)
±
B component
110 115 120 125 130 135 140 145 150
[GeV] µ µ m 200 − 0
200 B component subtracted
S/(S+B) Weighted Events / 0.5 GeV
Figure 20. The data and weighted sum of signal-plus-background fits to each category. Events are weighted accord-ing to the expected ratio of signal to signal-plus-background in the category to which they belong [28].
120 121 122 123 124 125 126 127 128 129 130
[GeV] H m 0 1 2 3 4 5 6 7 SM σ / σ
95% CL Limit on
CMS
(13 TeV) -1 (8 TeV) + 35.9 fb -1 (7 TeV) + 19.8 fb -1 5.0 fb
Observed
Expected (background, 68% CL, 95% CL) = 125 GeV) H Expected (SM m
Figure 21. The 95% CL upper limit
on the signal strength modifier, µ, in
the region around the Higgs boson mass for the combination of the 7, 8, and 13 TeV data together with the expected limit obtained in the background only and signal-plus-background hypothesis
for the Higgs boson withmH=125 GeV
10 Higgs boson pair production
A search for Higgs boson pair production using the combined results from four final states:
bbγγ,bbττ,bbbbandbbVV, where V represents a W or Z boson, is performed by the CMS
Collaboration using the data collected in 2016 [29, 30]. The analysis of a Higgs boson self coupling represents an independent test of the SM and provides an access to the shape of the Higgs scalar field potential. It also allows searching for Higgs boson trilinear couplings by measuring the HH final state. There are heavy BSM resonances also predicted to decay to the HH final state. The non-resonant Higgs boson pair production is considered, using
the Effective Field Theory (EFT) approach with five couplings: yt,λHHH, c2, c2g andcg,
withkλ=λHHH/λS M andkt =yt/yS M defined. The resulting limits are reported in Fig. 22.
The resonant signal that is searched for is represented by either a CP-even particle of spin-0 (radion) or spin-2 (graviton) with a width that is much smaller than the detector resolution for the whole range under study. For the resonant production mechanism, the upper exclusion limits at 95% CL are obtained for the production of a narrow resonance with masses ranging from 250 to 3000 GeV.
11 Higgs boson couplings at HL-LHC
The extrapolation studies for a Higgs boson coupling combination at 3000 fb−1 have been
performed by the ATLAS and CMS Collaborations [31]. The combined minimum
negative-log-likelihoods are presented in Fig. 23. The 68% confidence intervals forkλare 0.52≤kλ≤
1.5 and 0.57≤kλ≤1.5 with and without systematic uncertainties, respectively. The second
minimum of the likelihood is excluded at 99.4% CL. In addition to Higgs BSM searches, a substantial amount of parameter space (and masses) will be covered with the physics program at HL-LHC.
SM λ
/
HHH λ
=
λ
k
20
− −15 −10 −5 0 5 10 15 20
HH) [fb]
→
(pp
σ
500 1000 1500 2000 2500 3000
3500CMS (13 TeV)
-1
35.9 fb
95% CL upper limits Observed Median expected 68% expected 95% expected
Theoretical Prediction
SM
Figure 22. The expected and the ob-served 95% CL upper limits on the HH production cross section as a function of
thekλparameter [29].
Figure 23. The minimum
negative-log-likelihood as a function ofkλ, calculated
by performing a conditional signal plus background fit to the background and SM signal [31].
12 Conclusions
The Higgs boson discovery in 2012 was a major event in high-energy physics. The properties of the Higgs boson are being characterized, in order to explore the electroweak symmetry
10 Higgs boson pair production
A search for Higgs boson pair production using the combined results from four final states:
bbγγ,bbττ,bbbbandbbVV, where V represents a W or Z boson, is performed by the CMS
Collaboration using the data collected in 2016 [29, 30]. The analysis of a Higgs boson self coupling represents an independent test of the SM and provides an access to the shape of the Higgs scalar field potential. It also allows searching for Higgs boson trilinear couplings by measuring the HH final state. There are heavy BSM resonances also predicted to decay to the HH final state. The non-resonant Higgs boson pair production is considered, using
the Effective Field Theory (EFT) approach with five couplings: yt, λHHH, c2, c2g andcg,
withkλ=λHHH/λS M andkt =yt/yS M defined. The resulting limits are reported in Fig. 22.
The resonant signal that is searched for is represented by either a CP-even particle of spin-0 (radion) or spin-2 (graviton) with a width that is much smaller than the detector resolution for the whole range under study. For the resonant production mechanism, the upper exclusion limits at 95% CL are obtained for the production of a narrow resonance with masses ranging from 250 to 3000 GeV.
11 Higgs boson couplings at HL-LHC
The extrapolation studies for a Higgs boson coupling combination at 3000 fb−1 have been
performed by the ATLAS and CMS Collaborations [31]. The combined minimum
negative-log-likelihoods are presented in Fig. 23. The 68% confidence intervals forkλare 0.52≤kλ≤
1.5 and 0.57≤kλ≤1.5 with and without systematic uncertainties, respectively. The second
minimum of the likelihood is excluded at 99.4% CL. In addition to Higgs BSM searches, a substantial amount of parameter space (and masses) will be covered with the physics program at HL-LHC.
SM λ
/
HHH λ
=
λ
k
20
− −15 −10 −5 0 5 10 15 20
HH) [fb]
→
(pp
σ
500 1000 1500 2000 2500 3000
3500CMS (13 TeV)
-1
35.9 fb
95% CL upper limits Observed Median expected 68% expected 95% expected
Theoretical Prediction
SM
Figure 22. The expected and the ob-served 95% CL upper limits on the HH production cross section as a function of
thekλparameter [29].
Figure 23. The minimum
negative-log-likelihood as a function ofkλ, calculated
by performing a conditional signal plus background fit to the background and SM signal [31].
12 Conclusions
The Higgs boson discovery in 2012 was a major event in high-energy physics. The properties of the Higgs boson are being characterized, in order to explore the electroweak symmetry
breaking mechanism in the SM. The Higgs boson mass, spin-parity and width measurement were performed with unprecedented precision. The Higgs boson was observed separately
in γγ, ZZ, WW, bb, ττ and ttH production modes. The inclusive and differential Higgs
boson production cross section measurements were performed and new approaches have been adopted, like the STXS framework. Rare Higgs boson decay channels have been studied, like the Higgs boson decay to a muon pair, to a pair of charm quarks and the Higgs boson self-coupling. No deviations from the SM prediction have been observed. At the HL-LHC a significant improvement of the measurement precision of the Higgs boson couplings is expected.
References
[1] The ATLAS Collaboration, Phys. Lett. B 716, 1 (2012). [2] The CMS Collaboration, Phys. Lett. B 716, 30 (2012). [3] The CMS Collaboration, JHEP 06 (2013) 081. [4] The CMS Collaboration, JINST 3 S08004 (2008).
[5] The CMS Collaboration, CMS-PAS-HIG-18-029 (2019), https://cds.cern.ch/record/
2667225.
[6] LHC Higgs Cross Section Working Group Collaboration, "Handbook of LHC Higgs
Cross Sections: 4. Deciphering the Nature of the Higgs Sector", doi:10.23731/
CYRM-2017-002, arXiv:1610.07922.
[7] The CMS Collaboration, JHEP 11 (2017) 047. [8] The CMS Collaboration, PRD 99 (2019) 112003. [9] The CMS Collaboration, Eur. Phys. J. C 75 (2015) 212. [10] The ATLAS Collaboration, Phys. Rev. D 90 (2014) 052004.
[11] The CMS Collaboration, CMS-PAS-HIG-19-001 (2019), https://cds.cern.ch/record/
2668684.
[12] The CMS Collaboration, PRL 120 (2018) 231801.
[13] The CMS Collaboration, CMS-PAS-HIG-18-019 (2019), http://cds.cern.ch/record/
2649199.
[14] The CMS Collaboration, CMS-PAS-HIG-18-030 (2019), https://cds.cern.ch/record/
2675023.
[15] The CMS Collaboration, PRL 121 (2018) 121801.
[16] The CMS Collaboration, CMS-PAS-HIG-18-032 (2019), https://cds.cern.ch/record/
2668685.
[17] The CMS Collaboration, CMS-PAS-HIG-18-031 (2019), https://cds.cern.ch/record/
2682638.
[18] The CMS Collaboration, Phys. Lett. B 793 (2019) 520.
[19] A. Djouadi, O. Lebedev, Y. Mambrini, and J. Quevillon, Implications of LHC searches for Higgs portal dark matter, Phys. Lett. B 709 (2012) 65.
[20] S. Baek, P. Ko, W.I. Park, and E. Senaha, Higgs portal vector dark matter: revisited, JHEP 05 (2013) 036.
[21] A. Djouadi, A. Falkowski, Y. Mambrini, and J. Quevillon, Direct detection of Higgs portal dark matter at the LHC, Eur. Phys. J. C 73 (2013) 2455.
[22] XENON Collaboration, Dark matter search results from a one ton-year exposure of XENON1T, Phys. Rev. Lett. 121 (2018) 111302.
[23] LUX Collaboration, Results from a search for dark matter in the complete LUX expo-sure, Phys. Rev. Lett. 118 (2017) 021303.
[24] PandaX-II Collaboration, Dark matter results from first 98.7 days of data from the PandaX-II experiment, Phys. Rev. Lett. 117 (2016) 121303.
[25] SuperCDMS Collaboration, New Results from the Search for Low-Mass Weakly In-teracting Massive Particles with the CDMS Low Ionization Threshold Experiment, Phys. Rev. Lett. 116 (2016) 071301.
[26] CRESST Collaboration, Results on light dark matter particles with a low-threshold CRESST-II detector, Eur. Phys. J. C 76 (2016) 25.
[27] CDEX Collaboration, Limits on light weakly interacting massive particles from the first 102.8 kg x day data of the CDEX-10 experiment, Phys. Rev. Lett. 120 (2018) 241301. [28] The CMS Collaboration, PRL 122 (2019) 021801.
[29] The CMS Collaboration, PRL 122 (2019) 121803. [30] The CMS Collaboration, Eur. Phys. J. C 79 (2019) 421.
[31] HL/HE WG2 group (Cepeda, M. et al.), Higgs Physics at the HL-LHC and HE-LHC,
![Figure 2.The results of a seven-parameter fit in the STXS framework.Cross section ratios are shown withapproximate 68% CL intervals (blackpoints), and compared to the SM expec-tations and uncertainties (blue bands)[5].](https://thumb-us.123doks.com/thumbv2/123dok_us/7989754.1326044/2.482.247.423.154.280/results-parameter-framework-withapproximate-intervals-blackpoints-compared-uncertainties.webp)

![Figure 6. The measured inclusive fidu-cial cross section in different final states[11].](https://thumb-us.123doks.com/thumbv2/123dok_us/7989754.1326044/4.482.60.184.209.330/figure-measured-inclusive-du-section-dierent-nal-states.webp)
![Figure 9. The test statistic q, describedin the text, as a function of µttH for alldecay modes at 7+8 TeV and at 13 TeV,separately, and for all the decay modesat all the system of center of mass ener-gies [12].](https://thumb-us.123doks.com/thumbv2/123dok_us/7989754.1326044/5.482.276.412.78.196/figure-statistic-describedin-function-alldecay-separately-modesat-center.webp)
![Figure 13.Best-fit value of the sig-nal strength for Higgs boson decayingto pair of bottom quarks, for the five in-dividual production modes considered,as well as the overall combined results[15].](https://thumb-us.123doks.com/thumbv2/123dok_us/7989754.1326044/6.482.58.185.295.413/figure-strength-decayingto-dividual-production-considered-combined-results.webp)


![Figure 23. The minimum negative-log-likelihood as a function of kλ, calculatedby performing a conditional signal plusbackground fit to the background andSM signal [31].](https://thumb-us.123doks.com/thumbv2/123dok_us/7989754.1326044/10.482.238.414.393.520/negative-likelihood-function-calculatedby-performing-conditional-plusbackground-background.webp)
