Compari
s
on between the KOMPSAT-1 drag derived den
s
ity and the MSISE
model den
s
ity during
s
trong
s
olar and/or geomagnetic activitie
s
J. Park1,2∗, Y.-J. Moon3, K.-H. Kim1, K.-S. Cho1, H.-D. Kim4, Y.-S. Kwak1, Y.-H. Kim1, Y.-D. Park1, and Y. Yi2
1Korea Astronomy and Space Science Institute, Hwaamdong, Yuseong-Gu, Daejeon 305-348, Korea 2Dept. of Astronomy and Space Science, Chung-nam National University, Daejeon 305-764, Korea
3Department of Astronomy and Space Science, Kyung Hee University, Yongin 446-701, Korea 4Korea Aerospace Research Institute, Daejon 305-333, Korea
(Received June 25, 2007; Revised November 12, 2007; Accepted December 23, 2007; Online published July 4, 2008)
We have compared the KOrea Multi-Purpose SATellite-1 (KOMPSAT-1) drag derived density with the MSISE
model (NRLMSISE-00 and MSISE-90) density during strong solar and/or geomagnetic activities. It is well known that there are twomajormechanisms to induce satellite drag caused by atmospheric density enhancement: the heating by solar EUV radiation and joule heating associated with local geomagnetic current enhancements during geomagnetic storms. For this work we select five events dominated by the radiation effect and/or the geomagnetic effect. For these events we compared the satellite drag derived density with the MSISE model density. Themajor results can be summarized as follows. (1) The density predicted fromthe MSISEmodels during radiation dominated periods are comparable to the drag derived density but the MSISE model density during strong geomagnetic storms is significantly underestimated when the MSISEmodel density is compared to the drag derived density, by about two times for the NRLMSISE-00model. (2) The ratios of the KOMPSAT-1 (around 685 km) drag derived density to the MSISE model density during a strong geomagnetic stormare abruptly enhanced (up to a factor of about 8 for the MSISE-90model and about 3 for the NRLMSISE-00model), which aremuch larger than previous estimates from low altitude (around 400 km) satellites. (3) There is a possible correlation between daily drag enhancement and daily Dst variation. We note that there is a remarkable difference in daily drag enhancement although solar and geomagnetic activities are quite similar to each other. We suggest that such a difference should be explained by the accumulation of solar radiation effect depending on solar activity cycle.
Key words:Satellite drag, drag derived density, MSISE-90, NRLMSISE-00, LEO.
1.
Introduction
It is well known that extreme space environments caused by solar activity cause great effects on satellites in several different ways. Among several effects, we focus on satel-lite drag caused by the density enhancement of the neutral atmosphere. There are twomajor physical processes to en-hance the neutral atmosphere density: (1) the heating by solar extreme ultra-violet (EUV) radiation, and (2) joule heating associated with local current enhancements during geomagnetic storms. The increased density of the neutral atmosphere is directly proportional to the drag experienced by a low earth orbit (LEO) satellite and the increased drag can, in amatter of tens ofminutes to hours, significantly affect satellite orbit parameters (Tobiska, 2002).
The drag acceleration equation of the satellite orbit is given by:
aD= 1 2CD
A MρV
2
r , (1)
∗Now at the Department of Physics, University of New Hampshire,
Durham, NH 03824, U.S.A.
Copyright cThe Society of Geomagnetismand Earth, Planetary and Space Sci-ences (SGEPSS); The Seismological Society of Japan; The Volcanological Society of Japan; The Geodetic Society of Japan; The Japanese Society for Planetary Sci-ences; TERRAPUB.
whereaDis the drag acceleration in a direction opposite to the velocity vector,CDis the drag coefficient, Ais the effec-tive satellite cross sectional area perpendicular to the direc-tion ofmotion,M is the satellitemass,ρis the atmospheric density, andVris the orbital velocity (Knowleset al., 2001; Montenbruck and Gill, 2001; Marcos and Wise, 2002). If one knows the satellite parameters and drag coefficient, the density of the upper atmosphere can be determined by the orbit information of satellite.
Recently, the density of the upper atmosphere of the Earth has been accurately derived by satellites with high
resolution accelerometers, for instance, CHAMP and
GRACE. These kinds of works have demonstrated that the Mass-Spectrometer-Incoherent-Scatter (MSIS) model un-derestimates the atmospheric density during the geom ag-netic storms in comparison of the drag derived density (Liu et al., 2005; Liu and L¨uhr, 2005; Burkeet al., 2007). Ac-cording to Liuet al.(2005), a comparison between observa-tions and the MSISE-90model predictions showed that al-though themodel described the general structure of the ob-served density reasonably well, itmissed the double peaks at low latitudes completely. This caused an underestimation of the totalmass density by about∼20% in the crest region. At high latitudes an underestimation of∼30% occurred in themidnight sector and the cusp region. They also
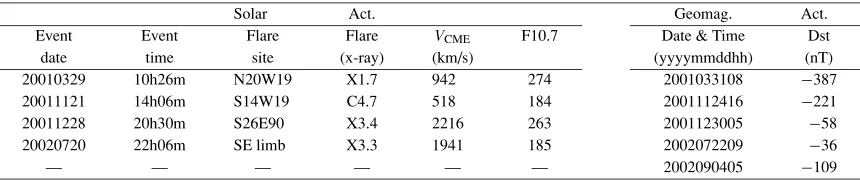
Table 1. Strong solar and/or geomagnetic events used in our analysis.
Solar Act. Geomag. Act.
Event Event Flare Flare VCME F10.7 Date & Time Dst
date time site (x-ray) (km/s) (yyyymmddhh) (nT)
20010329 10h26m N20W19 X1.7 942 274 2001033108 −387
20011121 14h06m S14W19 C4.7 518 184 2001112416 −221
20011228 20h30m S26E90 X3.4 2216 263 2001123005 −58
20020720 22h06m SE limb X3.3 1941 185 2002072209 −36
— — — — — — 2002090405 −109
gated the strong enhancements of the upper thermospheric totalmass density during three geomagnetic superstorms in 2003 by using the CHAMP satellite. Liu and L¨uhr (2005) showed that the MSISE-90model was unable to reproduce
most of the observed features of these three storms and the density was underestimated by themodel at all latitudes ex-cept for the southern polar regions at the night-side. Burke et al. (2007) compared thermospheric densities predicted by the NRLMSISE-00model with those inferred from ac-celerometermeasurements by the GRACE satellite during twomagnetic stormperiods in 2004. They reported that the
model significantly under-predicted densities during storms although predictions andmeasurements were in substantial agreements during quiet times. These recent works dem on-strate that the MSISEmodels are not successful for predict-ing transient storm-time disturbances.
In this study, we use the drag derived density fromthe KOrea Multi-Purpose SATellite-1 (KOMPSAT-1), which
was launched on December 21, 1999 into a
Sun-synchronous circular orbit with an inclination of 98◦ and an altitude of∼685 km(Kimet al., 2004). Recently, Kim
et al. (2006) showed that there is one-to-one correspon-dence between the KOMPSAT-1 drag acceleration and
geo-magnetic storms: drag acceleration strongly correlates with the level of geomagnetic storms. We present the com par-ison between the drag derived density of the KOMPSAT-1 satellite and the MSISEmodels such as MSISE-90 and NRLMSISE-00.
Our main interest is summarized as follows. First, as wementioned before, there are twomain origins of satel-lite drag: solar radiation effect and joule heating associated with geomagnetic storms. We want to examine the depen-dence of both effects using five events whose solar and/or geomagnetic activities were strong. Second, the altitude of KOMPSAT-1 is about 685 km, which ismuch higher than those of previous satellites (e.g.,∼400 kmfor CHAMP and
∼500 kmfor GRACE) that have been studied so far. We want to examine the difference between the density from
CHAMP and GRACE whose altitudes are about 400 km
and the density fromKOMPSAT-1 at amuch higher alti-tude. Third, we investigate the relationship between the daily drag enhancement and daily Dst variation for five events and then compare our results with those for the 10 events used by Kimet al.(2006). Then we discuss what
makes a remarkable difference in daily drag enhancement even though solar and geomagnetic activities of two events are nearly similar to each other. The paper is organized as follows. The data analysis is described in Section 2. We present results and discussions in Section 3. A brief sum
-mary and conclusion are delivered in Section 4.
2.
Data Analy
s
i
s
For the present work, we select five events character-ized by strong solar and/or geomagnetic activities. Their basic information is summarized in Table 1. For all these events, there were very strong X-class flares and/or severe geomagnetic storms. The flare information is taken from
the NGDC flare list∗1 and the CME information fromthe
SOHO/LASCO CME online catalogue∗2. We use the daily
F10.7 index∗3provided at Space Environment Center. This index has been used as a conventional proxy to represent solar EUV radiation (Donnellyet al., 1983). The Dst (Dis-turbance storm time) index indicates the enhancement of ring currents by geomagnetic storms and is taken fromthe World Data Center for Geomagnetism∗4.
One of themost important space weather applications is a routine estimation of upper atmospheric drag for precise determination of orbits for satellites in LEO (Nicholas et al., 2000). Drag on LEO satellites is the largest source of error in orbit determination, primarily because of the inac-curacy of upper atmosphericmass density estimates (Mar-cos et al., 1998). Using the drag acceleration equation given by Eq. (1), we derive the totalmass density of the upper atmosphere. In this estimation, we use the average
mass of KOMPSAT-1 of 448 kg, the average cross-section of 5.871m2, and the velocity of 7.5 km/s for 685 km alti-tude. According to Knowleset al.(2001), the drag coeffi-cientCDvaries with the flow regime, and is approximately 2.2 for a perfect sphere with the freemolecular flow regime. Since KOMPSAT-1 has a shape of hexagon and an average drag coefficient estimated fromits long termoperation from
2000 to 2002 is around 2.2 (Kimet al., 2004), we assume thatCDis 2.2.
The orbit determination of KOMPSAT-1 is carried out twice (09:00 and 21:00 UT, 18:00 and 06:00 KST) a day using onboard GPS (Global Positioning System) navigation solution data and its accuracy is estimated to be about 1.6m
when general acceleration is considered during the period of low solar activity (Kimet al., 2004). The drag-derived density that we use is an average along the satellite path. In this study, we use the 12-hour average drag acceleration data deduced fromthe change of a semi-major axis, which
∗1(ftp://ftp.ngdc.noaa.gov/STP/SOLAR DATA/SOLAR FLARES/XRAY
FLARES).
∗2(http://cdaw.gsfc.nasa.gov/CME list/index.html).
∗3(http://www.sec.noaa.gov/ftpmenu/indices/old indices.html).
is determined using an orbit determination program(Kimet al., 2004) based on GPS navigation solution data.
The MSISEmodels such as MSISE-90 and
NRLMSISE-00 describe the neutral temperature and densities in the upper atmosphere (above 100 km). The data sources of MSISE-90model includemeasurements fromseveral rock-ets, satellites and incoherent scatter radars (Hedin, 1987, 1991) and the data sources of NRLSMSISE-00 also include totalmass density fromsatellite accelerometers as well as orbit determination (Piconeet al., 2002). In this study, we use the MSISE-90model which is available at the online web site∗5 and the NRLMSISE-00 model which is taken fromthe Space Physics Models page of the Goddard Space Flight Center∗6. According to Piconeet al.(2002), the new
model, NRLMSISE-00, handles spatial and temporal vari-ability somewhat better than the MSISE-90model at ele-vated geomagnetic activity.
The MSISEmodels require several input parameters such as input year, day of year, universal time, altitude, geodetic latitude and longitude, local apparent solar time, solar F10.7 flux (for previous day and three-month average), and
geo-magnetic Ap index (daily or Ap history for the last 59h). The position data (latitude and longitude) of the satellite are also used as input parameters of the model. The ge-omagnetic 3 hour ap index is used for the MSISEmodels fromthe World Data Center for Geomagnetism∗7. With the above input parameters, themodels produce the following output parameters: number density of He, O, N2, O2, Ar, H and N, totalmass density, neutral temperature, and exo-spheric temperature (Hedin, 1987, 1991). Themodels are computed every six hours (03:00, 09:00, 15:00, 21:00 UT) and then its running average for three values is taken every twelve hours (09:00 and 21:00 UT) for comparison.
3.
Re
s
ult and Di
s
cu
ss
ion
For five events in Table 1, we have compared the drag derived density from KOMPSAT-1 with the density from
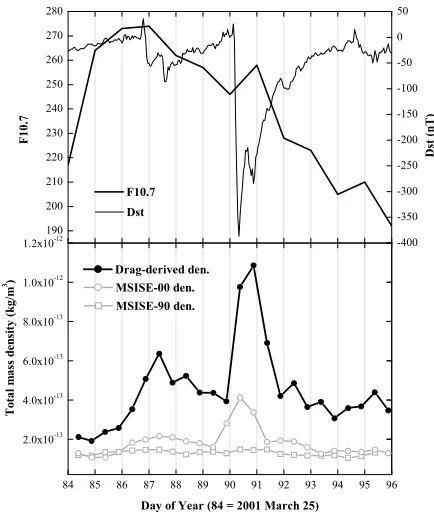
the MSISEmodels. Figures 1 and 2 show two cases: the first case is the 2001 March 29 event for which the
geo-magnetic stormeffect was quite significant relative to the solar radiation effect and the second case is the 2002 July 20 event for which the radiation effect was dominant. As shown in Table 1, the 2001 March 29 event has not only an X-class flare which enhanced the EUV radiation char-acterized by F10.7 increase, but also a strong geomagnetic stormwith Dst= −387 nT. The drag derived density grad-ually increases fromDOY 85, which seems to be caused by the increase of F10.7, and then has a localmaximum
around DOY 87, which is coincident with an intermediate geomagnetic storm. There is a very strong enhancement around DOY 90, which is well consistent with the abrupt decrease of Dst index. As shown in the figure, the varia-tions of drag derived density and Dst have quite similar pat-terns, implying that the drag derived density ismostly rep-resented by the variation of Dst value. While the MSISE-90model does not account for the density enhancement at
∗5(http://modelweb.gsfc.nasa.gov/atmos/msise.html).
∗6(http://modelweb.gsfc.nasa.gov/atmos/nrlmsise00.html).
∗7(http://swdcwww.kugi.kyoto-u.ac.jp).
Fig. 1. F10.7 (thick solid line) and Dst (thin solid line) indices fromMarch 25 (DOY 84) to April 5, 2001 (top). Comparison between the drag derived density (filled circle) and the density fromthe NRLMSISE-00 model (gray open circle) and the density fromthe MSISE-90model (gray open square) for 2001 March 29 event (bottom).
all, the NRLMSISE-00model gives about three times en-hancement, which is still underestimated tomatch the drag derived density by a factor of about 3. Burkeet al.(2007) reported that the NRLMSISE-00model under-predicted the density from GRACE accelerometer during geomagnetic storms by a factor of 1.5 (for details, see their Fig. 2). Ac-cording to Liu and L¨uhr (2005), the drag derived density fromCHAMP (∼400 kmaltitude) is about 5 times higher than that fromthe MSISE-90model at high geomagnetic latitudes during a strong geomagnetic storm. In our case, the ratio of drag derived density to the MSISE-90 model density is up to 8 during the 2001 March 29 event which has the strongest geomagnetic stormamong our samples.
For the 2002 July 20 event, there is no geomagnetic storm. Figure 2 shows that the drag derived density and MSISE model density are comparable to each other and their patterns are quite similar. These facts demonstrate that the MSISEmodels well reflect the variation of atm o-spheric density caused by solar EUV radiation. The F10.7 index gradually increases with time and its variation is quite similar to that of the KOMPSAT-1 drag derived density. A cross-correlation between the F10.7 index and the drag de-rived density has a maximum(r = 0.92) at 1-day time delay, which is consistent with Jacchia et al.(1973) who found a lag of approximately 1 day between solar activity and atmospheric densities derived fromthe drag of 10 satel-lites in the interval 1958–1971. Our results fromboth cases (Figs. 1 and 2) show that the MSISEmodels do not properly account for the density enhancement caused by strong
Fig. 2. F10.7 (thick solid line) and Dst (thin solid line) indices fromJuly 17 (DOY 198) to 30, 2002 (top). Comparison between the drag derived density (filled circle) and the NRLMSISE-00model (gray open circle) and the density fromthe MSISE-90model (gray open square) for 2002 July 20 event (bottom).
Liu and L¨uhr, 2005; Burkeet al., 2007) for low altitudes (around 400 km). However, we note that the density from
the NRLMSISE-00 agrees better with the drag derived one than that fromthe MSISE-90model at the high altitude dur-ing strong geomagnetic storms. Regarding this issue, our results support an argument that the current atmospheric
models are statistical and do not allow a short-term predic-tion for a given altitude (Koskinenet al., 2001).
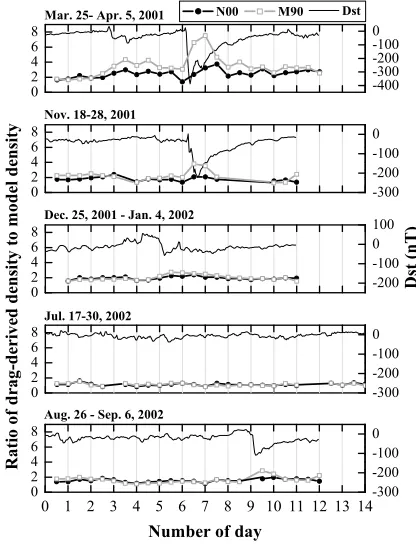
Figure 3 shows the ratio of the drag derived density to the MSISEmodel density as a function of day for all five events summarized in Table 1. The 2001 November 21 event that was associated with a weak C-class flare, produced a strong geomagnetic storm (−221 nT). The 2001 December 28 event has a very strong X3.4 flare and a relatively large value (263) of F10.7 index. It produced a weak geom ag-netic storm(−58 nT). In the case of the 2002 September 4 event, there was only amoderate geomagnetic storm(Dst
= −109 nT). A detailed investigation of solar wind data (not shown here) shows that this event seems to be associ-ated with corotating interaction regions (CIRs) caused by high speed stream(Mullan, 1984). For these five events, we found a couple of interesting results as follows. (1) The ratio between the drag derived density and NRLMSISE-00 is quite similar to that between the drag derived density and the MSISE-90model during non-stormtimes but obviously smaller during geomagnetic storms. As shown in the top panel of Fig. 3, while the ratio of the drag derived density and the MSISE-90model is 7.5 during a strong geom ag-netic storm, the ratio between the drag derived density and NRLMSISE-00 is 3.2. We found a tendency that the bigger the storm, the higher the ratio. (2) The ratios during
non-Fig. 3. Ratio of the drag derived density to the NRLMSISE-00 density (filled circle) and to the MSISE-90 density (open square) as a function of day with Dst index (thin solid line) for five events.
stormtimes slightly increase with long-termsolar activity. While two events (20020720 and 20020904) in 2002 have the two lowest ratios (about 1.2 on the fourth day), which are thought to be probably the background values during non-stormtimes, the other three events in 2001 have larger background values (around 2). Table 2 summarizes the ra-tio of the drag derived density to the MSISEmodel density fromprevious publications and the present study. The com -parison shows that the ratio generally increases with
geo-magnetic stormstrength and altitude. It is not so clear to argue the dependence of the ratio on F10.7. For example, a comparison between the 20010328 and 20011230 events in Table 2 shows that both ratios of 20010328 are about 1.5 times larger than those of 20011230 even though solar and geomagnetic indices are nearly the same. This difference
may be explained by other effects such as long-termsolar radiation effect.
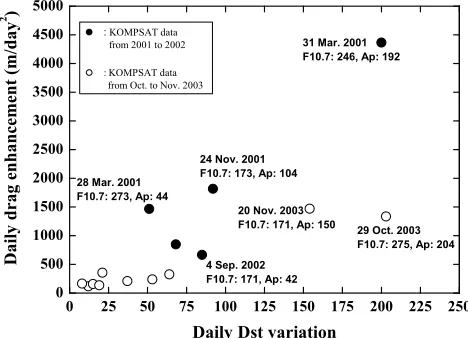
For a quantitative comparison of the tendency, we com -pare the daily Dst variation with the daily drag
enhance-ment for five events in Fig. 4. In addition, we include the
KOMPSAT-1 drag data (open circle) during threemonth
period including the Halloween event (October–December, 2003). During the period, there were two very strong
Table 2. Summary of the comparison between the drag derived density (ρd) to the MSISEmodeladensity (ρ
m) for eight geomagnetic storms, which are taken fromprevious publications and the present study.
Date F10.7 Dst Satellite Height Modela ρd/ρ
m Reference
19830724 136 −74 nT SETA ∼200 km M90 1.5 Forbeset al.(1996)
20031120 175 −472 nT CHAMP ∼400 km M90 5.0 Liu and L¨uhr (2005)
20041108 124 −373 nT GRACE ∼350 km N00 1.5 Burkeet al.(2007)
20010331 246 −387 nT KOMPSAT-1 ∼695 km M90/N00 7.5/3.2 This study
20010328 274 −56 nT KOMPSAT-1 ∼695 km M90/N00 4.3/3.0 This study
20011124 173 −221 nT KOMPSAT-1 ∼693 km M90/N00 3.8/2.1 This study
20011230 247 −58 nT KOMPSAT-1 ∼690 km M90/N00 2.7/2.3 This study
20020904 171 −109 nT KOMPSAT-1 ∼685 km M90/N00 2.9/1.8 This study
aM90, MSISE-90; N00, NRLMSISE-00.
Fig. 4. Comparison of the daily Dst variation and the daily drag enhance-ment. Both quantities correspond to the absolute difference between the perturbed and the background. Filled circles indicate the KOMPSAT-1 data from2001 to 2002 and open circles represent those used by Kim
et al.(2006), respectively. F10.7 and Ap index for several strong events are shown to indicate howmuch there were strong solar and geomag-netic activities.
we note that there is a remarkable difference in daily drag
enhancement between the 2001 March 29 event and the
2003 October 29 event. In these two cases, F10.7, Dst, and Ap index are all quite similar to each other so that wemay expect similar drag enhancements. However, the drag en-hancement of the first event is about three times larger than that of the second event. This fact implies that there should be another important factor to control the satellite drag. As a possible factor, we suggest the accumulation effect of so-lar EUV radiation. Figure 5 shows the long-termvariation of F10.7 index of these two events for one year. It is noted that the solar EUV radiation in 2001 is remarkably higher than that in 2003. This fact implies that the neutral atm o-sphere in 2001 be alreadymore expanded relative to that in 2003 due to long termsolar radiation effect.
4.
Summary and Conclu
s
ion
In this study, we have compared the drag derived den-sity from the KOMPSAT-1 satellite with the empirical
MSISEmodels such as NRLMSISE-00 and MSISE-90
dur-ing strong solar and/or geomagnetic activities. Themajor results can be summarized as follows. (1) The density pre-dicted fromthe MSISEmodels are similar to the drag
de-Fig. 5. Long-termvariation of F10.7 index for two events (2001 March 29 and 2003 October 29). The solid line starts fromOct. 2000 and the dashed line fromMay 2003. The vertical line indicates the event days on which strong geomagnetic storms occurred.
rived density during the radiation dominated periods. How-ever, the density fromthe MSISEmodels is significantly un-derestimated when compared to the drag derived density, by about two times for the NRLMSISE-00model depending on solar activity. (2) The ratios of the KOMPSAT-1 (around 685 km) drag derived density to the MSISEmodel density during a strong geomagnetic stormare abruptly enhanced, for example, up to a factor of about 8 for the MSISE-90
model and about 3 for the NRLMSISE-00model. These
values aremuch larger than previous estimates (e.g., Liuet al., 2005; Liu and L¨uhr, 2005; Burkeet al., 2007) fromlow altitude (around 400 km) satellites. (3) There is a rem ark-able difference in daily drag enhancement although solar and geomagnetic activities are quite similar. Such a differ-ence may be explained by the accumulation of long-term
solar radiation effect.
It was found fromthe first and second results that the MSISEmodels do not properly reflect the variation of atm o-spheric density during the strong geomagnetic storms. As
ina-tion (Piconeet al., 2002). The MSISEmodels use several input parameters such as input year, day of year, univer-sal time, altitude, latitude, longitude, local apparent solar time, solar F10.7 flux, and geomagnetic Ap index. To be a successful empiricalmodel, there should be enough ob-served data to show the dependence on each variable. How-ever, a geomagnetic stormintermittently occurred during a relatively short period (several hours to a few days) so that it is difficult to have enough data for given each differ-ent input variable. In another aspect, themodelmay not reflect the density variation at high altitudes because the study of satellite drag in this position has not been lim -ited. According to Hedin (1987), the data become very sparse in the exosphere about 600 kmand upward extrap-olations are expected to become increasingly inaccurate at higher altitudes. Although the NRLMSISE-00 database in-clude a new component, “anomalous oxygen”, with appre-ciable O+ and hot atomic oxygen contributions to the total
mass density at high altitudes larger than 500 km(Piconeet al., 2002), the NRLMSISE-00model is still underestimated when compared to the drag derived density. We also note fromthe third result that the long-termsolar radiation effect is not properly included in the MSISEmodels. According to Hedin (1983), the remaining area of poorest data cover-age at satellite altitudes is at high latitudes for high solar activity. Fromthe present study, we found the importance of the combination effect between long-termsolar radiation effect and geomagnetic effect as shown in Figs. 4 and 5. A further detailed examination is desirable for improving the atmosphericmodels as well.
To improve an empirical atmosphericmodel, we have a few suggestions as follows. First, there should be sufficient satellite drag data covering different input variables and dif-ferent solar cycles. Especially, the present study shows that high altitude LEO satellite data and long-termradiation ef-fect are important to improve themodel. Second, we should try to find a better input parameter for themodel. Regard-ing this issue, Burkeet al. (2007) showed from GRACE observations that polar cap potential led the drag derived density fromGRACE satellite by∼4 hours during storm -time. Third, we needmore detailed comparisons between the drag derived density and empiricalmodels. In this re-spect, the GRACE and CHAMP data are invaluable in that theymake it possible to directly estimate the drag derived density using accelerometer. Finally we briefly discuss the limitation of the present study. We used the KOMPSAT-1 satellite drag acceleration data based on the GPS data with twelve hours time resolutions. Even though our data have two disadvantages (measurementmethod and time resolu-tion) over CHAMP and GRACE data, our results are con-sistent with recent results and also give us several important implications on the improvement of empirical atmospheric
models such as MSISE.
Acknowledgments. We really appreciate the referees’
construc-tive comments. We are very thankful to Drs Thomson, Burke and Liu for their helpful discussions. This work has been supported by the MOST grants (M1-0104-00-0059 and M1-0407-00-0001),
the Korea Research Foundation (KRF-2005-070-C00059), and the KASI (Korea Astronomy and Space Science Institute) basic re-search fund of the Korean government.
References
Burke, W. J., C. Y. Huang, F. A. Marcos, and J. O. Wise, Interplanetary Contral of Thermospheric Densities during Large Magnetic Storms,J. Atmos. Solar-Terr. Phys.,69, 279–287, 2007.
Donnelly, R. F., D. F. Heath, J. L. Lean, and G. J. Rottman, Differences in the temporal variations of solar UV flux, 10.7-cmsolar radio flux, sunspot number, and Ca-K plage data caused by solar rotation and active region evolution,J. Geophys. Res.,88, 9883–9888, 1983.
Forbes, J. M., R. Gonzalez, F. A. Marcos, D. Revelle, and H. Parish, Magnetic stormresponse of lower thermosphere density,J. Geophys. Res.,101, 2313–2320, 1996.
Hedin, A. E., A revised thermosphericmodel based onmass Spectrometer and incoherent scatter data: MSIS-83, J. Geophys. Res.,88, 10170– 10188, 1983.
Hedin, A. E., MSIS-86 thermosphericmodel,J. Geophys. Res.,92, 4649– 4662, 1987.
Hedin, A. E., Extension of the MSIS thermospheremodel into themiddle and lower atmosphere,J. Geophys. Res.,96, 1159–1172, 1991. Jacchia, L. G., J. W. Slowley, and I. G. Campbell, An analysis of the
solar-activity effects in the upper atmosphere,Planet. Space Sci.,21, 1835– 1842, 1973.
Kim, H.-D., E.-K. Kim, and H.-J. Choi, Orbit determination for the KOMPSAT-1 Spacecraft during the period of the solarmaximum,KSAS International Journal,6, 71–84, 2004.
Kim, K.-H., Y.-J. Moon, K.-S. Cho, H.-D. Kim, and J.-Y. Park, Atmo-spheric drag effects on the KOMPSAT-1 satellite during geomagnetic superstorms,Earth Planets Space,58, e25–e28, 2006.
Knowles, S. H., J. M. Picone, S. E. Thonnard, and A. C. Nicholas, The Effect of Atmospheric Drag on Satellite Orbits During the Bastille Day Event,Solar Physics,204, 387–397, 2001.
Koskinen, H., E. Tanskanen, R. Pirjola, A. Pulkkinen, C. Dyer, D. Rodgers, P. Cannon, J.-C. Mandeville, and D. Boscher,Space weather effects catalogue, ESA Space Weather Study in pressed, 2001.
Liu, H. and H. L¨uhr, Strong disturbance of the upper thermospheric density due tomagnetic storms: CHAMP observations,J. Geophys. Res.,110, CiteID A09S29, doi:10.1029/2004JA010908, 2005.
Liu, H., H. L¨uhr, V. Henize, and W. K¨ohler, Global distribution of the thermospheric totalmass density derived fromCHAMP,J. Geophys. Res.,110, CiteID A04301, doi:10.1029/2004JA010741, 2005. Marcos, F. A. and J. O. Wise, Towards a golden age of satellite drag,AIAA
Aerospace Sciences Meeting and Exhibit, 40th, Reno, NV, Jan. 14–17, AIAA-2002-92, 2002.
Marcos, F. A., M. J. Kendra, J. M. Griffen, J. N. Bass, D. R. Larson, and J. F. Lui, Precision Low Earth Orbit Determination Using Atmospheric Density Calibration,Advances in the Astronautical Sciences,97, 501– 513, 1998.
Montenbruck, O. and E. Gill,Satellite orbits: Models, methods, and appli-cations, 83 pp., Springer Press., Berlin, 2001.
Mullan, D. J., Corotating interaction regions in stellar winds,Astrophysical Journal,283, 303–312, 1984.
Nicholas, A. C., J. M. Picone, S. E. Thonnard, R. R. Meier, K. F. Dymond, and D. P. Drob, Amethodology for using optimal MSIS parameters retrieved fromSSULI data to compute satellite drag on LEO objects,
J. Atmos. Solar-Terr. Phys.,62, 1317–1326, 2000.
Picone, J. M., A. E. Hedin, D. P. Drob, and A. C. Aikin, NRLMSISE-00 empirical model of the atmosphere: Statistical comparisons and scientific issues, J. Geophys. Res., 107, CiteID 1468, doi:10. 1029/2002JA009430, 2002.
Tobiska, W. K., E10.7 Use for Global Atmospheric Density Forecasting in 2001,AIAA/AAS Astrodynamics Specialist Conference and Exhibit, Monterey, California, Aug. 5–8, AIAA-2002-4892, 2002.