© 2017, IJCSMC All Rights Reserved
301
Available Online atwww.ijcsmc.comInternational Journal of Computer Science and Mobile Computing
A Monthly Journal of Computer Science and Information Technology
ISSN 2320–088X
IMPACT FACTOR: 6.017IJCSMC, Vol. 6, Issue. 5, May 2017, pg.301 – 307
Student Academic Performance Prediction using
Machine Learning and Data Mining Techniques
Chandini Lulla
1, Yash Agarwal
2, Snehal Kankariya
3, Prateek Sakaray
4, Pankaja Alappanavar
5¹Department of Information Technology, Pune University, Sinhgad Academy of Engineering, India ²Department of Information Technology, Pune University, Sinhgad Academy of Engineering, India ³Department of Information Technology, Pune University, Sinhgad Academy of Engineering, India
4
Department of Information Technology, Pune University, Sinhgad Academy of Engineering, India
5
Department of Information Technology, Pune University, Sinhgad Academy of Engineering, India
1
[email protected]; 2 [email protected]; 3 [email protected]; 4 [email protected]; 5 [email protected]
Abstract— This Educational Data Mining is an emerging discipline, concerned with developing methods for exploring the unique and increasingly large-scale data that come from various educational sources, and using those methods to better understand students, and the environments which they learn in. This work was based upon the results of an evaluation process applied over data mining techniques, in order to find the most adequate ones to extract classification rules from final-year students’ academic performance. As a result of this, the formulation of a predictive model for academic performance was presented and the model whose construction was achieved by analysing, selecting and defining the classification rules using ID3 (Iterative Dichotomizer 3) algorithm. This algorithm selected the attributes for classification rules for predicting the academic performance of final-year engineering students, at Sinhgad Academy of Engineering (S.A.E). The attributes in these rules were taken from the past records of the students who have been studying at S.A.E. Thes e attributes also predicted the students’ results which were classified into four categories i.e. Poor, Average, Good and Excellent. This data predictive system also provided insights to our institute regarding various factors which led to the poor performance of the students.
Keywords—Machine Learning, Data Mining, Iterative Dichotomizer 3, Entropy, Information Gain
I. INTRODUCTION
Machine learning, which is a subtype of computer science, provides computers, the ability to learn without being explicitly programmed. Machine learning focuses on the development of computer programs that can teach themselves to grow and change when exposed to new data.
The process of machine learning is similar to that of data mining. Both the systems look for various patterns present in the data. However, instead of extracting data for human comprehension, machine learning uses that data to detect patterns in data and adjust the functionality of the programs accordingly.
Data mining is a computational process of discovering patterns in large data sets. This system involves methods at the intersection of artificial intelligence, machine learning, statistics, and database systems. The overall goal of the data mining process is to extract information from a data set and transform it into an understandable structure for further use. Besides, it involves database and data management aspects, data pre-processing, post-processing of discovered structures, etc.
A. The System Developed
© 2017, IJCSMC All Rights Reserved
302
etc.[2]) were the key factors in prediction and the classification of the results. The main task of this tool was to analyse the overall performance of our institute as to how well are the students doing and what can be done to improve their performances so that the overall performance of the institute improves[1]. Also, the students, themselves could check their individual performances and get a detailed analysis of the factors, they’re lagging in. This analysis of the overall institute and individual students helped the concerned authorities to find out the various changes, they need to make, so as to bring out the best from the students.
II. LITERATURE SURVEY
The authors, Xin Chen, Mihaela Vorvoreanu and Krishna Madhavan proposed students’ informal conversation on social media into their educational experiences to perform analysis. They included various factors which affect student performance like too much stress, depression, lack of sleep, too much homework, lack of social interaction etc. [3]. The researchers’ went through an exploratory process to locate the relevant data and twitter hash tags. They collected 25,284 tweets using hash tag #engineering Problems over a period of 14 months resulting in 19,799 unique n accurate tweets using data pre-processing [3]. They performed inductive content analysis on dataset. The Algorithm used was Multi label Naive Bayes Classification. Hence, from this paper we inferred that a similar concept of predicting students’ academic performances could be proposed [3].
The authors, Fabio Pagnotta and Hossain Amran, made use of BI (Business Intelligence) and ML (Machine Learning) techniques. They took the dataset of two Portugal secondary schools with two different Sources: marks and questionnaires. Two algorithms used were: Decision Tree and Random Forest [2].The questionnaire contained 37 questions which tested on 788 students. KNIME analytics Platform as a tool to perform analysis which builds work flows. They selected attributes like gender, address, school, mothers and fathers’ education, study time, internet, free time and travel time etc. Performed analysis using Weka tool. Cross validation was used for elimination and to test data using random forest. X-Aggregator was used to build prediction table and error rates from cross validation. Thus, we selected the attributes for our system with the reference of this paper [2].
The authors, SuchitaBorkar and K.Rajeswari, used artificial neural network to check accuracy of the results and a multi-layer Perceptron Neural Network for selection of features using 10-fold cross validation and also used K-means clustering. It had a dataset of 3047 records. Build CHAID prediction model to identify weak students and attributes affection their performance. Also, it used Weka tool which uses ARFF file as external representation format. Apriori Algorithm (Back-propagation algorithm) [1]. Finally, the classification of the attributes into various categories and finding out the end results was done with the reference of this paper [1].
A. Existing System
There is no such system that exists in our institute, somehow only the manual analysis of results is done to compute the pass and fail students. So that’s why we built a model that could predict students’ overall academic performance and could give them suggestions accordingly.
III. SYSTEM ARCHITECTURE
© 2017, IJCSMC All Rights Reserved
303
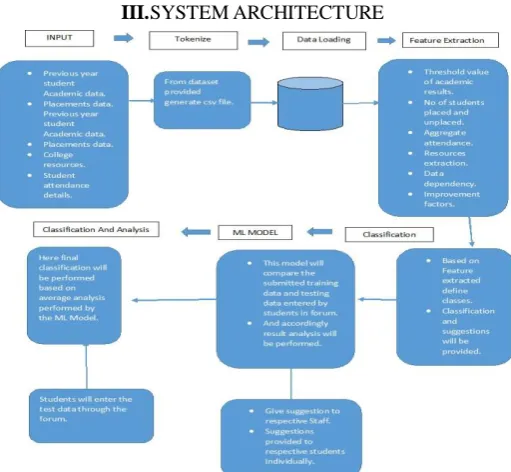
The system architecture shows the schematic flow of how the system worked.A. Data Gathering
The very first step was gathering of data. Since, our system focused on developing a predictive tool for our institute, we gathered the previous 2 to 5 years pass out students’ data of various departments. The collected data, included attendance records of students, result analysis, placement data, AMCAT and QALR scores etc.
The input to the system was in two formats. The first input given to the system was the data collected and the second input was the data entered manually by individual students through the forum created or the Graphical User Interface (GUI).
B. Pre-processing
The second step was tokenisation where the input data from the dataset was converted into comma separated-values that stored the data in a tabular form. The third step was data loading. The database used for our system was a MySQL Database. Once the data had been loaded into the database, the loaded data was thus pre-processed. In pre-processing, the necessary features were extracted from the raw dataset. The features included aggregate results, attendance, family background, study hours, placement data, GDPI sessions, STP sessions, internships, QALR results, AMCAT results, backlogs, co-curricular activities, and paid classes. The raw data which was in the continuous form was converted into the discrete form by applying threshold values i.e. if the aggregate result was above 66% then the value assigned to it was FCD. Similarly, if the aggregate result were in the ranges of 60 to 65.99%, 55 to 59.99%, 50 to 54.99%, then the threshold values assigned were FC, HSC and SC respectively. Further, based on the features extracted classes were defined.
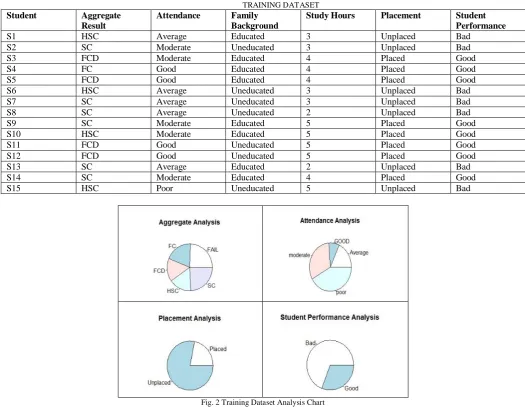
TABLE I TRAINING DATASET
Student Aggregate Result
Attendance Family Background
Study Hours Placement Student Performance
S1 HSC Average Educated 3 Unplaced Bad
S2 SC Moderate Uneducated 3 Unplaced Bad
S3 FCD Moderate Educated 4 Placed Good
S4 FC Good Educated 4 Placed Good
S5 FCD Good Educated 4 Placed Good
S6 HSC Average Uneducated 3 Unplaced Bad
S7 SC Average Uneducated 3 Unplaced Bad
S8 SC Average Uneducated 2 Unplaced Bad
S9 SC Moderate Educated 5 Placed Good
S10 HSC Moderate Educated 5 Placed Good
S11 FCD Good Uneducated 5 Placed Good
S12 FCD Good Uneducated 5 Placed Good
S13 SC Average Educated 2 Unplaced Bad
S14 SC Moderate Educated 4 Placed Good
S15 HSC Poor Uneducated 5 Unplaced Bad
© 2017, IJCSMC All Rights Reserved
304
Fig. 2 shows the graphical representation of the pre-processed data for the first module of the dataset. This graph shows the accurate analysis in terms of the present significance of each attribute in the dataset. Pre-processing eliminated the irrelevant part of the raw dataset. In pre-processing the data which was gathered from our institute, was in excel format. It was converted into discrete form and then was again stored in a new excel sheet which was the output of processing. Outputs from the pre-processing involved excel entries which are shown in Table I.
C. Classification and Analysis
The algorithm used for the system was the ID3 algorithm. Once classification was over, the machine learning model was constructed. The model compared the training dataset provided, with the unknown test data, entered by individual students through the forum.
Thus, the final classification and analysis of the system was performed.The classifier built, classified the student performance whether good or bad, based on various attributes like placement, academic results, sessions required and attendance comparing the input entered.An overall monthly institute performance and suggestion was provided to the Admin in the form of a notification message. Also, individual student level analysis was performed and was given to the students in diagrammatic representation.
IV. ID3 ALGORITHM
A. Iterative Dichotomizer 3
In our system, the algorithm we used was the ID3 algorithm i.e. Iterative Dichotomizer 3 Algorithm. ID3 is a decision tree algorithm that is used for the classification of objects using iterative inductive approach. It’s basically used to construct decision trees that consist of the top nodes, known as the root nodes and the other adjoining nodes, known as the leaf nodes. Traversing of these trees is done by employing Top-down (Root-leaf), Greedy approach. Each node in the tree required some tests on the attribute, according to which the level of the node was determined. Hence, the primary purpose of decision trees is decision making so as to what will be the primary factor for classification of the objects and what will be its adjoining secondary factors[4]-[6].
B. Entropy
Entropy is a measure of how ordered or disordered a system is. In technical terms, entropy is a measure of how certain or uncertain the value of a random variable is (or will be). Entropy is given by the formula: -
Fig. 3 Entropy Formula Entropy(S) = S –p (I) log2 p (I)
Where,
p (I) is the proportion of S belonging to class I.
S is over c.
Log2 is log base 2.
C. Information Gain
Information Gain measures how well a given attribute separates training examples into targeted classes. The one with the highest information (information being the most useful for classification) is selected. In order to define gain, we first borrow an idea from information theory called entropy. Entropy measures the amount of information in an attribute. The classes created by ID3 are inductive, that is, given a small set of training instances, the specific classes created by ID3 are expected to work for all future instances.
D. ID3 Implementation
Once we pre-processed the data, and converted the values of all the attributes into discrete values, the actual implementation of the ID3 algorithm started. We considered multi-classification of the data into 3 decision trees namely, the Placement Tree, the Sessions required tree and the Institute Results Tress. We then selected the Placement Tree first (since our system mainly focuses on the Placement attribute) and calculated its overall entropy, since ID3 starts with the calculation of entropy. Hence, the entropy was calculated as follows:
The overall entropy =
© 2017, IJCSMC All Rights Reserved
305
=> - [P (GOOD) log2 (P (GOOD)) - P (BAD) log2 (P (BAD))] = - [(8/15) log2 (8/15) - (7/15) log2 (7/15)] = 0.3Once the overall entropy was calculated, the Information Gain of all the attributes was calculated and the root node of the tree was determined. The information gain of the attributes was calculated as follows:
Consider the first attribute, Aggregate Results. For calculating the information gain, we needed the entropies of its attribute values (FCD, FC, and HSC, SC). Therefore, the entropies of these attribute values were as follows:
Entropy (FCD) = 0.0 Entropy (FC) = 0.0 Entropy (HSC) = 0.19 Entropy (FCD) = 0.14
Once the entropies were obtained, the information gain of Aggregate Results was calculated as follows:
Gain (S, Agg) = Entropy (S) – [Entropy (FCD) - Entropy (FC) - Entropy (HSC) - Entropy (SC)]
=>Gain (S, Agg) = 0.3 – [0-0-0.19-0.14] = 0.63
Similarly, the Information Gains of all the other attributes were calculated as follows:
Gain (S, Att) = 0.51 Gain (S, FaB) = 0.35 Gain (S, StHr) = 0.51 Gain (S, Pla) = 0.355
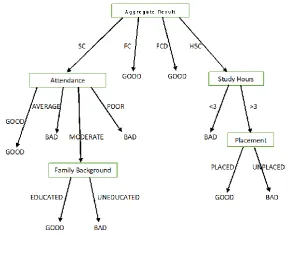
Hence, according to the information gains of the attributes, the Placement Decision Tree was constructed.
Fig. 4 Decision Tree
© 2017, IJCSMC All Rights Reserved
306
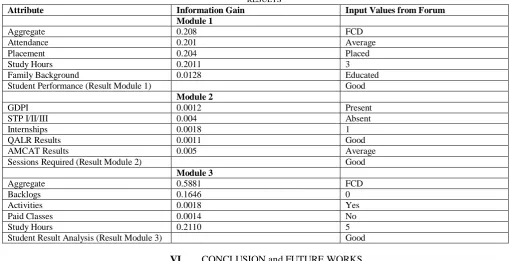
V. EXPERIMENTAL RESULTS/SUMMARYThe generated results, included3 different aspects: 1.Pre-processed data analysis, 2.Information gain generated by the system for each attribute in the input dataset, and 3.ID3 Classification results based on the given entries fetched from the forum. The first and the second part of the results included 3 modules on which the data analysis results were generated by the system whereas in the third part, all the 3 modules’ results were mapped by the system and according to the data filled by the user, generated the virtual ID3 tree which classified the data and stored it into the database. Hence the concept of generating 3 different trees and mapping of those 3 results to a classifier algorithm to classify the incoming new data was used.
Once the classification of the entries entered by the user, had been done, the system calculated the overall percentage of the users for the individual user as well as for the admin for improving the overall performance of the college and taking preventive measures to increase the growth rate of the placements for the respective college.
TABLE II RESULTS
Attribute Information Gain Input Values from Forum Module 1
Aggregate 0.208 FCD
Attendance 0.201 Average
Placement 0.204 Placed
Study Hours 0.2011 3
Family Background 0.0128 Educated
Student Performance (Result Module 1) Good
Module 2
GDPI 0.0012 Present
STP I/II/III 0.004 Absent
Internships 0.0018 1
QALR Results 0.0011 Good
AMCAT Results 0.005 Average
Sessions Required (Result Module 2) Good
Module 3
Aggregate 0.5881 FCD
Backlogs 0.1646 0
Activities 0.0018 Yes
Paid Classes 0.0014 No
Study Hours 0.2110 5
Student Result Analysis (Result Module 3) Good
VI. CONCLUSION and FUTURE WORKS
Education is a crucial element in our society. Data Mining (DM) and Machine Learning techniques, allow a high level extraction of knowledge from raw data, over interesting possibilities for the education domain.
In this system, we addressed the analysis, prediction and appropriate classification of the academic performances of the current final year students by using past college records, demographic, family and other data related to student placements, study hours etc. Therefore, our system will be highly beneficial to our institute.
Also, our system can be extended to not only the colleges that come under the Sinhgad Technical Education Society (STES) but all the colleges and institutes that come under the Savitribai Phule Pune University (SPPU). Along with the suggestions to academic performances, our system can be advanced to the co-curricular and the extra-curricular activities as well, which will help the students to not only excel in academics but become masters of all.
ACKNOWLEDGEMENTS
We take this opportunity to thank all the people involved in making this project a success. We want to especially thank our respected internal guide, Ms. Pankaja Alappanavar for her guidance and encouragement, which has helped us to achieve our goal. Her valuable advice has helped us throughout the phase. Our Head of Department Prof. Abhay Adapanawar has also been very helpful and we are grateful for the support he provided us with. Last but not the least we would like to convey our gratitude to all the teaching and non-teaching staff members of Information technology, our friends and families for their valuable suggestions and support.
R
EFERENCES
[1] SuchitaBorkar and K.Rajeswari, “Attributes Selection for Predicting Students”, International Journal of Computer Applications (0975 – 8887), Volume 86 – No 10, January 2014.
© 2017, IJCSMC All Rights Reserved
307
[3] Xin Chen, Mihaela Vorvoreanu and Krishna Madhavan, “Mining Social Media Data for Understanding Student’s Learning Experiences”.
[4] Rupali Bhardwaj, Sonia Vatta, “Implementation of ID3 Algorithm”, CSE, Bahra University.
[5] Wei Peng, Juhua Chen and Haiping Zhou, “An Implementation of ID3 --- Decision Tree Learning Algorithm”, University of New South Wales, School of Computer Science & Engineering.