Scholarship@Western
Scholarship@Western
Electronic Thesis and Dissertation Repository
9-20-2019 10:30 AM
An integrated framework to assess compound flood risks for
An integrated framework to assess compound flood risks for
interdependent critical infrastructure in a coastal environment
interdependent critical infrastructure in a coastal environment
Ying Zhang
The University of Western Ontario
Supervisor
Najafi, Mohammad Reza
The University of Western Ontario
Graduate Program in Civil and Environmental Engineering
A thesis submitted in partial fulfillment of the requirements for the degree in Master of Engineering Science
© Ying Zhang 2019
Follow this and additional works at: https://ir.lib.uwo.ca/etd
Part of the Environmental Engineering Commons
Recommended Citation Recommended Citation
Zhang, Ying, "An integrated framework to assess compound flood risks for interdependent critical infrastructure in a coastal environment" (2019). Electronic Thesis and Dissertation Repository. 6560. https://ir.lib.uwo.ca/etd/6560
This Dissertation/Thesis is brought to you for free and open access by Scholarship@Western. It has been accepted for inclusion in Electronic Thesis and Dissertation Repository by an authorized administrator of
ii
Abstract
Compound flooding refers to flood events caused by multiple factors, including marine processes
(e.g. storm tides and waves), hydrometeorological signals (e.g. rainfall and river flows) among
others. Saint Lucia is a tropical island in eastern Caribbean Sea, which is frequently affected by
weather-related extreme events such as tropical storms and the associated risks are exacerbated
due to its mountainous topography and high concentrations of infrastructure and human
communities close to the coast. At the southern coast of Saint Lucia, significant infrastructures
such as Hewanorra International Airport and Vieux Fort Seaport, and human settlements such as
towns of Vieux Fort and La Tourney are located at low-lying areas and are at risk of compound
flooding. A hydrologic model (i.e. HYdrological MODel) and a two-dimensional hydrodynamic
model (i.e. LISFLOOD-FP) are set up and calibrated to investigate the combined effects of storm
tides, wave run-up, rainfall, and river flows on flood risks in Saint Lucia. Results indicate the
necessity to consider multiple contributing factors as well as to characterize the effects of uncertain
boundary conditions. In flood-prone areas, there are infrastructures supporting major services in
the study area, and by extension, the economy of the Island. A network-based model, which
considers direct and indirect connections between infrastructures, is set up to explore risks of assets
in conditions of non-flooding and flooding. Modelling results reveal the fundamental importance
of various components including electricity distribution, flood control, information and
communication services, transportation, housing and human settlements, tourism, and particularly
the normal operations of Hewanorra International Airport. Prioritization of risks is critical for
developing effective mitigation methods for infrastructure networks.
Keywords
Compound Flooding, Hydrologic Model, Hydrodynamic Model, HYMOD, LISFLOOD-FP,
iii
Lay Summary
Compound flooding has multiple contributing factors, including marine processes (e.g. storm tides
and waves) and hydrometeorological signals (e.g. rainfall and river flows). They can interact with
each other and generate more severe flooding, which has not been recognized until recent years.
The study area is located at the southern coast of Saint Lucia, which is highly exposed to hurricanes
and tropical storms, such as Hurricane Dean in 2007, Hurricane Tomas in 2010, and Hurricane
Matthew in 2016. The compound flooding risks are exacerbated due to the mountainous
topography and high concentrations of infrastructures and human communities. The most
important infrastructure is Hewanorra International Airport, whose failures in several extreme
events severely impacted local and international transportation as well as the local economy. Other
assets that support major services in the study area and the economy of the island include Vieux
Fort Seaport as well as the towns of Vieux Fort and La Tourney. They are interdependent and the
failure of one asset in flooding can propagate through the network, leading to failures of other
assets and more severe consequences. To understand compound flooding and its associated risks
in the study area, a hydrological model (i.e. HYdrological MODel) and a two-dimensional
hydrodynamic model (i.e. LISFLOOD-FP) are set up and calibrated to investigate the combined
effects of storm tides, wave run-up, rainfall, and river flows on flood risks in the study area. A
network-based risk analysis model is set up to explore risks of interdependent assets. Results
indicate that it is important to consider multiple factors in flood analysis. Hewanorra International
Airport has the fundamental significance in the study area, along with other high-risk assets in
flooding such as electricity distribution, flood control, information and communication services,
transportation, housing and human settlements, and tourism. This study provides insights of
iv
Acknowledgments
First of all, I would like to express my sincere gratitude to my thesis supervisor Dr. Mohammad
Reza Najafi, who believed in my potential and offered me the valuable opportunity to work with
him two years ago. I am always encouraged to gain new skills and knowledge under his guidance.
It was a wonderful journey, and I am thankful for all his support in my research.
I am grateful for my parents, who always believed in me and supported my decisions. I would not
have come to Canada and pursued my research interest without your love and encouragement.
Thank you for being with me and providing advices when I face challenges.
I would like to thank Deep Logic Solutions Inc., particularly Nick Martyn, Alec Hay, Charles
Chamberlain, Jeff Farnworth, and Rory Kilburn, for providing topography data, holding a 3-day
workshop on RiskLogik platform at Western University, providing initial RiskLogik setup for the
study region, as well as answering my questions regarding the platform and data. This project was
funded by an NSERC CRD grant. Also, thanks to Hahn Chul Jung from NASA for his suggestions
on processing the Sentinel-1 imagery. My thesis project would not have been completed without
the help and support from those people.
I would also like to thank my examination committee members, Dr. Slobodan Simonovic, Dr.
Hassan Peerhossaini, and Dr. Katsu Goda, for taking time to review this dissertation and giving
valuable suggestions.
Last but not least, I am grateful for my friends, who have made my life full of laughter, and for my
v
Table of Contents
Abstract ... ii
Lay Summary ... iii
Acknowledgments ... iv
Table of Contents ... v
List of Tables ... viii
List of Figures ... xi
Chapter 1 ... 1
1 Thesis Overview ... 1
1.1 Background ... 1
1.2 Research Objectives ... 2
1.3 Research Questions ... 2
1.4 Summary of Chapters ... 3
1.5 References ... 4
Chapter 2 ... 5
2 Background Literature ... 5
2.1 Compound Flooding ... 5
2.2 Two-dimensional Hydrodynamic Modelling ... 7
2.3 Flood Risk Assessment of Critical Infrastructure ... 10
2.4 References ... 14
Chapter 3 ... 22
3. Analysis of Compound Flooding in Saint Lucia ... 22
3.1. Introduction ... 22
vi
3.3.1. Input Data for the Hydrodynamic Model ... 31
3.3.2. Hydrologic Modelling ... 41
3.3.3. Observational Data... 52
3.3.4. Hydrodynamic Modelling ... 58
3.4. Results and Discussions ... 72
3.4.1. Model Performance and Validation ... 72
3.4.2. Sensitivity Analysis ... 76
3.4.3. Scenario Analysis... 87
3.4.4. Probabilistic Flood Hazard Analysis ... 96
3.5. Conclusions ... 100
3.6. References ... 102
Chapter 4 ... 112
4 Flood Risk Analysis in Saint Lucia ... 112
4.1 Introduction ... 112
4.2 Methodology ... 115
4.2.1 Terminology ... 115
4.2.2 Scoring Systems ... 117
4.2.3 Analytical Tools ... 120
4.3 Model Setup ... 123
4.4 Results and Discussions ... 165
4.4.1 Risk Assessment under Normal Condition ... 165
4.4.2 Risk Assessment under Flood Scenarios ... 169
4.5 Conclusions ... 181
vii
5 Concluding Remarks and Future Work ... 185
References ... 188
viii
List of Tables
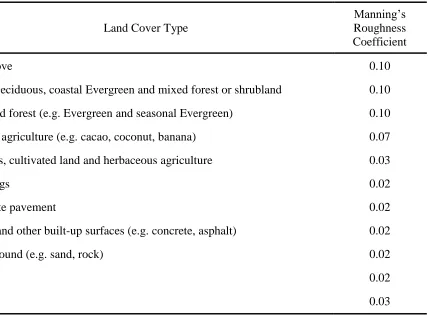
Table 1. Manning's roughness coefficients for different land cover types. ... 32
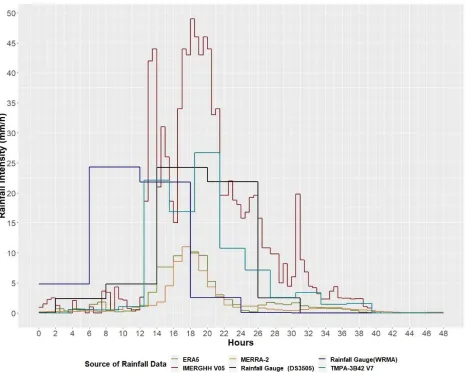
Table 2. Characteristics of rainfall data derived from different sources during the event of Tropical
Storm Matthew... 34
Table 3. The mean sea level and observed peak water levels in the event of Tropical Storm
Matthew for each tide gauge, extreme sea levels in Monioudi et al. (2018), and the rescaling factors
calculated for each tide gauge. ... 39
Table 4. Surges and wave run-up heights in different return periods for Vieux Fort, Saint Lucia.
... 41
Table 5. Descriptions and the feasible ranges of HYMOD parameters. ... 42
Table 6. Monthly mean rainfall calculated from observed records at the rainfall gauge operated by
WRMA in Saint Lucia, monthly mean rainfall calculated from the raw TMPA-3B42 V7 rainfall
data, and the derived monthly bias factors... 44
Table 7. Performance of the bias correction conducted to TMPA-3B42 V7 product. ... 45
Table 8. Runoff estimations obtained from the calibrated HYMOD model and the associated
uncertainty bounds. ... 50
Table 9. Runoff estimations of the calibrated HYMOD model when using rainfall inputs derived
from different sources. ... 51
Table 10. Information of the Pléiades-1 imageries ... 53
Table 11. Information of all utilized Sentinel-1A images in the study. ... 54
Table 12. Characteristics of input data for the LISFLOOD-FP model in model validation and
ix
including wave run-up. ... 68
Table 14. Descriptions of boundary conditions used for the LISFLOOD-FP model in the probabilistic flood hazard analysis... 72
Table 15. Characteristics of rainfall derived from different sources and corresponding flood inundation estimations. ... 83
Table 16. Flood area estimations when considering the uncertainties in coastal water levels. .... 84
Table 17. Flood area estimations when considering the uncertainties in river flow estimations associated with the selection of model parameters. ... 85
Table 18. Flood area estimations when considering the uncertainties in upstream river inflows associated with the sources of rainfall data used in the HYMOD model. ... 86
Table 19. Flood area estimations in scenarios of excluding wave up and including wave run-up in the coastal boundary conditions. ... 88
Table 20. Flood area estimations in scenarios of excluding wave up and including wave run-up in the coastal boundary conditions. ... 91
Table 21. Flood area estimations in scenarios of excluding wave up and including wave run-up in the coastal boundary conditions ... 94
Table 22. Defined terminology in Strongest Path Method. ... 116
Table 23. Operational status of an entity. ... 118
Table 24. Criteria used for assigning the Likelihood of Failure of an entity. ... 119
Table 25. Criteria used for assigning the Degree of Impact of an entity. ... 119
x
Table 28. Pre-defined parameters values in the model setup. ... 134
xi
List of Figures
Figure 1. The topography map and the geographic location of Saint Lucia (Sources: Esri,
DigitalGlobe, GeoEye, i-cubed, USDA FSA, USGS, AEX, Getmapping, Aerogrid, IGN, IGP,
swisstopo, and the GIS User Community; National Geographic, Esri, DeLorme, HERE,
UNEP-WCMC, USGS, NASA, ESA, METI, NRCAN, GEBCO, NOAA, iPC; Esri, GEBCO, NOAA,
National Geographic, DeLorme, HERE, Geonames.org, and other contributors; Saint Lucia Digital
Elevation Model that is downloaded from http://www.charim-geonode.net/layers/geonode:dem).
... 25
Figure 2. The drainage basin and study area (Sources: Saint Lucia Digital Elevation Model
downloaded from http://www.charim-geonode.net/layers/geonode:dem; Saint Lucia river
networks downloaded from http://www.charim-geonode.net/layers/geonode:rivers; Map data ©
OpenStreetMap contributors, Map layer by Esri). ... 29
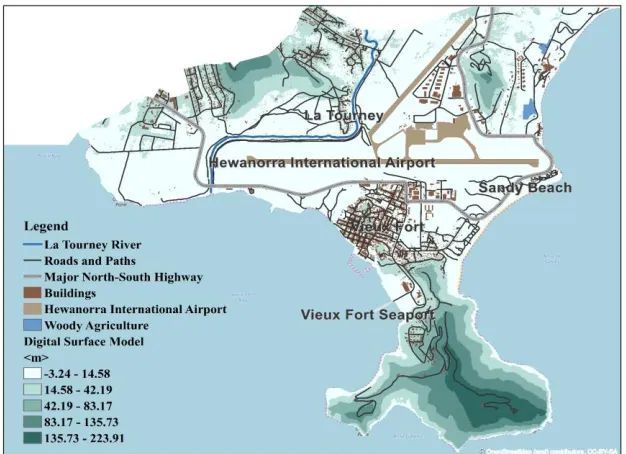
Figure 3. Map showing the topographic characteristics of the study area (Sources: Map data ©
OpenStreetMap contributors, Map layer by Esri; Saint Lucia Topographic Map downloaded from
http://www.charim-geonode.net/maps/217; Digital Surface Model provided by Deep Logic
Solutions Inc.). ... 29
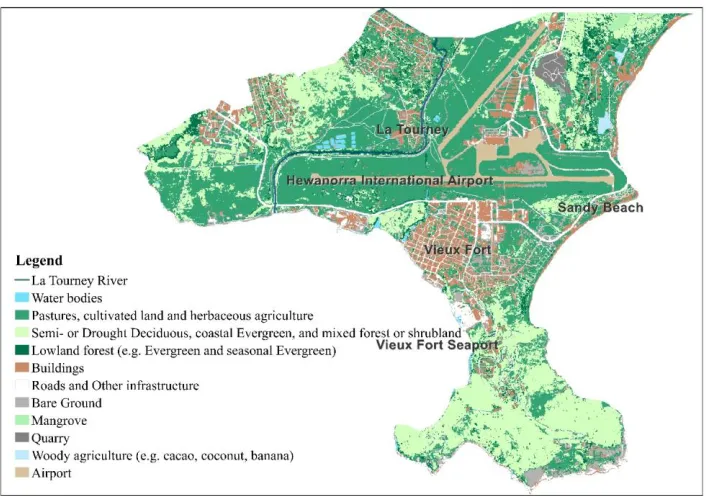
Figure 4. Land cover map of the study area (Sources: Saint Lucia 2014 Land Cover Map
downloaded from http://www.charim-geonode.net/layers/geonode:landcover_2014_improved1).
... 30
Figure 5. Time series of hourly or half-hourly rainfall intensities derived from different sources
during the simulated period (from 00:00 am AST on September 28, 2016 to 00:00 am AST on
September 30, 2016)). ... 35
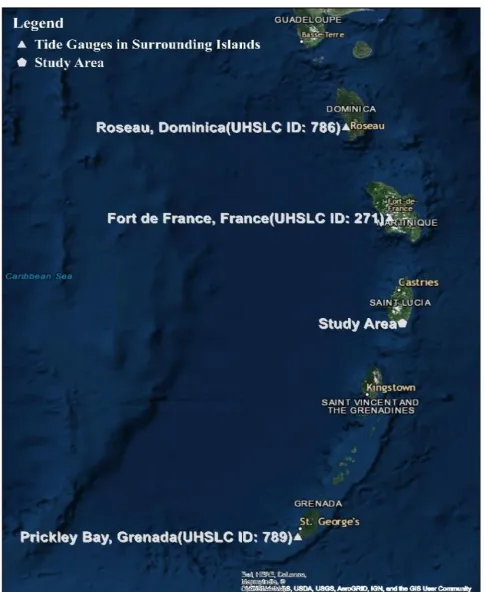
Figure 6. Locations of utilized tide gauges in surrounding islands (Sources: Esri, DigitalGlobe,
GeoEye, i-cubed, USDA FSA, USGS, AEX, Getmapping, Aerogrid, IGN, IGP, swisstopo, and the
xii
observed time series of tide gauges, and the dotted grey lines (a) are the scaled water levels based
on the rescaling factors. Observed and rescaled time series are all used to calculate the mean and the standard deviation (σ) of water levels for each hour. Derived time series based on the mean and σ, represented as colored lines in (b), are used as boundary conditions for LISFLOOD-FP. 38
Figure 8. Time series of coastal water levels used in the scenario analysis when excluding and
including the heights of wave run-up... 41
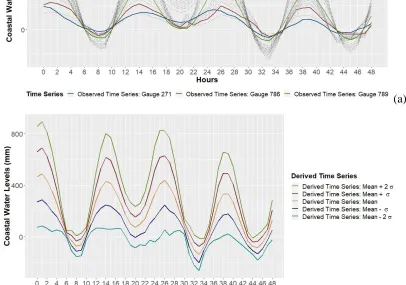
Figure 9. Simulated streamflow and observed streamflow at the watershed outlet (a) from 1998 to
2018, and (b) from 2010 to 2016. Red dots correspond to the observed streamflow records, and
the black line indicates the daily runoff estimates from the HYMOD model (i.e. the mean out of
all simulations that utilize the 1000 derived parameter sets). The light grey shaded area denotes
the 95% hydrograph prediction uncertainty associated with selection of parameter sets derived
using the SCE-UA algorithm. Green dots are estimated runoff for the event. ... 49
Figure 10. The Pléiades-1 pre-event (left) and post-event (right) imageries (Copyright PLEIADES
© CNES 2016, Distribution Airbus DS). ... 52
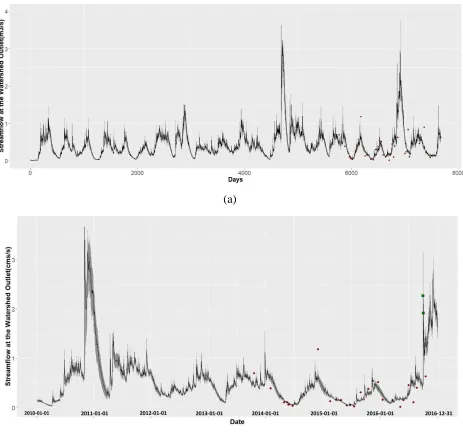
Figure 11. Workflow used to derive flood extent from the SAR imagery. ... 55
Figure 12. The flood map that is generated based on the combination of flood area derived from
the Pléiades-1 and Sentinel-1 imagery. ... 57
Figure 13. Example channel shapes. ... 59
Figure 14. Map showing the maximum flood depth for each pixel over the course of the simulation
R0 in the event of Tropical Storm Matthew. ... 73
Figure 15. Map showing the maximum flood depth for each pixel over the course of th simulation
R0 in the event of Tropical Storm Matthew within boundaries of Hewanorra International Airport.
... 74
Figure 16. Comparison of the maximum flood extent from the model and flood extents derived
xiii
R1 in the event of Tropical Storm Matthew. ... 77
Figure 18. Map showing the maximum flood depth for each pixel over the course of the simulation
R2 (left) and simulation R3 (right) in the event of Tropical Storm Matthew. ... 78
Figure 19. Map showing the maximum flood depth for each pixel over the course of the simulation
R4 (left) and simulation R5 (right) in the event of Tropical Storm Matthew. ... 79
Figure 20. Maps showing the maximum flood depth for each pixel over the course of simulations
when the rainfall input is derived from (a) rainfall gauge (WRMA), (b) rainfall gauge (DS3505),
(c) ERA5, (d) MERRA-2, (e) TMPA-3B42 V7, and (f) IMERGHH V05. ... 81
Figure 21. Graphs showing the flood inundation area over the course of simulations when the
rainfall input is from (a) rainfall gauge (WRMA), (b) rainfall gauge (DS3505), (c) ERA5, (d)
MERRA-2, (e) TMPA-3B42 V7, and (f) IMERGHH V05. ... 82
Figure 22. Map showing the maximum flood depth for each pixel over the course of simulations
in scenarios of including wave run-up in the coastal boundary conditions. ... 89
Figure 23. Maps showing the maximum flood depth for each pixel within the Hewanorra
International Airport boundary over the course of simulations when the heights of wave run-up are
(a) 2.5m, (b) 3.5m, (c) 4.5m, (d) 5.5m, and (e) 6m. ... 90
Figure 24. Maps showing the maximum flood depth for each pixel within the Hewanorra
International Airport boundary over the course of simulations when the heights of wave run-up are
(a) 0m, (b) 0.5m, (c) 1.5m, (d) 2.5m, (e) 3.5m, (f) 4.5m, (g) 5.5m, and (h) 6m. ... 93
Figure 25. Maps showing the maximum flood depth for each pixel over the course of simulations
when the heights of wave run-up are (a) 0m, (b) 0.5m, (c) 1.5m, (d) 2.5m, (e) 3.5m, (f) 4.5m, (g)
5.5m, and (h) 6m. ... 96
Figure 26. Maximum flood inundation area over the course of simulations in the probabilistic flood
xiv
Figure 28. Map showing the probability of flooding calculated from all simulations for each pixel
in the study area. ... 99
Figure 29. Map showing the probability of flooding calculated from all simulations for each pixel
within the Hewanorra International Airport. ... 99
Figure 30. The directed graph set up in the RiskLogik software. ... 133
Figure 31. Risk indices of each entity in the non-flood condition: (a) global vulnerability and global
impact; (b) risk index. ... 166
Figure 32. Risk indices of entities that are at high/very high/extreme risk in the non-flood
condition: (a) global vulnerability and global impact; (b) risk index. ... 167
Figure 33. Results of the Monte Carlo analysis in the non-flood condition. ... 169
Figure 34. Map showing the flood conditions when flood extents reach the maximum value over
the course of the simulation R0 in the event of Tropical Storm Matthew within the boundary of
Hewanorra International Airport. ... 170
Figure 35. Risk indices of each entity in flood conditions when not considering the effects of wave
run-up: (a) global vulnerability and global impact; (b) risk index... 171
Figure 36. Risk indices of entities that are at high/very high/extreme risk in flood conditions when
not considering effects of wave run-up: (a) global vulnerability and global impact; (b) risk index.
... 172
Figure 37. Results of the Monte Carlo analysis in flood conditions when not considering the effects
of wave run-up. ... 173
Figure 38. Maps showing the maximum flood depth of each pixel within the airport boundary
xv
of wave run-up: (a) global vulnerability and global impact; (b) risk index. ... 176
Figure 40. Risk indices of entities that are at high/very high/extreme risk in the first scenario of
flooding when considering the effects of wave run-up: (a) global vulnerability and global impact;
(b) risk index. ... 177
Figure 41. Results of the Monte Carlo analysis in the first scenario of flooding when considering
the effects of wave run-up... 178
Figure 42. Results of the Monte Carlo analysis in the second scenario of flooding when considering
the effects of wave run-up... 178
Figure 43. Risk indices of each entity in the second scenario of flooding when considering the
effects of wave run-up: (a) global vulnerability and global impact; (b) risk index. ... 179
Figure 44. Risk indices of entities that are at high/very high/extreme risk in the second scenario of
flooding when considering the effects of wave run-up: (a) global vulnerability and global impact;
(b) risk index. ... 180
Figure 45. Risk index of entities that are at extreme/very high/high risk in each scenario. ... 182
Chapter 1
1
Thesis Overview
1.1
Background
Saint Lucia, a volcanic island in eastern Caribbean Sea, is located in the tropical cyclone belts and
therefore highly exposed to multiple natural disasters such as storm surges, rogue waves, as well
as heavy rainfall associated with tropical storms (ICF GHK, 2012). Compound flooding is
expected in those weather-related extreme events when there are simultaneous occurrences of high
river flows, high sea levels, and extreme rainfall. Resultant damage can be disastrous due to the
mountainous topography cut by fast-flowing water drainage networks, as well as the high
concentration of human settlements and significant infrastructure at the confined coastal lowlands
in Saint Lucia (Global Facility for Disaster Reduction and Recovery, 2019; ICF GHK, 2012;
United Nations Conference on Trade and Development, 2017).
Historical events have revealed the high vulnerability of critical infrastructure in Saint Lucia to
flooding and landslides. For example, damages in the infrastructure sector account for 43% of the
total impact caused by Hurricane Tomas in 2010 and 78.75% of the total impact resulted from a
tropical trough system in 2013. Infrastructure along with other vulnerable sectors, such as
agriculture and tourism, are key economic sectors in Saint Lucia. Major assets in those sectors do
not function individually but are interdependent to ensure their normal activities and operations.
For example, when Hewanorra International Airport was closed in several extreme events, arrivals
and departures of visitors were greatly disrupted, accordingly affecting the tourism industry.
Although the failures of assets and the propagation of failures through the infrastructure networks
have caused huge economic losses in Saint Lucia, there are no existing high-resolution
hydrodynamic models set up to simulate compound flooding, and no network analysis models set
1.2
Research Objectives
The overall objective of this study is to combine a hydrodynamic model with a risk assessment
platform to evaluate compound flood risks to critical infrastructure. The first objective is to set up
and calibrate a hydrologic and a hydrodynamic model using available (sparse) ground-based data,
reanalysis products, and satellite imagery. The second objective is to characterize the individual
and combined contributions of storm tides, wave run-up, heavy rainfall, and river overflows to
flooding. The third objective is to identify direct connections between major assets in key
economic sectors and to set up a network analysis model for evaluating the effects of indirect
connections as well as prioritizing risks of assets in the system. The study area, bounded by the
coastline, is at the southern coast of Saint Lucia. Major assets pertaining to key economic sectors,
including Hewanorra International Airport (HIA), Vieux Fort Seaport, the town of Vieux Fort and
La Tourney, coastal agricultural lands, as well as the main north-south highway, are located at
low-lying areas and vulnerable to compound floods caused by heavy rainfall, high sea levels, and
river overflows in the La Tourney river. We study flood risks to HIA as a critical infrastructure.
1.3
Research Questions
Following are the research questions addressed in the study.
(1) How to address problems associated with data availability for the hydrologic and hydraulic
model setup?
(2) How important is it to consider the combined effects of multiple flood factors?
(3) How to characterize compound flood events and the contribution of individual flood factors?
(4) How to account for uncertainties in hydrologic and hydraulic modelling?
(5) How to combine a hydrodynamic model with a risk assessment platform to analyze flood risks
to critical infrastructure?
(7) How to determine the relative importance of interdependent assets in different sectors and
prioritize risks under the conditions of non-flooding and flooding?
1.4
Summary of Chapters
This thesis consists of three main chapters. Chapter 2 is the background literature that provides an
overview of previous works in the analysis of compound flooding and in the flood risk assessment
for interdependent infrastructures. In the perspective of compound flooding, this chapter covers its
definition, interactions between its different contributing factors, as well as current frameworks,
progress, and limitations in its analysis. In the perspective of risk analysis, this chapters provides
the definition of risk, the definition of interdependent infrastructure and the impacts of its
interdependency by giving a real-world example, as well as current frameworks for the flood risk
analysis of critical infrastructure.
Chapter 3 introduces the study area and explains the reasons why it is at high risk of compound
flooding particularly in the changing climate. Historical extreme events have revealed the high
vulnerability of major assets in the study area to flooding and landslides. Detailed information is
subsequently given on the analysis of compound flooding in this study, including data collection,
preparations of boundary conditions, the hydrologic and hydrodynamic model setup, model
validation, sensitivity analysis to explore the effects of uncertain boundary conditions, scenario
analysis to account for the effects of wave run-up, as well as the probabilistic flood hazard analysis
to derive a probabilistic flood hazard map. Simulation results of flood extents and flood depths are
analyzed in this chapter and used in Chapter 4 for risk assessment.
Chapter 4 provides a review of several historical extreme events and their significant impacts on
critical infrastructure. Interdependency of infrastructure will be defined. The framework used for
the risk assessment in this study is clarified. Based on the Strong Path Method theory, the
RiskLogik software was utilized to set up a network analysis model in order to explore the effects
of direct and indirect connections among interdependent entities. The relative importance of
entities was determined for scenarios of non-flooding and flooding, providing valuable insights on
1.5
References
Global Facility for Disaster Reduction and Recovery. (2019). Saint Lucia. Retrieved from https://www.gfdrr.org/en/saint-lucia
ICF GHK. (2012). Climate Change Adaptation Planning in Latin American and Caribbean Cities Complete Report: Castries, Saint Lucia Retrieved from
http://www.worldbank.org/content/dam/Worldbank/document/LAC/Climate%20Change %20Adaptation%20Planning%20for%20Castries_FINAL.pdf
Chapter 2
2
Background Literature
2.1
Compound Flooding
Coastal regions are at risk of flooding caused by a combination of multiple factors including heavy
precipitation, high river discharge rates and river overflows, as well as storm surges and waves
generated by strong winds (Doocy et al. 2013; Kew et al. 2013; Wahl et al. 2015). This risk, which
is significant particularly in low-lying densely-populated coastal environments, is projected to
increase due to climate change, urbanization, population growth and expanded development
(Brown et al. 2013; Condon and Sheng 2012; Creel 2003; Frazier et al. 2010; Intergovernmental
Panel on Climate Change 2014; Kundzewicz et al. 2014).
Compound flooding can be defined as flooding caused by “the combined effects of marine and hydrologic processes” (Gallien et al. 2018). This definition indicates that the analysis of compound
floods should consider both oceanic effects, such as waves and storm tides (the combination of
astronomical tide and storm surge), and hydrologic signals, such as river flows and precipitation.
Co-occurrence of these phenomena is more likely to be found in small and steep coastal
catchments, such as mountainous regions near the coast, because they have a quick response to
heavy rainfall that can lead to high direct runoff and/or increased riverine flows in conjunction
with high sea levels caused by storm tides and waves driven by the same weather system (Klerk
et al. 2015; Maskell et al. 2014; van den Hurk et al. 2015; Zheng, Westra, and Sisson 2013; Zheng
et al. 2014). In this condition, peak coastal water levels and peak river discharges are highly likely
to occur simultaneously and the interactions between them in the river channel can result in higher
flood depths and/or larger flood extents along the river and at the coastline compared to their isolate
occurrence (Svensson and Jones 2004). At the same time, heavy rainfall can lead to inland flooding
and direct runoff in areas that may be saturated by high sea levels (Gallien et al. 2018). Concurrent
flood hazards and the interactions among multiple contributing factors can lead to severe impacts.
Understanding of individual flood hazards and associated risks has progressed significantly,
The resultant risk is often significantly underestimated with severe consequences (Bevacqua et al.
2017; Chen et al. 2010; Kumbier et al. 2018). Until present, only a few studies have characterized
compound flood hazards using process-based approaches (Tang et al. 2013; Joyce et al. 2018;
Kumbier et al. 2018), statistical methods (Bevacqua et al. 2017; Klerk et al. 2015; Paprotny et al.
2018; van den Hurk et al. 2015; Wahl et al. 2015; Ward et al. 2018), and frameworks that combine
them together (Lian, Xu, and Ma 2013; Thompson and Frazier 2014). Thompson & Frazier (2014)
studied joint impacts of storm surges, inland precipitation and sea-level rise (SLR) over Sarasota
County, Florida. Flood events of historical extreme events were depicted based on deterministic
flood extents and high-risk regions for current and future hazards were determined based on
probabilistic inundation extents, but this study did not consider the interactions between river flows
and storm surges along waterways. Kumbier et al. (2018) developed a hydrodynamic numerical
module in an estuarine environment and investigated compound flooding caused by storm tides
and high river runoff, by quantifying the horizontal (flood extent) and vertical (water depth)
differences in flood hazard estimates when including and excluding upstream riverine discharges
during simulations. Joyce et al. (2018) utilized a coupled hydrodynamic circulation and
wave-driven model to generate time series of total water levels (i.e. storm surges, astronomical tides and
waves) from meteorological forcings with various hurricane characteristics, sea level rise, and
rainfall. The time series are inputs of a hydrodynamic stormwater and hydrologic model to
simulate flooding caused by sea levels while considering hydrological factors and interactions
between them such as rainfall runoff and groundwater table fluctuations. Nevertheless, these
analyses did not account for the direct impacts of extreme rainfall on flooding patterns.
Hydrodynamic models used in the flood analysis can be categorized into one-dimensional (1D),
two-dimensional (2D), and three-dimensional (3D) models. It is the simplest approach to treat
floodplain flows as part of the one-dimensional channel flows running parallel to the river channel,
but its major drawbacks include the representation of floodplain topography as a series of
cross-sections rather than as a surface, one cross-section averaged velocity to represent large variations
in velocity across the floodplain, and the subjectivity of locations of cross sections (Teng et al.
2017; N.M. Hunter et al. 2007). Those problems are solved in two-dimensional models, where
floodplain flows are represented as two-dimensional by assuming water depth is shallow and is
insignificant compared to the other two dimensions (Teng et al. 2017). The applications of
sufficient levels of physical and topographic representations (N. Hunter et al. 2008; N.M. Hunter
et al. 2007). Unless when the modelling of vertical features is important, such as in cases of dam
breaks and levee breaches, complex three-dimensional representations are unnecessary and the
two-dimensional shallow water approximation is adequate for many scales of floodplain flows
(N.M. Hunter et al. 2007; Teng et al. 2017). Coupled 1D/2D schemes were also developed, where
river channels modelled as one-dimensional are coupled to floodplain flows in the 2D domain, in
order to make use of the efficiency of 1D models and the accurately simulated flow dynamics in
2D models (Werner, Blazkova, and Petr 2005; Patro et al. 2009).
2.2
Two-dimensional Hydrodynamic Modelling
Two-dimensional hydrodynamic modelling is widely used in flood analysis (Fernández et al. 2016;
Gallien et al. 2018; Joyce et al. 2018; Kumbier et al. 2018; Olbert et al. 2017; Saleh et al. 2017;
Tang et al. 2013). Models that solve full 2D shallow water equations have proven to be able to
accurately simulate flood inundation characteristics such as timing and duration (Teng et al. 2017).
However, those models are computationally expensive, which is particularly unaffordable in urban
flood estimations when the required model resolution is 50m or less and/or for probabilistic
analyses which require a large number of simulations (Bates et al. 2005; Teng et al. 2017).
Furthermore, computationally-expensive models are less likely to take advantage of the recent
development in the remote sensing of topography such as high-resolution Light Detection and
Ranging (LiDAR) digital elevation models due to the large computation time. In fact,
improvements of other factors such as increasing the model resolution may help generate more
accurate results than that of increasing physical complexity of the model itself (Lewis et al. 2013).
Therefore, simplified two-dimensional hydraulic models that are computationally efficient while
still capable of capturing dominant processes in flood events were developed, such as
LISFLOOD-FP, Cama-Flood and JFLOW (Teng et al. 2017; N.M. Hunter et al. 2007; Horritt and Bates 2002).
Bates, Horritt, and Fewtrell (2010) developed a simplified two-dimensional model
LISFLOOD-FP, which discretizes the domain into grid cells and solves two-dimensional shallow water
equations without the advection term using an explicit finite difference scheme on a staggered grid.
balance in each cell (continuity equation, Eq. (2-1)) and handling the momentum between cells
(momentum equation, Eq. (2-2)). These equations are briefly outlined here but are documented in
detail in Bates, Horritt, and Fewtrell (2010) and de Almeida et al. (2012). To maintain model
stability, an adaptive time-stepping method (Eq. (2-3)) is used to automatically select suitable time
steps based on the Courant-Friedrichs-Lewy (CFL) condition.
ℎ 𝑖,𝑗 𝑡+∆𝑡 = ℎ 𝑖,𝑗 𝑡
+ ∆𝑡 𝑄𝑥 𝑖−1/2,𝑗
𝑡+∆𝑡 − 𝑄
𝑥 𝑖+1/2,𝑗𝑡+∆𝑡 + 𝑄𝑦 𝑖,𝑗−1/2𝑡+∆𝑡 − 𝑄𝑦 𝑖,𝑗+1/2𝑡+∆𝑡
𝐴𝑖,𝑗 (2-1)
𝑄𝑖+1/2𝑡+∆𝑡 = 𝑄𝑖+1/2
𝑡 − 𝑔𝐴 𝑓𝑙𝑜𝑤 𝑡 ∆𝑡𝑆
𝑖+1/2𝑡
1 + 𝑔∆𝑡𝑛2|𝑄
𝑖+1/2𝑡 |/[(𝑅𝑓𝑙𝑜𝑤𝑡 ) 4/3
𝐴𝑓𝑙𝑜𝑤𝑡 ]
(2-2)
∆𝑡 = 𝛼 𝛥𝑥
√max(ℎ𝑡)𝑔 (2-3)
where h is the water depth at the centre of each cell, Q is the flow between cells, A is the area of flows between cells, subscripts i and j are cell spatial indices in x and y directions, Δt is the time step, superscripts t and t+Δt indicate the time t and t+Δt, R is the hydraulic radius, S is the water surface slope between cells, n is the Manning's roughness coefficient, g is the gravitational acceleration, α is the CFL coefficient ranging from 0.2 to 0.7 used to generate stable simulations
for most flow situations, 𝛥𝑥 is the cell width, and max(ht) is the maximum water depth.
Besides the extensive tests in benchmarking studies (N. Hunter et al. 2008; J. Neal et al. 2012),
developments were also made for the purpose of extending the use of this inertial model. Although
instabilities in low friction scenarios were reported in Bates, Horritt, and Fewtrell (2010), solutions
were subsequently proposed in de Almeida et al. (2012). J. Neal, Schumann, and Bates (2012)
presented a scheme to include a sub-grid channel routine in the original inertial model, which was
further extended by J.C. Neal et al. (2015) through introducing a shape parameter to represent
various cross-sectional shapes. The sub-grid version of LISFLOOD-FP was proven to be stable
and allows for an accurate representation of river channels with any cross-sectional geometry and
with any width that is below model resolution. Its successful applications in Lewis et al. (2013),
Fernández et al. (2016), and García-Pintado et al. (2015) showed that the connectivity provided by
sub-grid channels was essential to reproduce flow dynamics particularly in large scale simulations.
in the predicting capability and accuracy in terms of water levels, wave propagation speeds, and
inundation extents. Besides the introduction of sub-grid channels, considering the increasing need
to directly use hydrodynamic models to simulate pluvial events particularly in complex urban
areas, a constant velocity rainfall routing scheme was introduced by Sampson et al. (2013). This
new scheme enables the model to route rainfall-derived water from elevated structures such as
buildings without causing instabilities while reducing computation time.
The resulting inertial formulation, relatively simple yet robust, has found to be computationally
efficient while yielding similar performance (in representing flood characteristics such as extents,
depths and velocities) to diffusive models and full two-dimensional shallow water models
especially in simulating subcritical flows that gradually vary in time and space (Bates, Horritt,
and Fewtrell 2010; Fewtrell et al. 2011; Lewis et al. 2013; de Almeida and Bates 2013).
Additionally, this scheme has the ability to deal with rapid wetting and drying conditions during
the flood events (Bates, Horritt, and Fewtrell 2010). It provides an appropriate compromise
between computational cost and physical realism, and was successfully applied in floods caused
by single factor, such as river flows (Bermúdez et al. 2017; Fewtrell et al. 2011; García-Pintado
et al. 2015; Wood et al. 2016), rainfall (Sampson et al. 2013), and coastal water levels (Lewis et
al. 2011; Quinn et al. 2014; Seenath, Wilson, and Miller 2016), as well as compound floods
caused by storm tides and river flows (Lewis et al. 2013; Maskell et al. 2014; Skinner et al. 2015).
In compound flooding, it is critical to accurately simulate the interaction between river flows and
coastal water levels. Maskell et al. (2014) investigated the combined influence of storm surges
and river flows in an idealized estuary by using the FVCOM (a full shallow-water formulation)
and LISFLOOD-FP models. Comparison of the results shows that LISFLOOD-FP has similar
predicting performance (i.e. maximum flood extents) as that of FVCOM but with much-reduced
computation resources. This indicates the great potential and advantage of using simplified
models that capture dominant physics when the surge-river interaction caused by momentum
exchange is insignificant to flood extents. In the study of Lewis et al. (2013), 3 arc-second
resolution (approximately 90m) Shuttle Radar Topography Mission (SRTM) dataset was
pre-processed and used as the terrain input for the LISFLOOD-FP model to simulate flooding caused
by storm tides. Sub-grid channels were included to allow propagations of sea water in river
channels along with backwater effects of river flows. The inundations model showed accuracy
maximum water levels) was satisfactory, indicating the suitability of publicly available data as
well as the ability of the sub-grid version of LISFLOOD-FP in simulating combined flooding.
Despite the successful applications of sub-grid LISFLOOD-FP in various flood analysis, its
ability to simulate compound flood caused by multiple concurrent contributing factors (i.e.
coastal water levels, river flows, and rainfall) has not been investigated thoroughly. In addition,
the accuracy of such simplified two-dimensional hydrodynamic model strongly depends on the
data quality, indicating the needs of high-resolution topographic data and correct forcing data for
more accurate simulation results (J. Neal et al. 2012; Lewis et al. 2013). In data-poor regions
where high-quality data is not available, it is necessary to process and improve the quality of
coarse-resolution topographic data, while the uncertainties in boundary conditions and their
propagations through the model to simulation results should be characterized.
2.3
Flood Risk Assessment of Critical Infrastructure
Flooding is one of the most frequent and disastrous natural hazards, which has caused significant
destructions to human societies (Teng et al. 2017; Salman and Li 2018). Based on the driven factor,
common flooding types include pluvial flooding that occurs when rainfall exceeds the capacity of
urban drainage systems, fluvial flooding that results from river overflows, and coastal flooding
caused by oceanic effects such as storm tides and waves (Hammond et al. 2015; Blanc et al. 2012).
Economic losses from floods, including direct damages (e.g. property and infrastructure damages)
and indirect impacts (e.g. disruptions of pubic essential services), have greatly risen over the
previous decades, mainly because of the increasing exposure of human settlements and economic
assets (Kundzewicz et al. 2014; Handmer et al. 2012; J. Yin, Yu, and Wilby 2016). Current flood
risks are projected to be exacerbated in many regions around the world due to climate change
because i) sea-level rise would amplify the impacts of coastal flooding, ii) changing local rainfall
patterns could lead to more frequent riverine and inland floods, and iii) changes in the frequency
and intensity of storm events would affect the characteristics and patterns of storm surges and
waves (Jha et al. 2012). Small island states, where human settlements and significant infrastructure
are predominate in coastal floodplains, are at particularly high risk of coastal- and weather-related
risk reduction strategies are of fundamental importance to avoid or reduce potential damages and
losses while achieving basic development objectives (Mercer 2010; Handmer et al. 2012).
Effective flood risk management relies on a prior flood risk assessment, which provides sufficient
insights into flood events, their consequences and possible mitigation measures that support the
decision-making procedures (de Moel et al. 2015). Risk can be defined as “the combination of the
probability of an event and its negative consequences” (UNISDR 2009). In the academic literature
for flood risk assessment, flood risk generally refers to the product of hazard, exposure, and
vulnerability (Kron 2005). To better understand and compute flood risk, the US Army Corps of
Engineers (USACE) conceptually defines flood risk as a function of the flood hazard, performance,
exposure, vulnerability, and consequence (USACE 2017). Flood hazard is represented by the flood
characteristics such as flood extents, flow velocities, and water depths; performance depicts how
the system reacts to the flood hazard; exposure describes the assets and population that are exposed
to flood hazards, while vulnerability refers to their susceptibility to floods; and consequence is
defined as the harm, such as economic damages and loss of life, resulting from flood hazards
(USACE 2017). Extensive frameworks of flood risk assessments were set up for pluvial flooding (Szewrański et al. 2018; Z. Yin et al. 2016), coastal flooding (Christie et al. 2018; Neumann et al.
2015), and fluvial flooding (Bates et al. 2005; Feyen et al. 2012) at different scales. Urban flooding
can include pluvial, coastal, and fluvial flooding. Due to the complexity and significance of urban
environments, frameworks were proposed for performing flood risk analysis of urban floods (Jha
et al. 2012; J. Yin et al. 2015). If different types of floods are correlated with each other in the
study area and are likely to occur simultaneously (e.g. hurricanes not only induce storm surges that
cause coastal floods but also heavy rainfalls that cause flash floods), flood risk assessment should
consider the joint probability of different flood factors and the combined consequences of
concurrent flooding (Lamb et al. 2010; Emanuelsson et al. 2014; Dawson 2015).
Infrastructures can be defined as “the basic facilities, services, and installations needed for the
functioning of a community or society”, and critical infrastructures are “systems and assets,
whether physical or virtual, so vital to the United States that the incapacity or destruction of such
systems and assets would have a debilitating effect on security, national economic security,
national public health or safety, or any combination of those matters” (Bennett 2018). Critical
and covering sectors that include agriculture and food, banking and finance, drinking water and
water treatment systems, energy, telecommunications, information technology, public health and
healthcare, commercial facilities, emergency services, as well as transportation systems (Bennett
2018; Rinaldi, Peerenboom, and Kelly 2001). Their reliable and secure operations are of
fundamental importance to national security and economic development. Infrastructures do not
function in isolation from each other, but are interdependent and the state of one infrastructure
may depend on the state of several other infrastructures. Rinaldi, Peerenboom, and Kelly (2001)
identified four types of interdependencies, namely physical, cyber, geographic, and logical.
Infrastructures can either directly or indirectly connect through one or more intervening
infrastructures. These connections are described as nth-order interdependencies, where n is the number of direct and indirect linkages between the two infrastructures. The coupling of
infrastructures can significantly increase the risk by triggering cascading effects. Disruptions or
failures of one infrastructure can propagate through the network and subsequently cause
disruptions or failures of other infrastructures thus creating first, second, and higher-order
disruptions or failures and making the whole system more vulnerable in exceptional circumstances
such as floods (Rinaldi, Peerenboom, and Kelly 2001). Propagation mechanisms of disruptions or
failures among infrastructures are expected to aggravate the impacts of flooding, leading to more
severe direct and indirect damages. For example, Hurricane Sandy hit New York City in 2012, and
the associated extremely high sea levels caused extensive flooding at the coast. The flooding led
to failures of several electric power systems, which subsequently led to destructions of other
infrastructures, including the evacuation of the New York University Langone Medical Center and
the transfer of 200 patients, destroyed and damaged houses in fire incidents due to the lack of
electricity, shortage of fuel supply, business interruptions, and the breakdowns of heating networks,
security systems, telecommunication services, as well as emergency power generators (Serre and
Heinzlef 2018). Therefore, although risk analysis of infrastructures is challenging because of
network complexity, data availability, and high degrees of interdependencies among different
infrastructures, it is indispensable in order to understand how disruptions or failures propagate
through the network and prevent catastrophic infrastructure breakdowns (Rinaldi, Peerenboom,
and Kelly 2001).
Recent studies have highlighted that relationships between infrastructures are essential for accurate
Zeadally 2015; Laugé, Hernantes, and Sarriegi 2015). There are several frameworks to simulate
interdependencies of infrastructures, including network-based approaches, agent-based modelling,
input-output models, and statistical techniques (Wang, Hong, and Chen 2012). Each framework
has its advantages and limitations, and therefore, selections of the appropriate method should be
based on the objectives and evaluated scopes of the study (Johansson and Hassel 2010). The major
task of flood risk analysis on infrastructures is to investigate how flood damages propagate through
the network of interdependent infrastructures (Hammond et al. 2015; Pant et al. 2018). Several
studies successfully integrate interdependencies of infrastructures into the flood risk assessment
framework by using network-based methods. The network theory is a classical and widely applied
method, where a set of nodes with connecting links build up systems as networks (Ottino 2003).
Emanuelsson et al. (2014) proposed a screening approach on the basis of network theory for flood
risk assessment of water utility infrastructure. This framework is the combination of probability
assessment, which considers the exceedance probability of a flood event and the vulnerability of
each asset at the event, and consequence assessment, which accounts for not only the direct
consequences of flooding of each asset but also consequences arising from interdependencies
among assets. Risk scores assigned to each asset by multiplying the probability and the
consequence can be utilized to rank assets, identify the potential critical assets, prioritize assets in
terms of investments to reduce flood risks, and also provide information for more detailed and
informative risk analysis. O’Neill (2014) proposed Strongest Path Method (SPM) for performing
risk analysis on interdependent infrastructure components, which consists of standalone risk
assessment for each node, identification of direct connections between each pair of nodes, and
simulation of effects of indirect connections among nodes. Strongest paths, which refer to the paths
between two infrastructures that constitute the most significant influence with the least intervening
nodes, can be identified. Besides, multiple analytical tools can be used to analyze the relative
importance of infrastructures in the system, which helps the prioritization of risks and development
of effective mitigation strategies. Tsavdaroglou et al. (2018) have developed a network-based
methodology to conduct the risk analysis of interdependent infrastructures under the conditions of
weather-induced hazards, including coastal, fluvial, and pluvial flooding, for the current and future
climate conditions. The risk estimations on infrastructure level are based on a semi-quantitative
approach, using the Likert scale to estimate impacts of the event on each infrastructure and
are quantified as the product of impact on the Likert scale and likelihood as a percentage showing
the degree of impact that a failure of one infrastructure can propagate to the other infrastructure.
Total cascading impacts on each infrastructure are assumed to be equivalent to the highest impact
among all its dependencies. This study showed that the severity of cascading effects is not only
related to the relationships among assets but also strongly dependent on the recovery time of
different infrastructures in different scenarios.
2.4
References
Alcaraz, Cristina, and Sherali Zeadally. 2015. "Critical infrastructure protection: Requirements and challenges for the 21st century." International Journal of Critical Infrastructure Protection 8: 53-66. https://doi.org/10.1016/j.ijcip.2014.12.002.
Bates, Paul D, Richard J Dawson, Jim W Hall, Matthew S Horritt, Robert J Nicholls, Jon Wicks, and Mohamed Ahmed Ali Mohamed Hassan. 2005. "Simplified two-dimensional
numerical modelling of coastal flooding and example applications." Coastal Engineering
52 (9): 793-810.
Bates, Paul D, Matthew S Horritt, and Timothy J Fewtrell. 2010. "A simple inertial formulation of the shallow water equations for efficient two-dimensional flood inundation
modelling." Journal of Hydrology 387 (1-2): 33-45.
Bennett, Brian T. 2018. Understanding, assessing, and responding to terrorism: Protecting critical infrastructure and personnel. John Wiley & Sons.
Bermúdez, María, Jeffrey C Neal, Paul D Bates, Gemma Coxon, Jim E Freer, Luis Cea, and Jeronimo Puertas. 2017. "Quantifying local rainfall dynamics and uncertain boundary conditions into a nested regional‐local flood modeling system." Water Resources Research 53 (4): 2770-2785.
Bevacqua, Emanuele, Douglas Maraun, Ingrid Hobæk Haff, Martin Widmann, and Mathieu Vrac. 2017. "Multivariate statistical modelling of compound events via pair-copula constructions: analysis of floods in Ravenna (Italy)." Hydrology and Earth System Sciences 21 (6): 2701-2723.
Blanc, Janice, JW Hall, Nicolas Roche, RJ Dawson, Y Cesses, A Burton, and CG Kilsby. 2012. "Enhanced efficiency of pluvial flood risk estimation in urban areas using spatial– temporal rainfall simulations." Journal of Flood Risk Management 5 (2): 143-152.
Chen, Albert S, S Djordjević, Jorge Leandro, and DA Savić. 2010. "An analysis of the combined consequences of pluvial and fluvial flooding." Water Science and Technology 62 (7): 1491-1498.
Christie, E. K., T. Spencer, D. Owen, A. L. McIvor, I. Möller, and C. Viavattene. 2018. "Regional coastal flood risk assessment for a tidally dominant, natural coastal setting: North Norfolk, southern North Sea." Coastal Engineering 134: 177-190.
https://doi.org/10.1016/j.coastaleng.2017.05.003.
Condon, Andrew J, and Y Peter Sheng. 2012. "Evaluation of coastal inundation hazard for present and future climates." Natural hazards 62 (2): 345-373.
Creel, Liz. 2003. Ripple effects: population and coastal regions. Population Reference Bureau Washington, DC.
Dawson, Richard J. 2015. "Handling interdependencies in climate change risk assessment."
Climate 3 (4): 1079-1096. https://doi.org/10.3390/cli3041079.
de Almeida, Gustavo AM, and Paul Bates. 2013. "Applicability of the local inertial
approximation of the shallow water equations to flood modeling." Water Resources Research 49 (8): 4833-4844.
de Almeida, Gustavo AM, Paul Bates, Jim E Freer, and Maxime Souvignet. 2012. "Improving the stability of a simple formulation of the shallow water equations for 2‐D flood modeling." Water Resources Research 48 (5).
de Moel, H., B. Jongman, H. Kreibich, B. Merz, E. Penning-Rowsell, and P. J. Ward. 2015. "Flood risk assessments at different spatial scales." Mitigation and Adaptation Strategies for Global Change 20 (6): 865-890. https://doi.org/10.1007/s11027-015-9654-z.
Doocy, Shannon, Amy Daniels, Sarah Murray, and Thomas D Kirsch. 2013. "The human impact of floods: a historical review of events 1980-2009 and systematic literature review."
PLoS currents 5.
Emanuelsson, MAE, N Mcintyre, CF Hunt, R Mawle, J Kitson, and N Voulvoulis. 2014. "Flood risk assessment for infrastructure networks." Journal of Flood Risk Management 7 (1): 31-41.
Fernández, Alfonso, Mohammad Reza Najafi, Michael Durand, Bryan G Mark, Mark Moritz, Hahn Chul Jung, Jeffrey Neal, Apoorva Shastry, Sarah Laborde, and Sui Chian Phang. 2016. "Testing the skill of numerical hydraulic modeling to simulate spatiotemporal flooding patterns in the Logone floodplain, Cameroon." Journal of Hydrology 539: 265-280.
Fewtrell, TJ, A Duncan, CC Sampson, JC Neal, and PD Bates. 2011. "Benchmarking urban flood models of varying complexity and scale using high resolution terrestrial LiDAR data."
Feyen, Luc, Rutger Dankers, Katalin Bódis, Peter Salamon, and José I. Barredo. 2012. "Fluvial flood risk in Europe in present and future climates." Climatic Change 112 (1): 47-62. https://doi.org/10.1007/s10584-011-0339-7.
Frazier, Tim G., Nathan Wood, Brent Yarnal, and Denise H. Bauer. 2010. "Influence of potential sea level rise on societal vulnerability to hurricane storm-surge hazards, Sarasota County, Florida." Applied Geography 30 (4): 490-505.
https://doi.org/https://doi.org/10.1016/j.apgeog.2010.05.005.
Gallien, Timu W., Nikos Kalligeris, Marie-Pierre C. Delisle, Bo-Xiang Tang, Joseph T. D. Lucey, and Maria A. Winters. 2018. "Coastal flood modeling challenges in defended urban backshores." Geosciences (Switzerland) 8 (12): 450.
https://doi.org/10.3390/geosciences8120450.
García-Pintado, Javier, David C. Mason, Sarah L. Dance, Hannah L. Cloke, Jeff C. Neal, Jim Freer, and Paul D. Bates. 2015. "Satellite-supported flood forecasting in river networks: A real case study." Journal of Hydrology 523: 706-724.
https://doi.org/10.1016/j.jhydrol.2015.01.084.
Hammond, M. J., A. S. Chen, S. Djordjević, D. Butler, and O. Mark. 2015. "Urban flood impact assessment: A state-of-the-art review." Urban Water Journal 12 (1): 14-29.
https://doi.org/10.1080/1573062X.2013.857421.
Handmer, John, Yasushi Honda, Zbigniew W. Kundzewicz, Gerardo Benito, Ismail Fadl Mohamed, Shaohong Wu, Kiyoshi Takahashi, and <div style=""> Zheng Yan. 2012.
Changes in impacts of climate extremes: human systems and ecosystems. In: Managing the Risks of Extreme Events and Disasters to Advance Climate Change Adaptation. edited by C.B. Field, V ., T.F. Stocker Barros, D. Qin, D.J. Dokken, K.L. Ebi, M.D. Mastrandrea, K.J. Mach, G.-K. Plattner, S.K., M. Tignor Allen, and P.M. and Midgley. A Special Report of Working Groups I and II of the Intergovernmental Panel on Climate Change (IPCC). Cambridge University Press, Cambridge, UK, and New York, NY, USA. A Special Report of Working Groups I and II of the Intergovernmental Panel on Climate Change (IPCC).
Horritt, MS, and PD Bates. 2002. "Evaluation of 1D and 2D numerical models for predicting river flood inundation." Journal of hydrology 268 (1-4): 87-99.
Hunter, Neil M, Paul D Bates, Matthew S Horritt, and Matthew D Wilson. 2007. "Simple spatially-distributed models for predicting flood inundation: a review." Geomorphology
90 (3-4): 208-225.
Hunter, NM, PD Bates, S Neelz, G Pender, I Villanueva, NG Wright, D Liang, Roger Alexander Falconer, B Lin, and S Waller. 2008. "Benchmarking 2D hydraulic models for urban flood simulations." Proceedings of the institution of civil engineers: water management.
D.J. Dokken C. B. F. Barros V.R., M.D. Mastrandrea, K.J. Mach, T.E., M. Bilir, K. L. E. Chatterjee, Y.O. Estrada, R.C. Genova, B. Girma, E.S. and A.N. Kissel, & S. M. Levy, P.R. Mastrandrea, & L.L. White. Cambridge University Press, Cambridge, United Kingdom and New York, NY, USA.
Jha, Abhas, Jessica Lamond, David Proverbs, Namrata Bhattacharya-Mis, Ana Lopez, Nikolaos Papachristodoulou, A. Bird, Robin Bloch, J. Davies, and R. Barker. 2012. Cities and Flooding: A guide to integrated urban flood risk management for the 21st Century.
Johansson, Jonas, and Henrik Hassel. 2010. "An approach for modelling interdependent
infrastructures in the context of vulnerability analysis." Reliability Engineering & System Safety 95 (12): 1335-1344.
Joyce, Justin, Ni-Bin Chang, Rahim Harji, Thomas Ruppert, and Peter Singhofen. 2018. "Cascade impact of hurricane movement, storm tidal surge, sea level rise and precipitation variability on flood assessment in a coastal urban watershed." Climate Dynamics 51 (1): 383-409. https://doi.org/10.1007/s00382-017-3930-4.
Kew, S. F., F. M. Selten, G. Lenderink, and W. Hazeleger. 2013. "The simultaneous occurrence of surge and discharge extremes for the Rhine delta." Natural Hazards and Earth System Sciences 13 (8): 2017-2029. https://doi.org/10.5194/nhess-13-2017-2013.
Klerk, W. J., H. C. Winsemius, W. J. Van Verseveld, A. M. R. Bakker, and F. L. M. Diermanse. 2015. "The co-incidence of storm surges and extreme discharges within the Rhine-Meuse Delta." Environmental Research Letters 10 (3): 35005. https://doi.org/10.1088/1748-9326/10/3/035005.
Kron, Wolfgang. 2005. "Flood Risk = Hazard Values Vulnerability." Water International 30 (1): 58-68. https://doi.org/10.1080/02508060508691837.
Kumbier, Kristian, Rafael C. Carvalho, Athanasios T. Vafeidis, and Colin D. Woodroffe. 2018. "Investigating compound flooding in an estuary using hydrodynamic modelling: A case study from the Shoalhaven River, Australia." Natural Hazards and Earth System Sciences 18 (2): 463-477. https://doi.org/10.5194/nhess-18-463-2018.
Kundzewicz, Zbigniew W., Shinjiro Kanae, Sonia I. Seneviratne, John Handmer, Neville Nicholls, Pascal Peduzzi, Reinhard Mechler, Laurens M. Bouwer, Nigel Arnell,
Katharine Mach, Robert Muir-Wood, G. Robert Brakenridge, Wolfgang Kron, Gerardo Benito, Yasushi Honda, Kiyoshi Takahashi, and Boris Sherstyukov. 2014. "Flood risk and climate change: global and regional perspectives." Hydrological Sciences Journal 59 (1): 1-28. https://doi.org/10.1080/02626667.2013.857411.
Lamb, R., C. Keef, J. Tawn, S. Laeger, I. Meadowcroft, S. Surendran, P. Dunning, and C. Batstone. 2010. "A new method to assess the risk of local and widespread flooding on rivers and coasts." Journal of Flood Risk Management 3 (4): 323-336.
https://doi.org/10.1111/j.1753-318X.2010.01081.x.
Laugé, Ana, Josune Hernantes, and Jose M. Sarriegi. 2015. "Critical infrastructure dependencies: A holistic, dynamic and quantitative approach." International Journal of Critical
Infrastructure Protection 8: 16-23. https://doi.org/10.1016/j.ijcip.2014.12.004.
Lewis, Matt, Paul Bates, Kevin Horsburgh, Jeff Neal, and Guy Schumann. 2013. "A storm surge inundation model of the northern Bay of Bengal using publicly available data." Quarterly Journal of the Royal Meteorological Society 139 (671): 358-369.
https://doi.org/10.1002/qj.2040.
Lewis, Matt, Kevin Horsburgh, Paul Bates, and Ros Smith. 2011. "Quantifying the Uncertainty in Future Coastal Flood Risk Estimates for the U.K." Journal of Coastal Research 27 (5): 870-881. https://doi.org/10.2112/JCOASTRES-D-10-00147.1.
Lian, J. J., K. Xu, and C. Ma. 2013. "Joint impact of rainfall and tidal level on flood risk in a coastal city with a complex river network: A case study of Fuzhou City, China."
Hydrology and Earth System Sciences 17 (2): 679-689. https://doi.org/10.5194/hess-17-679-2013.
Maskell, John, Kevin Horsburgh, Matthew Lewis, and Paul Bates. 2014. "Investigating River-Surge Interaction in Idealised Estuaries." Journal of Coastal Research 30 (2): 248-259. https://doi.org/10.2112/JCOASTRES-D-12-00221.1.
Mercer, Jessica. 2010. "Disaster risk reduction or climate change adaptation: Are we reinventing the wheel?" Journal of International Development 22 (2): 247-264.
https://doi.org/10.1002/jid.1677.
Neal, Jeffrey, Guy Schumann, and Paul Bates. 2012. "A subgrid channel model for simulating river hydraulics and floodplain inundation over large and data sparse areas." Water Resources Research 48 (11). https://doi.org/10.1029/2012WR012514.
Neal, Jeffrey, Ignacio Villanueva, Nigel Wright, Thomas Willis, Timothy Fewtrell, and Paul Bates. 2012. "How much physical complexity is needed to model flood inundation?" Hydrological Processes 26 (15): 2264-2282. https://doi.org/10.1002/hyp.8339.
Neal, Jeffrey C., Nicholas A. Odoni, Mark A. Trigg, Jim E. Freer, Javier Garcia-Pintado, David C. Mason, Melissa Wood, and Paul D. Bates. 2015. "Efficient incorporation of channel cross-section geometry uncertainty into regional and global scale flood inundation models." Journal of Hydrology 529 (1): 169-183.
https://doi.org/10.1016/j.jhydrol.2015.07.026.
global assessment." PLoS ONE 10 (3): e0118571. https://doi.org/10.1371/journal.pone.0118571.
Olbert, Agnieszka I., Joanne Comer, Stephen Nash, and Michael Hartnett. 2017.
"High-resolution multi-scale modelling of coastal flooding due to tides, storm surges and rivers inflows. A Cork City example." Coastal Engineering 121: 278-296.
https://doi.org/10.1016/j.coastaleng.2016.12.006.
Ottino, Julio M. 2003. "Complex systems." AIChE Journal 49 (2): 292-299.
Pant, Raghav, Scott Thacker, Jim W Hall, David Alderson, and Stuart Barr. 2018. "Critical infrastructure impact assessment due to flood exposure." Journal of Flood Risk Management 11 (1): 22-33.
Paprotny, Dominik, Michalis I. Vousdoukas, Oswaldo Morales-Nápoles, Sebastiaan N. Jonkman, and Luc Feyen. 2018. "Compound flood potential in Europe." Hydrology and Earth System Sciences Discussions: 1-34. https://doi.org/10.5194/hess-2018-132.
Patro, S, C Chatterjee, S Mohanty, R Singh, and NS Raghuwanshi. 2009. "Flood inundation modeling using MIKE FLOOD and remote sensing data." Journal of the Indian Society of Remote Sensing 37 (1): 107-118.
Quinn, N., M. Lewis, M. P. Wadey, and I. D. Haigh. 2014. "Assessing the temporal variability in extreme storm‐tide time series for coastal flood risk assessment." Journal of
Geophysical Research: Oceans 119 (8): 4983-4998. https://doi.org/10.1002/2014JC010197.
Rinaldi, S. M., J. P. Peerenboom, and T. K. Kelly. 2001. Identifying, understanding, and analyzing critical infrastructure interdependencies. 21 (6): 11-25.
https://doi.org/10.1109/37.969131.
Saleh, F., V. Ramaswamy, Y. Wang, N. Georgas, A. Blumberg, and J. Pullen. 2017. "A multi-scale ensemble-based framework for forecasting compound coastal-riverine flooding: The Hackensack-Passaic watershed and Newark Bay." Advances in Water Resources
110: 371-386. https://doi.org/10.1016/j.advwatres.2017.10.026.
Salman, Abdullahi M., and Yue Li. 2018. "Flood Risk Assessment, Future Trend Modeling, and Risk Communication: A Review of Ongoing Research." Natural Hazards Review 19 (3): 4018011. https://doi.org/10.1061/(ASCE)NH.1527-6996.0000294.
Sampson, Christopher C., Paul D. Bates, Jeffrey C. Neal, and Matthew S. Horritt. 2013. "An automated routing methodology to enable direct rainfall in high resolution shallow water models." Hydrological Processes 27 (3): 467-476. https://doi.org/10.1002/hyp.9515.
Seenath, Avidesh, Matthew Wilson, and Keith Miller. 2016. "Hydrodynamic versus GIS
modelling for coastal flood vulnerability assessment: Which is better for guiding coastal management?" Ocean and Coastal Management 120: 99-109.