Performance Evaluation of Concrete Made
With Binary and Ternary Blends
P.Venakata Swaroop Kumar 1, M.Mallikharjuna 2 M.S.Anantha Venkatesh 3
P.G. Student, Department of Civil Engineering, SVR Engineering College, Nandyala, Kurnool, India1 Assistant Professor, Department of Civil Engineering, SVR Engineering College, Nandyala, Kurnool, India2 Assistant Professor & H.O.D, Department of Civil Engineering, SVR Engineering College, Nandyala, Kurnool, India3
ABSTRACT: With the advances in concrete technology, the use of mineral admixtures in general and rice husk ash and fly ash in particular have become an important part of strength and durability studies in concrete. The strength and durability of concrete can be enhanced by the use of mineral admixtures in concrete. In this study rice husk ash (RHA) and fly ash (FA) have been used as a mineral admixture in concrete. Rice husk ash is obtained when rice husk is burnt at higher temperatures. Fly ash is obtained from the combustion of the coal in thermal power plants. The present work is highlighted on the compressive strength, non-destructive parameters and durability characteristics of concrete made with ordinary Portland cement (control mix) and concrete with RHA and FA as part replacement of OPC. Four different water-binder ratios namely 0.45, 0.5, 0.55 and 0.6 are used and for each water-binder ratio the RHA replacement levels are 0%, 10% and 20% by mass for binary blends and in ternary blends, RHA is replaced by 10% and fly ash is replaced by 15% and 25% by mass. The tests for compressive strength, ultrasonic pulse velocity (USPV) and Rebound hammer values have been carried out for all the concrete mixes at different ages namely 7, 28, 56 and 90 days. In addition the correlations between compressive strength and the non-destructive parameters such as rebound number and ultrasonic pulse velocity have also been obtained. In addition to that moisture content measurement and Air permeability test have been carried out at ages 28 and 90 days respectively. From moisture content measurements, calibration curves have been obtained. Dynamic Young’s modulus values have been obtained from USPV values for all concrete mixes at different ages. Finally on the basis of the results, relevant conclusions have been drawn.
I. INTRODUCTION
Rice Husk is the outer covering of rice grains which is obtained as an agricultural residue obtained during the milling of paddy. During milling, about 78% of weight is received as rice, broken rice and bran. Rest 22 % of the weight of paddy is received as husk. Rice husk is burnt approximately 48 hours under uncontrolled combustion process. The Burning temperature is within the range 600 to 8500C. This husk contains about 75 % organic volatile matter and the remaining 25 % of the weight of this husk is converted into ash during the firing process. This ash is known as rice husk ash (RHA). The RHA thus obtained is ground in a Ball mill for 30 minutes. Its appearance colour is grey. RHA contains around 85 % - 90 % amorphous silica.
Fly Ash: Fly ash has been used as the mineral admixture at various replacement levels in the present investigation. The fly ash belongs to Class F category.
Specific gravity: The specific gravity of fly ash was determined using Le Chatelier flask. Three replicate samples were taken and the average value was taken as the representative value of specific gravity for fly ash. The determined value of specific gravity of fly ash is 2.12
Loss on ignition: Loss on ignition of fly ash was carried out in the same manner, as that adopted for OPC. The measured value of LOI for fly ash is 0.34%.
of the materials are then related to its quality. Comparative higher velocity is obtained when the quality of the concrete is good.
Assessing the quality of the materials by USPV measurement is done by an apparatus that generates suitable pulses and accurately measures the time of their transmission, i.e. transit time through the material tested. The distance from which the pulse travel in the material (path length) must also measured to enable the velocity to be determined from:-
Velocity=path length / transit time
The velocity of a pulse of longitudinal ultrasonic vibrations travelling in an elastic solid is given by: [2]
2
(1
)
(1
)(1 2 )
E
V
Where E is the dynamic elastic modulus (N/mm2)
ρ is the density (kg/m3)
ν is the Poisson’s ratio
USPV test is carried out in three different methods. They are:
1. Direct method: -In this method, the receiver and the transmitter are kept in on opposite sides of the specimen in a straight line. This is the best way of measuring the USPV as the longitudinal pulses leaving the transmitter are mainly propagated in the direction normal to the transducer face. This is normally applicable when the opposite sides of the specimen are easily accessible e.g. a concrete cube. Column, etc.
2. Semi-direct:-In this method, the receiver and the transmitter are kept on adjacent sides of the specimen at right angles to each other. This is adopted when direct method is not applicable e.g. columns at corner of buildings where walls are acting as obstructions.
3. In-direct method: -In this method, the receiver and the transmitter are kept on the same side of the specimen. This is normally done when the above two methods are not possible e.g. beams.
The quality of concrete in terms of uniformity, incidence or absence of flaws, cracks and segregation, etc, in structures in terms of the ultrasonic pulse velocity (USPV)
Rebound Hammer test: Rebound hammer test is used as Non-destructive technique to assess the surface hardness of concrete. The rebound value of any specimen depends on the surface hardness. When the plunger is pressed on to the specimen the spring-controlled mass rebounds and the extent of such a rebound depends upon the surface hardness of the concrete. From this we will get the rebound value and the compressive strength will be obtained by the graph which was given on the apparatus.
Figure 1 Diagram of Rebound hammer
II.RELATED WORK
Memon et al.Studied the possibility of production of Low Cost Self Compacting Concrete Using Rice Husk Ash. In this study they focused on comparison of fresh properties of self compacting concrete (SCC) containing varying amounts of RHA at different dosages of super plasticizer keeping cement water, coarse aggregates and fine aggregates contents constant. For each mix they carried out slump flow, L-box and V-funnel test. In this study found that viscosity of the mix is increased by increasing the percentage of RHA. The potential of the mixes to resist segregation was also observed for the particular mix used.
Muhammad et al.Investigated the effect of rice husk on concrete. RHA having different fineness and passing through 75µm and 45µm were used. OPC was replaced by RHA up to 30%. They confirmed that it is possible to get 70MPa strength by using RHA. Fine grinding of RHA improved the results. Maximum strength was obtained by 10% replacement of RHA and optimum replacement may fall in between 10% and 20%. Addition of RHA to concrete was found to lower the rate of hydration than the controlled mix.
Raoul et al.Reported on the evolution of strength and physicochemical properties of light weight mortars containing rice husks. Samples were cured for 7days at 20oC and 100% relative humidity (RH). Two groups of sample were kept in storage for one year at 50% and 95% Relative Humidity. At the end of one year, the compressive strength of 95%RH samples were reported to be higher than the 50% RH but whereas the flexural strength is higher for the specimens stored at 50%RH.
III.MATERIALS
Cement: Cement used in the investigation is ordinary Portland cement OPC. OPC confirming to Indian standards IS: 8112-1989 [19]
Specific gravity of cement
The specific gravity of cement was determined using Le Chatelier flask. Three replicate samples were taken and the average value was taken as the representative value of specific gravity for OPC. The determined value of specific gravity of OPC is 3.14.
Rice husk ash (RHA):
RHA is the mineral admixture used in this investigation. The technical specifications of RHA are as listed below: SiO2 - Silica 85% maximum
Humidity 2% maximum
Colour Grey
Particle size 25 microns RHA % Colour Size Differences
Specific gravity: The specific gravity of cement was determined using Le Chatelier flask. Three replicate samples were taken and the average value was taken as the representative value of specific gravity for RHA. The determined value of specific gravity of RHA is 2.11.
Fly Ash: Fly ash has been used as the mineral admixture at various replacement levels in the present investigation. The fly ash belongs to Class F category.
Aggregates
Coarse aggregate: The coarse aggregates of size 20mm MSA (maximum size of aggregate) and 12.5mm MSA are used in the proportion of 65% and 35% respectively by mass.
Sand: The sieve analysis of sand was carried out as per the guidelines given in IS: 383-1970. The observed values are presented in Table 2.4. From the %passing values, it was observed that the sand is confirming to grading zone-III as per IS 383-1970[20].
Superplasticizer: In this project, Conplast SP430 PL (PQ)-1 is used. This plasticizer compiles with IS: 9103:1979, B3:5075 part 3 and ASTM-C-49 Type ‘G’ as a high range water reducing admixture. Conplast SP430 PL (PQ)-1 is based on Sulfonated naphthalene polymers and is supplied as a brown liquid instantly dispersible in water. It reduces water up to 25% without loss of workability.
Table 1. Mix proportions of all mixes
Designation
Water-Binder ratio (w/b)
Percentage Superplast- Cizer (%)
Water (kg)
Cement (kg)
Rice husk ash (kg)
Fly ash (kg)
Fine aggregate (kg)
Coarse aggregate (kg)
Control mix
0.6 0 210 350 0 0 581 1234
0.55 0 210 380 0 0 555 1230
0.5 0 210 420 0 0 524 1221
0.45 0 210 467 0 0 484 1214
10% RHA
0.6 0.5 210 315 35 0 581 1234
0.55 0.5 210 342 38 0 555 1230
0.5 0.5 210 378 42 0 524 1221
0.45 0.7 210 420 47 0 484 1214
20% RHA
0.6 0.7 210 280 70 0 581 1234
0.55 0.7 210 304 76 0 555 1230
0.5 0.7 210 336 84 0 524 1221
0.45 0.8 210 374 93 0 484 1214
10%RHA – 15%FA
0.6 0.5 210 263 35 52 581 1234
0.55 0.5 210 285 38 57 555 1230
0.5 0.5 210 315 42 63 524 1221
0.45 0.6 210 350 47 70 484 1214
10%RHA – 25%FA
0.6 0 210 228 35 87 581 1234
0.5 0 210 273 42 105 524 1221
0.45 0 210 304 47 116 484 1214
IV.EXPERIMENTAL WORK
Preparation of cubes:
The cubes of size 15cmx15cmx15cm are prepared from the above concrete mixes. After 24hrs of preparation, the cubes were taken out from the moulds and kept for moist curing.
Total number of cubes prepared = 280 OPC mix = 56
OPC-10%RHA mix = 56 PPC-20%RHA mix = 56
PPC-10%RHA-15%PFA mix = 56 PPC-10%RHA-25%PFA mix = 56
Cubes for moisture content for all mixes= 48 (size 50mm × 50mm × 50mm
V.RESULTS & DISCUSSIONS
Slump Test:
Slump test was carried out after mixing for all the concrete mixes. The slump values of control mix, 10%RHA, 20%RHA, 10%RHA-15%FA and 10%RHA-25%FA concrete mix for different water-binder ratios are listed below in
Table 2.Slump values of different percentage of RHA and different water-binder ratio
w/b ratio Control mix 10% RHA mix
20%RHA mix
10%RHA-15%FA mix
10%RHA-25%FA mix
Slump (mm)
0.6 39 45 51 48 45
0.55 33 38 46 43 49
0.5 34 39 43 35 35
0.45 36 46 35 46 42
Compressive Strength Test:
The compressive strength of control mix, 10% RHA mix, 20%RHA mix, 15%PFA mix and 10%RHA-15%PFA mix samples of different water-binder ratios are determined at ages 7, 28, 56 and 90 days in the compression testing machine. The average value of three replicates is taken as the representative value of compressive strength. The results of compressive strength for control mix are presented in Table 2.
Figure 1.Compressive strength vs. age of cubes for control mix
The compressive strength of concrete mixes with 10% RHA is presented in Fig. 2 and in Table 3.3. In this case also the compressive strength values increased with age and decreased with increase in w/b ratio.
Figure 2.Compressive strength vs. age of cubes for 10% RHA mix
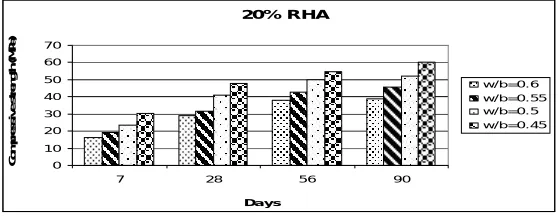
Figure 3.Compressive strength vs. age of cubes for 20% RHA mix
The compressive strength of concrete mixes with 10% RHA is presented in Fig. 3 and in Table 3.3. In this case also the compressive strength values increased with age and decreased with increase in w/b ratio.
The compressive strength values for OPC mix with replacements of 10% Rice husk ash (RHA) and 15% Fly ash at the ages of 7, 28, 56 and 90 days with different w/b ratios are shown in Fig. 4
CONTROL MIX 0 10 20 30 40 50 60
7 28 56 90
Days C o m p re s s iv e S tr e n g th ( M P a ) w/b=0.6 w/b=0.55 w/b=0.5 w/b=0.45
10% RHA
0 10 20 30 40 50 60
7 28 56 90
Da ys C o m p re s s iv e S tr e n g th ( M P a ) w/b=0.6 w/b=0.55 w/b=0.5 w/b=0.45
20% RHA
0 10 20 30 40 50 60 70
7 28 56 90
Figure 4.Compressive strength vs. age of cubes for 10% RHA - 15% FA mix
Also the compressive strength increased with age at all w/b ratios. The results are shown graphically in Fig. 5
Figure 5.Compressive strength vs. age of cubes for 10% RHA - 25% FA mix
.Comparison of compressive strength of all mixes
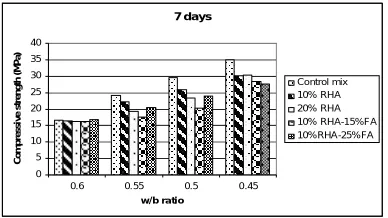
The compressive strength values for all mixes are compared. The comparison plots of compressive strength (all mixes) at 7 days, 28 days, 56 days and 90 days are shown in Fig. 6, Fig. 7, Fig. 8 and Fig. 9 respectively.
Figure 6.Compressive strength vs. w/b ratio at Figure 7.Compressive strength vs. w/b ratio at 28 days for all mixes 7 days for all mixes
Figure 8.Compressive strength vs. w/b ratio at 56 days Figure 9.Compressive strength vs. w/b ratio at 90 days for for all mixes all mixes
10% RHA - 15% FA
0 10 20 30 40 50 60
7 28 56 90
Da ys C o m p re s s iv e S tr e n g th (M P a ) w/b=0.6 w/b=0.55 w/b=0.5 w/b=0.45
10% RHA - 25% FA
0 10 20 30 40 50 60
7 28 56 90
Days C o m p re s s iv e s tr e n g th ( M P a ) w/b=0.6 w/b=0.55 w/b=0.5 w/b=0.45 7 days 0 5 10 15 20 25 30 35 40
0.6 0.55 0.5 0.45
w/b ratio C o m p re s s iv e s tr e n g th ( M P a ) Control mix 10% RHA 20% RHA 10% RHA-15%FA 10%RHA-25%FA 28 days 0 10 20 30 40 50 60
0.6 0.55 0.5 0.45
w/b ra tio
C o m p re s s iv e S tr e n g th ( M P a ) Control mix 10% RHA 20% RHA 10%RHA-15%FA 10%RHA-25%FA 56 days 0 10 20 30 40 50 60
0.6 0.55 0.5 0.45
w /b ra tio
C o m p re s s iv e S tr e n g th ( M P a ) Control mix 10%RHA 20%RHA 10%RHA-15%FA 10%RHA-25%FA 90 days 0 10 20 30 40 50 60 70
0.6 0.55 0.5 0.45
From these figures, it is observed that:
The 7 day compressive strength is almost same for all mixes of concrete at w/b ratio 0.6. However at all other w/d ratios, the control mix exhibited higher compressive strength as compared to other concrete mixes. This may be due to the slow pozzolanic reaction in concrete mixes prepared with mineral admixtures.
At the age of 28 days, the control mix exhibited lower strength as compared to binary and ternary blends at almost all w/b ratios. This may be due to the more production of C-S-H gel due to pozzolanic reaction.
The similar behavior was observed in the concrete mixes at the age of 56 days and 90 days. In addition, 20%RHA concrete mix exhibited higher compressive strength as compared to other mixes at the age of 56 days and 90 days for all w/b ratios. This may be due to the combined effect of hydration and pozzolanic reaction in 20% RHA mix.
Rebound Hammer test:
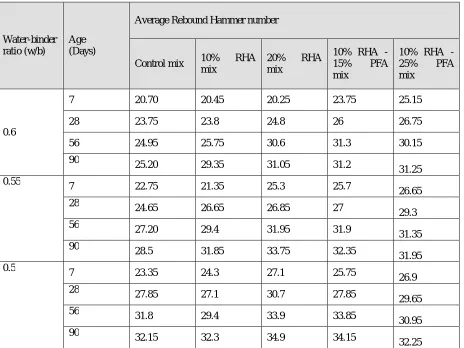
The Rebound hammer test was carried out on cubes made from control, 10% RHA, 20% RHA, 10% RHA-15%PFA and 10% RHA-25% PFA mix. The cubes for testing are taken out of curing and dried for 24 hrs. The rebound hammer test was carried on two vertical faces of each cube with 6 impacts on each face. The minimum distance between successive impacts or from the edges is taken as per guidelines given in IS-13311-Part 2: 1992 [13]. Then the average of 12 readings is taken to represent the Rebound hammer value for that particular mix and age. The values of rebound hammer value for control, 10% RHA, 20% RHA, 10% RHA-15%PFA and 10% RHA-25% PFA mix are in Table 3.7 respectively.
Table 3.Rebound hammer values for all concrete mixes
Water-binder ratio (w/b)
Age (Days)
Average Rebound Hammer number
Control mix 10% RHA mix
20% RHA mix
10% RHA -15% PFA mix
10% RHA -25% PFA mix
0.6
7 20.70 20.45 20.25 23.75 25.15
28 23.75 23.8 24.8 26 26.75
56 24.95 25.75 30.6 31.3 30.15
90
25.20 29.35 31.05 31.2 31.25
0.55 7 22.75 21.35 25.3 25.7
26.65 28 24.65 26.65 26.85 27
29.3 56 27.20 29.4 31.95 31.9
31.35 90 28.5 31.85 33.75 32.35
31.95 0.5
7 23.35 24.3 27.1 25.75 26.9
28 27.85 27.1 30.7 27.85
29.65 56 31.8 29.4 33.9 33.85
0.45 7 30 27.7 28.15 28.6
28.3 28 32.35 28.9 32.55 30.15
30.25 56
34.65 31.1 35.25 34.5 32.7
90 35.6 33.25 37.1 35.75
33.35
From the above table, it is observed that:
The Rebound hammer number increased with age and decreased with increase in water-binder ratio.
As w/b ratios of 0.55 and 0.6 the control mix exhibited lower rebound number as compared to binary and ternary blends at almost all ages except at age of 7 days. In addition both the ternary blends showed higher rebound number values as compared to control and binary blends at all ages. This may be due to filler effect of fine particles of rice husk ash and fly ash.
At w/b ratio of 0.45, the binary and ternary blends exhibit higher rebound number values as compared to control mix at all ages except very few results.
At w/b ratio of 0.45, there is no systematic variation in rebound number values in all the concrete mixes at different ages.
Ultrasonic Pulse Velocity (USPV) test:
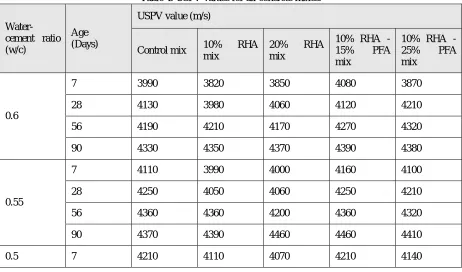
USPV cubes were carried out on cubes made from control mix, 10%RHA mix, 20%RHA, 10% RHA – 15% FA and 10% RHA – 25% FA. The test was carried out by placing the transmitting and receiving transducers exactly opposite to each other on two opposite sides of the cube. The position of the both the transducers are changed and the average value of USPV was then calculated. The results of USPV values for control mix, 10%RHA mix, 20%RHA, 10% RHA – 15% FA and 10% RHA – 25% FA are presented in Table 3.8.
Table 4. USPV values for all concrete mixes.
Water-cement ratio (w/c)
Age (Days)
USPV value (m/s)
Control mix 10% RHA mix
20% RHA mix
10% RHA -15% PFA mix
10% RHA -25% PFA mix
0.6
7 3990 3820 3850 4080 3870
28 4130 3980 4060 4120 4210
56 4190 4210 4170 4270 4320
90 4330 4350 4370 4390 4380
0.55
7 4110 3990 4000 4160 4100
28 4250 4050 4060 4250 4210
56 4360 4360 4200 4360 4320
90 4370 4390 4460 4460 4410
28 4330 4230 4120 4370 4280
56 4420 4340 4240 4400 4360
90 4560 4430 4520 4510 4450
0.45
7 4340 4180 4100 4270 4170
28 4450 4310 4340 4380 4320
56 4460 4440 4450 4490 4390
90 4550 4480 4590 4560 4480
From the above tables, it is observed that:
1. USPV values increased with decrease in w/b ratio and increase in curing age. The improved microstructure of concrete at lower, w/b ratio. Similarly the increase in USPV values with age is due to the continuous hydration and more production of C-S-H gel.
2. The ternary mix of 10%RHA-15%FA has exhibited higher USPV values at all ages compared to other concrete mixes at w/b ratios of 0.5, 0.55 and 0.6. This might be due to the filler effect of fine particles of rice husk ash and fly ash.
3. At w/b ratio of 0.45, the binary and ternary blends exhibit lower USPV values as compared to control mix at almost all ages. This may be because of the presence of micro cracks; those are developed due to availability of very less space at lower w/b ratio to accommodate the products of hydration and pozzolanic reaction in binary and ternary blends.
VI.CONCLUSIONS
In this present experimental investigation, the effect of binary and ternary blends on different properties of concrete are studied. In binary mix, RHA replacement levels are 0%, 10% and 20% by mass whereas in ternary blends, RHA is replaced by 10% and FA is replaced by 15% and 25% by mass. The w/b ratios adopted in the investigation are 0.45, 0.5, 0.55 and 0.6. The compressive strength and non-destructive tests were carried out at ages of 7, 28, 56 and 90 days. On the basis of results obtained, the following conclusions have been drawn.
On the basis of a number of trail tests, a suitable dosage of superplasticizer was selected to get the required workability in binary and ternary blends.
Compressive strength of cubes made from all concrete mixes increased with increase in age and decreased with increase in w/b ratio.
At the age of 7 days, the control mix exhibited higher compressive strength as compared to binary and ternary blends at almost all w/b ratios. This is due to the effect of slow pozzolanic reaction in binary and ternary blends.
At ages of 28 days, 56 days and 90 days, the binary and ternary blends exhibited higher compressive strength as compared to control mix at almost all w/b ratio. This may be due to combined effect of hydration and pozzolanic reaction in binary and ternary blends at later ages. Out of all mixes 20%RHA mix has exhibited highest compressive strength values at higher ages, this might be due to the combined effect of hydration process and pozzolanic reaction. In all concrete mixes, rebound number increased with age. In addition rebound number increased with decrease in w/b ratio, indicating harder surface of concrete cubes with lower w/b ratio.
Similarly ultrasonic pulse velocity (USPV) values increased with decrease in w/b ratio and increase in age in all the concrete mixes. Thus the quality of concrete was comparatively better in mixes made with lower w/b ratio than the higher ones.
The ternary blend of 10%RHA-15%FA exhibited higher USPV values than other concrete mixes for all w/b ratios except w/b ratio 0.45. The binary and ternary blend showed lower USPV values as compared to control mix at lower w/b ratio 0.45
There exists a linear relationship between compressive strength and rebound hammer number; and between compressive strength and USPV values.
REFERENCES
1. Shan Somayaji (2001). “Civil Engineering Materials- second edition” produced by Prentice Hall Inc; New Jersey.
2. satish IS. “Non-destructive testing of concrete – Methods of test- Part1 ultrasonic pulse velocity test”, Bureau of Indian standards, New Delhi 3. Niranjan. “Non-destructive testing of concrete – Methods of test-Part2 Rebound hammer”, Bureau of Indian standards, New Delhi
4. J. Bhargava., and K. Lundberg (1972). “Determination of moisture content of concrete by microwave-resonance method.” Materials and Structures; Vol.5, no3, pp.165-168.
5. Saetta, A.V., Schrefler, B.A., and Vitaliani, R.V (1993). “The carbonation of concrete and the mechanism of moisture, heat and carbon dioxide flow through porous material.” Cement Concrete Research; Vol.23, no4, pp.761-772.
6. Shazim Ali Memon, Muhammad Ali Shaikh, Hassan Akbar (2008). “Production of Low Self Compacting Concrete using Rice Husk Ash.” Advancing and Integrating Construction Education, Research and Practice; ICCIDC-I
7. Muhammad, S.I., and Waliuddin, A.M (1996). “Effects of Rice Husk Ash on High Strength Concrete.” Construction and Building Materials; Vol.10, pp.521-526.