ISSN(Online): 2319-8753 ISSN (Print): 2347-6710
International Journal of Innovative Research in Science,
Engineering and Technology
(An ISO 3297: 2007 Certified Organization)
Website: www.ijirset.com
Vol. 6, Issue 7, July 2017
Novel Approach to Prediction of Diabetes
using Classification Mining Algorithm
R. Manimaran1, Dr. M.Vanitha2
Research Scholar, PG and Research Department of Computer Science, J.J.College of Arts and Science (Autonomous),
Pudukkottai, Tamilnadu, India.1
Assistant Professor, Department of Computer Applications, Alagappa University, Karaikudi, India.2
ABSTRACT: Data mining applications are necessity in healthcare today, because healthcare sectors have rich information. Healthcare data includes Patient general data, treatment data, and resource management data. Data Mining can extract hidden relationships and trends in data can be discovered from the application of data mining techniques. In this research, using classification technique of 1024 complete instances of 26 parameter dataset. These datasets are collected from more peoples from various districts. To increase the efficiency of mining process, some pre-processing needs to be done to the data. A suitable technique for a particular dataset is chosen based on highest classification accuracy and least error rate. This paper aims at finding solution to predict the Diabetes by analyzing the data through Classification analysis. The research hopes to propose an easy and efficient technique of Prediction of the Diabetes patients.
KEYWORDS: Classification, Data Mining, Decision Tree, and, Diabetes.
I. INTRODUCTION
Diabetes is most dangerous disease in the 21st century in the world. Diabetes is affected the human life time. Diabetes is unique in case of mothers because the disease is transmitted to their unborn children. Diabetes may develop serious complications such as heart diseases, Strokes, blindness, Premature Death, and kidney failure. This paper aims to propose an easy and efficient technique of Prediction of the Diabetes patients.
Basically a person is may be suffered from diabetes, when blood sugar levels are above normal. A diabetic patient has low production of insulin or their body is not able to use the insulin properly. There are three types of diabetes, Type 1, Type 2 and Gestational [1]. Type 1 – Diabetes was previously called “Insulin-Dependent Diabetes Mellitus” or “Juvenile-Onset Diabetes”. Although disease can occur at any age, the peak age for diagnosis is in young age of below 20. Type1 diabetes develops when the cells that produce the hormone insulin, known as the beta cells, in the pancreas are destroyed. Type1 diabetes accounts for approximately 5% of all diagnosed cases of diabetes. Type 2 - Diabetes was previously called non–insulin-dependent diabetes or adult-onset diabetes because the peak age of onset is usually later than type 1 diabetes. Type2 diabetes accounts for about 90% to 95% of all diagnosed cases of diabetes. Gestational - Diabetes tends to occur in pregnant women, as the pancreas don’t make sufficient amount of insulin. All these types of diabetes need treatment and if they are detected at an early state, one can avoid the complications associated with them [3].
ISSN(Online): 2319-8753 ISSN (Print): 2347-6710
International Journal of Innovative Research in Science,
Engineering and Technology
(An ISO 3297: 2007 Certified Organization)
Website: www.ijirset.com
Vol. 6, Issue 7, July 2017
In this paper, Decision Tree algorithm has been employed on a pre-existential dataset to predict whether diabetes is recorded or not in a patient. The main objectives of this work is present a Decision Tree for diabetes prediction.
II. OVERVIEW OF DIABETES
2.1. Diabetes
Diabetes is a condition in which our body is unable to produce the required amount of insulin needed to regulate the amount of sugar in the body. Diabetes is a disease that occurs when the insulin production in the body. There are three types of diabetes, Type 1, Type 2 and Gestational.
2.2. Types of Diabetes
The three main types of diabetes are described below:
1. Type 1 – Though there are only about 10% of diabetes patients have this form of diabetes, recently, there has been a rise in the number of cases of this type in the United States. The disease manifest as an autoimmune disease occurring at a very young age of below 20 years hence also called juvenile-onset diabetes. In this type of diabetes, the pancreatic cells that produce insulin have been destroyed by the defense system of the body. Injections of insulin along with frequent blood tests and dietary restrictions have to be followed by patients suffering from Type 1 diabetes.
2. Type 2 – This type accounts for almost 90% of the diabetes cases and commonly called the adult-onset diabetes or the non-insulin dependent diabetes. In this case the various organs of the body become non-insulin resistant, and this increases the demand for insulin. At this point, pancreas doesn’t make the required amount of insulin. To keep this type of diabetes at bay, the patients have to follow a strict diet, exercise routine and keep track of the blood glucose. Obesity, being overweight, being physically inactive can lead to type 2 diabetes. Also with ageing, the risk of developing diabetes is considered to be more. Majority of the Type 2 diabetes patients have border line diabetes or the Pre-Diabetes, a condition where the blood glucose levels are higher than normal but not as high as a diabetic patient.
3. Gestational diabetes – is a type of diabetes that tends to occur in pregnant women due to the high sugar levels as the pancreas don’t produce sufficient amount of insulin. Taking no treatment can lead to complications during childbirth. Controlling the diet and taking insulin can control this form of diabetes.
All these types of diabetes are serious and need treatment and if they are detected at an early state, one can avoid the complications associated with them.
2.3 Symptoms for Diabetes
The common symptoms of a person suffering from diabetes are: • Polyuria - frequent urination
• Polyphagia - excessive hunger • Polydipsia - excessive thirst • blurred vision
• Weight gain or loss and etc.
III. RELATED WORK
Design of prediction models for diabetes diagnosis has been an active research area for the past decade. Most of the models found in literature are based on clustering algorithms and artificial neural networks.
ISSN(Online): 2319-8753 ISSN (Print): 2347-6710
International Journal of Innovative Research in Science,
Engineering and Technology
(An ISO 3297: 2007 Certified Organization)
Website: www.ijirset.com
Vol. 6, Issue 7, July 2017
The paper [8] approached the aim of diagnoses by using artificial neural networks and demonstrated the need for preprocessing and replacing missing values in the dataset being considered. Through the modified training set, a better accuracy was achieved with lesser time required for training the set. Finally in [9] a neural network model for prediction of diabetes based on 13 early symptoms of the disease was created with implementation using MATLAB.
In all the related work analytical techniques have been employed to produce reliable results but generally the methods is time consuming since most employed a weighted approach.
Hence, there is a requirement of a model that can be developed easily providing reliable, faster and cost effective methods to provide information of the probability of a patient to have diabetes. In this work is made to analyze the diabetes parameters and to establish a Decision Tree approach.
IV. OVERVIEW OF METHODOLOGIES
The present work intends to create a mining model based on classification algorithms in order to provide a simpler solution to the problem of diagnosis of diabetes.
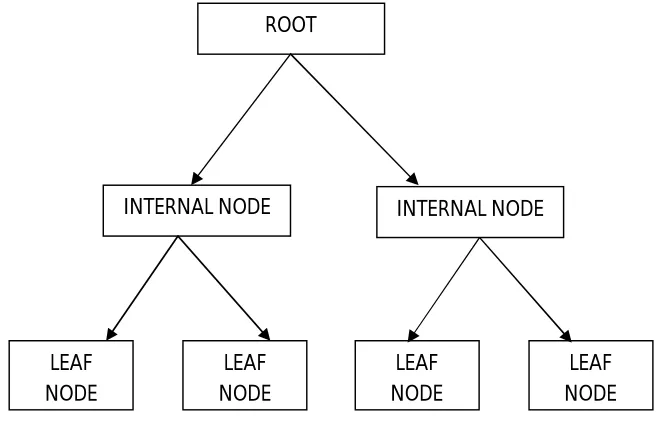
4.1. Decision Trees
Decision tree [2] is a tree structure, which is in the hierarchical form of a flowchart. It is used as a method for classification and prediction with representation using nodes. The root and internal nodes are the test cases that are used to separate the instances with different features. Internal nodes themselves are the result of attribute test cases. Leaf nodes denote the class variable.
Figure 1. Shows a sample decision tree structure
Decision tree provides a powerful technique for classification and prediction in Diabetes Diagnosis problem. Various decision tree algorithms are available to classify the data, including MLP, C4.5, BayesNet, J48, CART and FLP. In this paper, J48 decision tree algorithm [10] has been chosen to establish the model.
ROOT
INTERNAL NODE INTERNAL NODE
LEAF NODE
LEAF NODE
LEAF NODE
ISSN(Online): 2319-8753 ISSN (Print): 2347-6710
International Journal of Innovative Research in Science,
Engineering and Technology
(An ISO 3297: 2007 Certified Organization)
Website: www.ijirset.com
Vol. 6, Issue 7, July 2017
V. METHODOLOGIES 5.1. Dataset Description and Pre-Processing
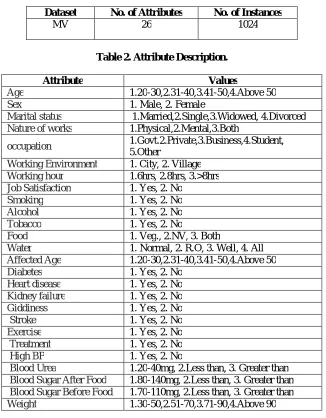
The paper explores the aspect of Decision Tree as Data Mining techniques in determining diabetes. The main objective is to forecast if the patient has been affected by diabetes using the data mining tools by using the MV dataset. This dataset contain 1024 complete instances of 26 Parameter. MV dataset was collected more peoples from various district using Questioners.
Table1. Shows a brief description of the dataset that is being considered.
Dataset No. of Attributes No. of Instances
MV 26 1024
Table 2. Attribute Description.
Attribute Values
Age 1.20-30,2.31-40,3.41-50,4.Above 50
Sex 1. Male, 2. Female
Marital status 1.Married,2.Single,3.Widowed, 4.Divorced
Nature of works 1.Physical,2.Mental,3.Both
occupation 1.Govt.2.Private,3.Business,4.Student,
5.Other
Working Environment 1. City, 2. Village
Working hour 1.6hrs, 2.8hrs, 3.>8hrs
Job Satisfaction 1. Yes, 2. No
Smoking 1. Yes, 2. No
Alcohol 1. Yes, 2. No
Tobacco 1. Yes, 2. No
Food 1. Veg., 2.NV, 3. Both
Water 1. Normal, 2. R.O, 3. Well, 4. All
Affected Age 1.20-30,2.31-40,3.41-50,4.Above 50
Diabetes 1. Yes, 2. No
Heart disease 1. Yes, 2. No
Kidney failure 1. Yes, 2. No
Giddiness 1. Yes, 2. No
Stroke 1. Yes, 2. No
Exercise 1. Yes, 2. No
Treatment 1. Yes, 2. No
High BP 1. Yes, 2. No
Blood Urea 1.20-40mg, 2.Less than, 3. Greater than
Blood Sugar After Food 1.80-140mg, 2.Less than, 3. Greater than
Blood Sugar Before Food 1.70-110mg, 2.Less than, 3. Greater than
ISSN(Online): 2319-8753 ISSN (Print): 2347-6710
International Journal of Innovative Research in Science,
Engineering and Technology
(An ISO 3297: 2007 Certified Organization)
Website: www.ijirset.com
Vol. 6, Issue 7, July 2017
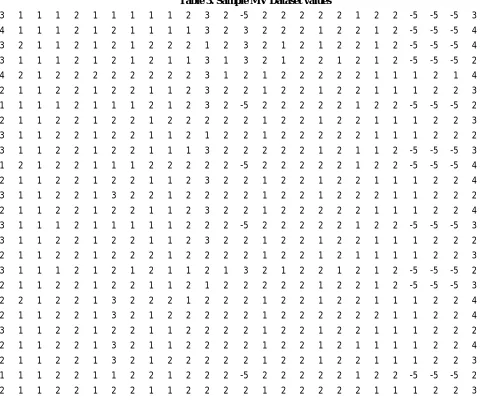
Pre-processing and transformation of the dataset are done. Transformation steps include:
• Replacing missing values, and • Normalization of values.
Table 3. Sample MV Dataset values
3 1 1 1 2 1 1 1 1 1 2 3 2 -5 2 2 2 2 2 1 2 2 -5 -5 -5 3
4 1 1 1 2 1 2 1 1 1 1 3 2 3 2 2 2 1 2 2 1 2 -5 -5 -5 4
3 2 1 1 2 1 2 1 2 2 2 1 2 3 2 1 2 1 2 2 1 2 -5 -5 -5 4
3 1 1 1 2 1 2 1 2 1 1 3 1 3 2 1 2 2 1 2 1 2 -5 -5 -5 2
4 2 1 2 2 2 2 2 2 2 2 3 1 2 1 2 2 2 2 2 1 1 1 2 1 4
2 1 1 2 2 1 2 2 1 1 2 3 2 2 1 2 2 1 2 2 1 1 1 2 2 3
1 1 1 1 2 1 1 1 2 1 2 3 2 -5 2 2 2 2 2 1 2 2 -5 -5 -5 2
2 1 1 2 2 1 2 2 1 2 2 2 2 2 1 2 2 1 2 2 1 1 1 2 2 3
3 1 1 2 2 1 2 2 1 1 2 1 2 2 1 2 2 2 2 2 1 1 1 2 2 2
3 1 1 2 2 1 2 2 1 1 1 3 2 2 2 2 2 1 2 1 1 2 -5 -5 -5 3
1 2 1 2 2 1 1 1 2 2 2 2 2 -5 2 2 2 2 2 1 2 2 -5 -5 -5 4
2 1 1 2 2 1 2 2 1 1 2 3 2 2 1 2 2 1 2 2 1 1 1 2 2 4
3 1 1 2 2 1 3 2 2 1 2 2 2 2 1 2 2 1 2 2 2 1 1 2 2 2
2 1 1 2 2 1 2 2 1 1 2 3 2 2 1 2 2 2 2 2 1 1 1 2 2 4
3 1 1 1 2 1 1 1 1 1 2 2 2 -5 2 2 2 2 2 1 2 2 -5 -5 -5 3
3 1 1 2 2 1 2 2 1 1 2 3 2 2 1 2 2 1 2 2 1 1 1 2 2 2
2 1 1 2 2 1 2 2 2 1 2 2 2 2 1 2 2 1 2 1 1 1 1 2 2 3
3 1 1 1 2 1 2 1 2 1 1 2 1 3 2 1 2 2 1 2 1 2 -5 -5 -5 2
2 1 1 2 2 1 2 2 1 1 2 1 2 2 2 2 2 1 2 2 1 2 -5 -5 -5 3
2 2 1 2 2 1 3 2 2 2 1 2 2 2 1 2 2 1 2 2 1 1 1 2 2 4
2 1 1 2 2 1 3 2 1 2 2 2 2 2 1 2 2 2 2 2 2 1 1 2 2 4
3 1 1 2 2 1 2 2 1 1 2 2 2 2 1 2 2 1 2 2 1 1 1 2 2 2
2 1 1 2 2 1 3 2 1 1 2 2 2 2 1 2 2 1 2 1 1 1 1 2 2 4
2 1 1 2 2 1 3 2 1 2 2 2 2 2 1 2 2 1 2 2 1 1 1 2 2 3
1 1 1 2 2 1 1 2 2 1 2 2 2 -5 2 2 2 2 2 1 2 2 -5 -5 -5 2
2 1 1 2 2 1 2 2 1 1 2 2 2 2 1 2 2 2 2 2 1 1 1 2 2 3
ISSN(Online): 2319-8753 ISSN (Print): 2347-6710
International Journal of Innovative Research in Science,
Engineering and Technology
(An ISO 3297: 2007 Certified Organization)
Website: www.ijirset.com
Vol. 6, Issue 7, July 2017
0 200 400 600 800
Tested Positive Tested Negative
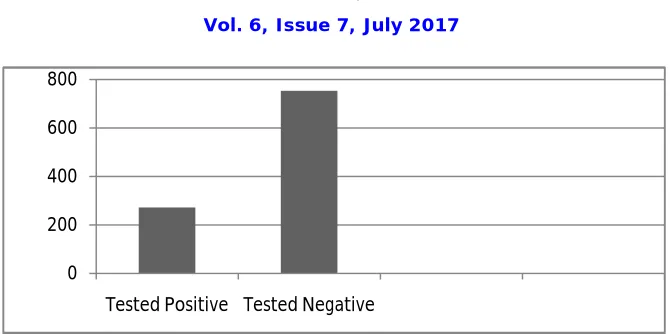
Figure. 2 show the distribution of the diabetes class attribute in the dataset.
MV dataset there are 1024 instances are available, among these instances only 272 persons are affected by diabetes and remaining 752 peoples are not affected by diabetes.
VI. RESULTS AND ANALYSIS
6.1 J48 Decision Tree
J48 can be used for classification of whether a patient has tested positive or negative for diabetes.
Classifier Output
i. Based on Cross-Validation Technique
The J48 algorithm gives the following correctness results for the given dataset.
Table 4. Performance Results from J48 Classification Algorithm – Cross Validation
Table 5. Confusion Matrix – Cross Validation
ii. Based on Percentage Split (70:30) Technique
Since a 70:30 percentage split was applied on the dataset 307 of the instances were used as the test dataset while the rest of were using for training the model. The J48 algorithm gives the following correctness results for the given dataset.
Result No. of Instances Percentage
Correctly Classified Instances 856 83.5937 %
Incorrectly Classified Instances 168 16.4063 %
POSITIVE NEGATIVE
POSITIVE 257 16
ISSN(Online): 2319-8753 ISSN (Print): 2347-6710
International Journal of Innovative Research in Science,
Engineering and Technology
(An ISO 3297: 2007 Certified Organization)
Website: www.ijirset.com
Vol. 6, Issue 7, July 2017
Table 6. Performance Results from J48 Classification Algorithm – Percentage Split
Table 7. Confusion Matrix – Percentage Split
6.2. Analysis
From the results obtained the method have a comparatively small difference in error rate, though the percentage split of 70:30 for J48 technique gives the least error rate as the model is efficient in the prediction of diabetes using the percentage split of 70:30 of the dataset. A developed model for prediction of diabetes will require more training data for creation and testing.
VII. CONCLUSIONS
The first Cross-Validation Technique result of algorithm execution on the original data showed that we get accuracy 83.5937 % and the Percentage Split (70:30) Technique, it gave us accuracy 85.0163 %.
The automatic diagnosis of diabetes is an important real-world medical problem. Detection of diabetes in its early stages is the key for treatment. This paper shows how Decision Trees is used to predicting diabetes for local and systematic treatment, along with presenting related work in the field. Experimental results show the effectiveness of the proposed model. This study discovers the parameters of Work Place, Age, Occupation and Job Satisfaction are one of the reasons for diabetes. Diabetes may contribute to other diseases like heart attack, stroke.
In future it is planned to gather the information from different locales over the world and make a more precise and general prescient model for prediction of diabetes.
REFERENCES
[1] Global Diabetes Community, http://www.diabetes.co.uk/diabetes_care/blood-sugar-level-ranges.html
[2] Jiawei Han and Micheline Kamber, "Data Mining Concepts and Techniques”, Morgan Kauffman Publishers, 2001 [3] National Diabetes Information Clearinghouse (NDIC), http://diabetes.niddk.nih.gov/dm/pubs/type1and2/#signs
[4] Mostafa Fathi Ganji and Mohammad Saniee Abadeh, “Using fuzzy Ant Colony Optimization for Diagnosis of Diabetes Disease”, Proceedings of ICEE 2010, May 11-13, 2010
[5] Sankaranarayanan.S and Dr Pramananda Perumal.T, “Predictive Approach for Diabetes Mellitus Disease through Data Mining Technologies”, World Congress on Computing and Communication Technologies, 2014, pp. 231-233
[6] C. M. Velu and K. R. Kashwan, “Visual Data Mining Techniques for Classification of Diabetic Patients”, 3rd IEEE International Advance Computing Conference (IACC), 2013
[7] S. Kumari and A. Singh, “A Data Mining Approach for the Diagnosis of Diabetes Mellitus”, Proceedings of Seventh lnternational Conference on Intelligent Systems and Control, 2013, pp. 373-375
[8] T.Jayalakshmi and Dr.A.Santhakumaran, “A Novel Classification Method for Diagnosis of Diabetes Mellitus Using Artificial Neural Networks”, International Conference on Data Storage and Data Engineering, 2010, pp. 159-163
[9] Sonu Kumari and Archana Singh, “A Data Mining Approach for the Diagnosis of Diabetes Mellitus”, Proceedings of71hlnternational Conference on Intelligent Systems and Control (ISCO 2013)
[10] Neeraj Bhargava, Girja Sharma, Ritu Bhargava and Manish Mathuria, Decision Tree Analysis on J48 Algorithm for Data Mining. Proceedings of International Journal of Advanced Research in Computer Science and Software Engineering, Volume 3,
Issue 6, June 2013.[11] Michael Feld, Dr. Michael Kipp, Dr. Alassane Ndiaye and Dr. Dominik Heckmann “Weka: Practical machine learning tools and techniques with Java implementations”
[12] White, A.P., Liu, W.Z.: Technical note: Bias in information-based measures in decision tree induction. Machine Learning 15(3), 321–329 (1994)
Result No. of Instances Percentage
Correctly Classified Instances 261 85.0163 %
Incorrectly Classified Instances 46 14.9837 %
POSITIVE NEGATIVE
POSITIVE 85 19