DOI: 10.1534/genetics.109.110163
The Genetic Signature of Conditional Expression
J. David Van Dyken
1and Michael J. Wade
Department of Biology, Indiana University, Bloomington, Indiana 47405
Manuscript received September 23, 2009 Accepted for publication December 1, 2009
ABSTRACT
Conditionally expressed genes have the property that every individual in a population carries and transmits the gene, but only a fraction,f, expresses the gene and exposes it to natural selection. We show that a consequence of this pattern of inheritance and expression is a weakening of the strength of natural selection, allowing deleterious mutations to accumulate within and between species and inhibiting the spread of beneficial mutations. We extend previous theory to show that conditional expression in space and time have approximately equivalent effects on relaxing the strength of selection and that the effect holds in a spatially heterogeneous environment even with low migration rates among patches. We support our analytical approximations with computer simulations and delineate the parameter range under which the approximations fail. We model the effects of conditional expression on sequence polymorphism at mutation–selection–drift equilibrium, allowing for neutral sites, and show that sequence variation within and between species is inflated by conditional expression, with the effect being strongest in populations with large effective size. As f decreases, more sites are recruited into neutrality, leading to pseudogenization and increased drift load. Mutation accumulation diminishes the degree of adaptation of conditionally expressed genes to rare environments, and the mutational cost of phenotypic plasticity, which we quantify as theplasticity load, is greater for more rarely expressed genes. Our theory connects gene-level relative polymorphism and divergence with the spatial and temporal frequency of environ-ments inducing gene expression. Our theory suggests that null hypotheses for levels of standing genetic variation and sequence divergence must be corrected to account for the frequency of expression of the genes under study.
I
N genetically and ecologically subdivided popula-tions, some individuals will experience a local environment very different from others, making it difficult to evolve a single adaptation adequate for all local conditions. Phenotypic plasticity allows organisms to respond adaptively to spatially and temporally varying environments by developing alternative phenotypes that enhance fitness under local conditions (Scheiner1993;Viaet al.1995). Examples of alternative phenotypes,i.e.,
polyphenisms, include the defensive morphologies in Daphnia and algae induced by the presence of predators (e.g., Lively1986; DeWitt1998; Harvell
1998; Hazel et al. 2004); the winged and wingless
morphs of bean beetles responding to resource variation (e.g., Abouheif and Wray 2002; Roff and
Gelinas2003; Lommenet al.2005); and bacterial genes
involved in traits such as quorum sensing, antibiotic production, biofilm formation, and virulence (Fuqua et al.1996). The developmental basis of such alternative phenotypes often lies in the inducible expression of some genes in some individuals by environmental variables. That is, all individuals carry and transmit the
condi-tionally expressed genes but only a fraction of individ-uals, f, express them when environmental conditions are appropriate.
The genes underlying plastic traits should experience relaxed selection due to conditional expression. Wade and co-workers have shown that genes hidden from natural selection in a fraction of individuals in the population by X-linked (Whitlock and Wade 1995;
Linksvayerand Wade2009) or sex-limited expression
(Wade 1998; Demuth and Wade 2007) experience
relaxed selective constraint. InDrosophilaspp., sequence data for genes with maternally limited expression quantitatively support the theoretical predictions both for within-species polymorphism (Barker et al. 2005;
Cruickshankand Wade2008) and for between-species
divergence (BarkerEt Al 2005; Demuth and Wade
2007; Cruickshank and Wade 2008). Furthermore,
male-specific genes in the facultatively sexual pea aphid have been shown to have elevated levels of sequence variation due to relaxed selection (Brissonand Nuzhdin
2008). Genes with spatially restricted expression in a heterogeneous environment should likewise experi-ence relaxed selection. Adaptation to the most common environment in an ecologically subdivided population (Rosenzweig 1987; Holt and Gaines 1992; Holt
1996) allows deleterious mutations to accumulate in 1Corresponding author:Department of Biology, 1001 E. Third Street,
Bloomington, IN 47405. E-mail: [email protected]
traits expressed in rare environments (Kawecki1994;
Whitlock1996).
Here we extend these results by quantifying the consequences of relaxed selection on conditionally expressed genes. Specifically, we show that, with weak selection, spatial and temporal fluctuations in selection intensity generate approximately equivalent effects on mean trait fitness, even with low rates of migration between habitats, resulting in a great simplification of analytical results. Our analytical approximations are supported with deterministic and stochastic simulations, and we note the conditions under which the approx-imations fail. We then derive general expressions for (1) the expected level of sequence polymorphism within populations under mutation, migration, drift, and puri-fying selection with conditional gene expression; (2) the rate of sequence divergence among populations, for dominant and recessive mutations; and (3) the reduc-tion in mean populareduc-tion fitness due to accumulareduc-tion of deleterious mutations at conditionally expressed loci. We find that the rate of accumulation of deleterious mutations for conditionally expressed genes is acceler-ated and the probability of fixation of beneficial muta-tions is reduced, causing a reduction in the fitness of conditional traits and an inflation in sequence variation within and between species. Our results suggest that evolutionary null hypotheses must be adjusted to ac-count for the frequency of expression of genes under study, such that signatures of elevated within- or between-species sequence variation are not necessarily evidence of the action of diversifying natural selection. Further-more, if conditional expression is due to spatial hetero-geneity, we show that the level of genetic variation in a sample will often depend on whether or not genotypes were sampled from the selective habitat, the neutral hab-itat, or both. In thediscussionwe address the scope
and limitations of our theory, as well as its implications for the maintenance of genetic variation, adaptive di-vergence between species, constraints on phenotypic plasticity, and evolutionary inference from sequence data.
RESULTS
The model
Conditionally expressed genes are defined as those genes in a population not expressed by every individual or in every generation. In particular, we examine three types of conditionally expressed genes: (1) those ex-pressed by only a fraction,f, of all individuals at every generation; (2) those expressed by all individuals but only for a subset of generations,g, over an interval ofT
generations, wheref¼(g/T); and (3) those expressed by a fraction of the population over a subset of gener-ations in an interval. In each case, the expressed fraction of all gene copies,f, is subject to natural selection but
the unexpressed fraction, (1 – f), is affected only by the forces of mutation and drift. As a result, the strength of natural selection acting on conditionally expressed genes is weaker than it is on constitutively expressed genes. Examples of conditionally expressed genes include recessives (expressed only in homozy-gotes), genes with sex-limited effects (expressed only in one but not in the other sex), and inducible genes (expressed only or predominantly by individuals ex-periencing the inducing environments). Another type of conditionally expressed gene, ‘‘caste genes’’ ex-pressed only in the sterile workers of the eusocial social insects, has been modeled by Linksvayerand
Wade(2009).
Sequence polymorphism within populations
Expression in a fraction of individuals, f, at every generation:First, we consider the effects of deleterious mutations at a conditionally expressed locus. Through-out, we compare two loci with identical selective and demographic parameters, where one locus is condition-ally expressed while the other is constitutively expressed. We begin by considering a haploid population for ease of demonstration, although all methods can be readily extended to diploids. Let there be two alleles,Aanda, where A is wild type and a is deleterious. When not expressed, the fitness of the deleterious allele at a conditionally expressed locus,wa, is equal to 1;i.e.,it is neutral because it is not expressed. When the mutation is expressed, its fitness becomeswa¼1s, wheresis the strength of selection against the deleterious mutation manifest by the decreased viability of those carrying the gene. The average fitness of a conditionally expressed deleterious allele within a population consisting of f expressers and (1 f) nonexpressers is wa ¼ fð1Þ1ð1fÞð1sÞ ¼1fs. We denote the average selection against the allele assc ¼fs, where the sub-script, c, indicates the selection coefficient associated with the conditionally expressed allele.
Assuming large population size and smalls, population genetic theory (e.g., Crowand Kimura1970, pp. 58–62)
has shown that, at mutation–selection balance, a con-stitutive deleterious mutant allele expressed in every individual in every generation will have an equilibrium frequency of ˆq¼u=s, where u is the per-locus rate of mutation to the deleterious allele. In contrast, if con-ditionally expressed, a deleterious allele would have an equilibrium frequency ofˆqc¼u=fs. Hence, the relative equilibrium allele frequency of a conditionally expressed gene to a constitutively expressed paralog is
Rp¼ ðu=scÞ
ðu=sÞ ¼1=f: ð1Þ
easily shown that Equation 1 also holds for diploids with arbitrary dominance.
Expression by all individuals but only in a fraction,
f, of all generations: Let f be the fraction of gen-erations,g, over an interval ofTgenerations when the conditional gene is expressed (f¼g/T). With discrete generations, the average fitness of such an allele, wG, equals its geometric mean fitness (Crowand Kimura
1970; Frankand Slatkin1990), which can also be seen
from the multiplicative gene frequency recursion. Thus, we find that wG¼ ð1sÞ
f
ð1Þ1f¼ ð1sÞf. This is equivalent to an average, per-generation selection co-efficient,sc, equal to 1(1s)f.
Following the same logic as above, we find that the relative equilibrium allele frequency of a conditionally expressed gene to a constitutively expressed paralog is
Rp¼ ðu=scÞ
ðu=sÞ ¼ s
1 ð1sÞf: ð2Þ
Numerical investigation shows that Rp is much more sensitive tofthan tos. That is, varyingsby many orders of magnitude (13 1011 , s , 13 101) results in a change in Rpof only 5% for any of a wide range of f values (Figure 1A). Analytically, we can assume thatsis small, so that (1s)f
1sf. With this assumption, we see thatscsf, as above, allowing us to reduce Equation 2 to
Rp
1
f: ð3Þ
Our result conforms to the intuitive expectation that a conditional trait expressed half the time over an interval ofTgenerations (f¼0.50), or in half of the individuals all of the time, will accumulate twice as much mutational variation (Rp1/0.50¼2) as a constitutively expressed trait under approximately the same strength of selec-tion and mutaselec-tion pressure (Figure 1A).
Expression in some individuals, some of the time:
We can combine the two cases above into a single expression if we distinguish the two separate contribu-tions to f, as fI (the fraction of individuals within a generation) and fG (the fraction of generations). In this combined case, the average, per-generation selec-tion coefficient,sc, equals 1(1 sfI)fG. When sis assumed to be small,ð1sfIÞfG 1sfIfG.
Here, the relative equilibrium allele frequency of a conditionally expressed gene to a constitutively ex-pressed paralog is
Rp
1
fIfG: ð4Þ
For example, the standing polymorphism of genes with male-limited expression in facultatively sexual species, such as Caenorhabditis elegans (Chasnov and Chow
2002, Siedelet al. 2008) and the pea aphid,
Acrythosi-phon pisum(Brissonand Nuzhdin2008), might well be
represented by Equation 4. Chasnovand Chow(2002)
sex-limited or environment-limited expression can be quantified and equals a simple function of f. For example, imagine that males appear only once every five generations (fG ¼ 0.20) and, when males do appear, they represent only 5% of the population (fI¼0.05). Thus, relative to a constitutively expressed gene that is expressed in each individual, male and female, at every generation, we would expect a gene with male-limited expression inC. elegansto be at least 100 times more polymorphic at equilibrium (1/fIfG¼[1/ .20][1/0.05]¼100). No adaptive explanation for high diversity in terms of frequency-dependent sexual selec-tion or sex-ratio selecselec-tion is necessary in this case. Or, differently put, polymorphism alone is not convincing evidence of frequency-dependent sexual selection; only polymorphism levels that exceed (1/fIfG) (i.e., 100 times normal in this example) are evidence for such selection. In fact, it may well be the case that species of Caenorhabditis with infrequently expressed male genes are at risk of losing male function to mutation and relaxed selection as Chasnovand Chow(2002)
sug-gested. Expression (4) may be useful in identifying a quantitative threshold of gene expression sufficient to engender the loss of males.
In all the cases above, the generations of neutrality experienced by conditionally expressed genes necessar-ily slow the removal of deleterious mutations by natural selection. Computer simulations show that periodic neutrality leads to equilibrium allele frequencies pre-dicted by our analytical approximation (i.e.,Equations 1 and 3), supporting our analytical results (Figure 1B; see
methods). Significantly, Equation 2 is equivalent to the
results obtained investigating maternal-effect genes, using an arithmetic mean selection coefficient of (s/2), as is appropriate for a trait expressed in half of the individuals within a single generation (i.e., the females) (Wade1998; Demuthand Wade2007). Thus,
Equation 2 brings conditional gene expression between individuals within a single generation and conditional gene expression between generations into a single, general framework. However, an explicitly spatial model of selection on a conditionally expressed trait is re-quired to validate this result.
Migration in a spatially heterogeneous environment:
When the cause of conditional expression is spatial heterogeneity in the distribution of trait-inducing cues or of selection pressures across the environment, a spatially explicit model is required to accurately specify the dynamics of natural selection. Two types (or ‘‘grains’’) of spatial heterogeneity exist, fine grained and coarse grained (Levins1968). In a fine-grained environment,
individuals experience multiple environments through-out their lifetime, while in a coarse-grained environment an individual completes its entire life cycle in a single habitat (Levins 1968). Levins (1968) showed that
selection in a fine-grained environment is governed by the arithmetic mean selection coefficient over habitat
types, while in a coarse-grained environment selection is governed by the geometric mean selection coefficient. Alternatively, Nagylaki(1980) showed that, in a
(coarse-grained) spatially heterogeneous environment with mi-gration between habitat patches, the outcome of natural selection is determined by the arithmetic mean selection coefficient over individuals in the population as long as migration between habitats is sufficiently high (e.g., the ‘‘high migration limit’’).
As we showed above, the geometric and arithmetic mean fitnesses are approximately equivalent for condi-tionally expressed traits, meaning that we do not nec-essarily need to make explicit assumptions about the pattern of environmental heterogeneity. The question, then, becomes at what value for migration is the high-migration limit achieved for conditionally expressed genes?
To answer this, we consider for simplicity a haploid population divided into two subpopulations, S and N, representing selective and nonselective habitats, respec-tively. The subpopulations are composed of different numbers of individuals,NS andNN, such that fis de-fined as the fraction of the total population occupying the selective habitat,f¼NS/(NS1NN). The life cycle of an individual consists of migration / selection /
reproduction/mutation, with selection occurring only in habitat S. We assume irreversible, recurrent mutation from the wild-type to the deleterious allele in accor-dance with the infinite sites model (Watterson1975).
For simplicity, we also ignore the effects of drift. We assume that migration is conservative, meaning that the number of migrants sent out from each sub-population in each generation is equal, e.g., when organisms assort in space according to the ideal free distribution (Fretwell 1972; Rice 2004). In the
cur-rent model, this would be the case if the subpopulation experiencing selection is occupying a marginal habitat. Lettingm1equal the fraction of subpopulation S com-posed of immigrants from subpopulation N in each generation (e.g., the ‘‘backward migration rate’’), we have,NSm1¼NNm2. Definingc¼NN/NSgivesm1¼cm2. The parameter c is related to f by f ¼ 1/(11 c) or, equivalently,c¼(1/f)1. Noting that the mean fitness in the selective habitat is wS ¼ 1 sqS, at migration–mutation–selection equilibrium, the fre-quency of deleterious mutant alleles in the selective and neutral subpopulations, respectively, is exactly
ˆqS¼
uðm11m2Þ1u2 sðm21uðm11m2Þ1u1u2Þ
ð5aÞ
ˆqN¼
m2ˆqS1u m21u
: ð5bÞ
Ignoring terms of second order or higher in s and
ˆqS u
fs: ð6aÞ
Assuming thatm2qS?u,Equation 5b gives,
ˆqNˆqS: ð6bÞ
Thus, with conservative migration between selective and nonselective habitats, the equilibrium frequency of deleterious mutants in the total population is approx-imately equal to the value we find for conditionally expressed genes in our unstructured models.
Equations 5a and 5b can be used to determine the conditions under which the analytical approximation leading to Equations 6a and 6b hold. This is done by choosing an arbitrary accuracy threshold, say 10%, and then setting the ratios (Equation 5a/Equation 6a and Equation 5b/Equation 6b) equal to 0.9 or 1.1 (depend-ing on whether the approximate result under- or over-estimates the exact result, respectively) and solving for
m1. The result is a curve that dissects the parameter space into a region where the approximation is valid to within our chosen threshold and a region where it is not. These curves are independent of the selection coefficient
becausescancels when dividing Equation 5a by Equation 6a. Figure 2A plots the range of parameter values under which Equation 6a holds to within 10% of the exact result of Equation 5a foru¼104, 105, 106. The approxima-tion is valid over a wider parameter range when the mutation rate is low, and in general, the approximation of Equation 6a is valid even when migration rates are quite small (Figure 2A). While the accuracy of Equation 6a is independent of the selection coefficient, this is not true for Equation 6b. Approximation (6b), however, is less sensitive to mutation rate and more sensitive to the value of the selection coefficient. Figure 2B shows how the range of parameter values under which Equation 6b holds is greater for smaller selection coefficients. Nu-merical investigation shows that Equation 6b will hold to withinh% as long asm1.s/h, although the exact value depends onf(see Figure 2B).
Figure 2C shows the range of parameter values under which both Equations 6a and 6b hold to within 10% of the exact result of Equations 5a and 5b fors¼0.01 and
u¼104. This figure is divided into three regions: in the region below the lower curve both approximations fail; between the curves, Equation 6a holds but 6b does not; Figure2.—(A)The parameter space where the approximation leading to Equation 6a is valid within 10% of the exact result. Each curve is independent of the selection coefficient and depends only on the mutation rate,u. Equation 6a is accurate for parameters lying in the space above each curve. (B)Equation 6b is accurate to within 10% of the exact result for all parameters lying in the area above each curve. For all curves,u¼106. (C)The graph shows three regions: in the region above the top curve, both Equations 6a and 6b are valid within 10% of exact results; in the area between the two curves, Equation 6a is valid but Equa-tion 6b is not; and in the area below the bottom curve, neither EquaEqua-tion 6a nor 6b is valid. The squares show parameter values (m1 andf) where simulation results found that Equation 6a and 6b were valid; the triangles denote parameter coordinates where simulations found Equation 6a to be accurate, but 6b to be inaccurate; and the open circles show parameter values where sim-ulations found both Equation 6a and 6b to be inaccurate. (D)Sample outputs from individual simulations with parameter values
and above the upper curve both hold to within 10% of the exact results. The parameter range where Equation 6a holds is much more extensive than that where Equation 6b holds (Figure 2C), suggesting that in nature there will often be substantial differences in allele frequencies measured between habitat types. Thus, the outcome of genetic analysis of samples from natural populations will be sensitive to the sample locations across a selectively variable environment.
It can be seen from Figures 2, A–C, that, as f gets smaller, the above approximation requires higher mi-gration rates to be valid. In addition, Figures 2A and 2C show that the parameter range for Equation 6a to hold is smaller for higher mutation rates. With realistic per-gene rates of deleterious mutation (u ¼ 106), the approximation holds for a large range offvalues even when migration is quite limited (clearly seen in Figure 2B). Significantly, Kawecki (1994) derived Equation
6a by a different route, but under the assumption of complete random migration in every generation (m¼
0.5); our results validate Equation 6a for a less restrictive parameter range with conservative migration.
Stochastic simulations testing the validity of our analytical results
To test the validity of the approximations leading to Equations 6a and 6b, we conducted extensive individual-based stochastic simulations of a population subdivided into selective and neutral subpopulations with migra-tion between them (Figure 2B; seemethods). Sample
outputs of individual simulation runs are given in Figure 2D. Figure 2D plots the outcome of individual runs for f¼1;1
2;14, and18 with parameter valuesu¼0.001,s¼
0.01,m1¼0.1, andNT¼50,000.
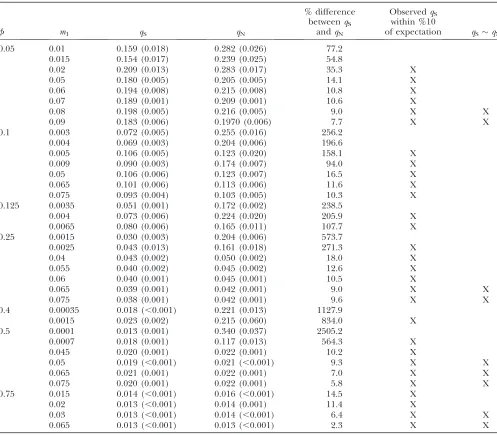
Simulation results are given in Table 1, and plotted in Figure 2C (see below). Three simulations were run for each set of parameter values, and the mean and standard error of these runs are reported in Table 1. We note that the standard deviations of allele frequency are larger for lower f values (and that the fluctuations of allele frequencies in Figure 2D are greater for lower values of f). This is a consequence of the smaller census size of the selected subpopulation whenfis small, causing drift with respect to natural selection to become stronger. We chose parameter values that specifically test the validity of the curves in Figure 2C: (1) open circles are parameter values (m1andf) where Equations 6a and 6b did not hold; (2) solid triangles indicate where Equation 6a but not Equation 6b holds; and, (3) solid squares indicate where both hold. The simulation results match the analytical predictions, giving robust support for our approximations.
Effect of conditional expression on the distribution of allele frequencies under drift, mutation, and selection:
We now introduce random genetic drift into our de-terministic analysis and extend the model to diploidy to explicitly account for dominance. With drift the
equilib-rium state of the population is a probability distribution of allele frequencies, rather than a single equilibrium allele frequency as above. The distribution of allele frequencies under mutation, drift, and natural selection is given by the diffusion approximation (Kimura1962)
ˆ u¼e
Ð
ð2MðxÞ=VðxÞÞdx
VðxÞ : ð7Þ
The termsM(x) andV(x) in Equation 7 represent the mean and variance in allele frequency change per generation, respectively. Expressions for M(x) and
V(x) can be obtained using standard population genetic formulas (e.g., Crowand Kimura1970).M(x)
incorpo-rates directional causes of allele frequency change such as selection and mutation, while V(x) incorporates nondirectional sources such as drift or temporal varia-tion in selecvaria-tion intensity (Kimura1962; Ewens1979).
Following Kimura(1962), we define
MðxÞ ¼ fsxð1xÞðh1xð12hÞÞ u1x1u2ð1xÞ ð8aÞ
VðxÞ ¼Vsx2ð1xÞ21xð1xÞ=2Ne; ð8bÞ
where x is mutant allele frequency, u1 and u2 are mutation rates from and to the deleterious allele, respectively, h is degree of dominance (for h ¼0 the mutation is recessive,h¼1 dominant),Vsis the variance in the selection coefficient s, and Ne is the effective population size. The first term on the righthand side of Equation 8b accounts for variance in allele frequency change owing to variance in selection intensity, while the second term accounts for the effects of random drift. For conditionally expressed genes,
Vs¼s2fð1fÞ: ð9Þ
Even for relatively strong selection (e.g., 4Nes.1),s2will be on the order of 1=N2
e, and the productf(1f)>1 for many values of f. Given this, the first term of Equation 8b is negligible and is thus omitted through-out for simplicity withthrough-out appreciable loss in precision. Substituting Equation 8 into Equation 7, settingh¼½ (e.g., the mutation has additive effects on fitness), and evaluatingxatq, we find,
ˆ
u¼Ce2Nesfqð1qÞ4Neu11q4Neu21; ð10Þ whereCis a normalizing constant that ensures that the area under the distribution equals one.
expression. With largeNe(Figure 4B), the distribution shifts to the right with decreasing f and is centered about the deterministic expectation, independently corroborating the deterministic results (Equation 6).
DNA sequence polymorphism under conditional expression: We need to extend the theory to use se-quence data from natural populations to test its pre-dictions. Sequence data can be used to measure the nucleotide diversity parameter, p (Nei and Li 1979;
Tajima 1983), a commonly used measure of nucleotide
polymorphism.pequalsP2qið1qiÞ, whereqiis the fre-quency of an allele at sitei, and the sum is taken over all polymorphic sites. For rare and deleterious mutations,qi is small, and ignoring terms of orderq2
i gives the standard approximate result,p P2qi. With the approximation
scsfand the standard assumptions of large population size and independence among sites, we can substitute the equilibrium allele frequency under mutation–selection balance (i.e., Equation 6) for qi to find the expected replacement site diversity, pAC, for a conditionally ex-pressed trait at equilibrium:pAC(1/f)P2u/s. Under the same assumptions, the expression for a constitutively expressed gene is pA P2u=s. Taking the ratio of diversities,Rh, we again obtain Equation 2:
Rh
1
f: ð11Þ
However, Equation 11 will not hold for the ratio of polymorphism when there is drift, when some nonsynon-ymous sites evolve neutrally, or when f becomes very small. The latter case occurs because, asfbecomes small, Figure3.—(A)The distribution of deleterious allele
fre-quency under one-way recurrent mutation, purifying selec-tion, and drift when Ne ¼ 104, s ¼ 103, and u ¼ 105. When expressed constitutively (f ¼ 1), selection is strong enough to keep the deleterious mutation rare, but as expres-sion becomes more infrequent, drift overcomes selection and deleterious mutations reach high frequency and fixation. (B) The distribution of deleterious allele frequency under one-way recurrent mutation, purifying selection, and drift with stronger selection (Ne¼107,s¼104, andu¼105), such that the distributions center about the deterministic expectation. Whenf¼1, the deterministic expectation isq¼0.1. Condi-tional expression shifts the distribution to the right such that the new expectation is 1/ftimes 0.1, as predicted by the de-terministic theory (e.g., Equation 1). It can also be seen that the variance increases with lowerf.
Figure 4.—(A) The fraction of nonsynonymous sites at conditional loci that evolve neutrally for populations with dif-ferent effective population sizes. The value ofcnis determined by Equation using a Gamma DFE with shape parametera¼
q/1, which clearly violates the assumption of smallq. Although a full treatment of the effects offon nucleotide diversity in a finite population is beyond the scope of this article, we can derive the following general results.
The expected replacement (i.e., nonsynonymous) site nucleotide diversity at a locus under selection and drift is given by
pA¼cnu1ð1cnÞHP; ð12Þ
wherecnis the fraction of neutral sites,u¼4Neu(in a diploid population), andHPis the mean equilibrium diversity at nonneutral sites (Loeweet al. 2006). Neutral
sites are those sites where 1/(4Ne) , s , 1/(4Ne) (Ohtaand Kimura1971). In the case of a conditionally
expressed trait, this inequality becomes1/(4Nef),
s,1/(4Nef). Sincefis a fraction between 0 and 1, it is clear that a conditionally expressed gene will always experience random genetic drift (i.e.,approximate neu-trality) more strongly than a constitutively expressed gene. Put differently, conditional expression increases the neutral range of mutations by reducingNetofNe. The increased strength of drift with lower values off is seen in stochastic simulations, manifesting as an in-crease in the variance of mean allele frequency across replicated simulations (Table 1).
If we defineC(s) as the distribution of fitness effects (DFE) of new mutations (Eyre-Walkerand Keightley
2007), then the fraction of neutral sites for a condition-ally expressed trait is given by the equation
cn¼
ð1=ð4NefÞ
1=ð4NefÞ
CðsÞds: ð13Þ
In the limit asf/0, 1/(4Nef)/‘, and1/(4Nef)/
‘, giving cn ¼ 1 in the limit by the definition of a probability distribution. Thus, asfbecomes small, the nonsynonymous site polymorphism at a locus ap-proaches the expectation for complete neutrality,
pA ¼ u ¼ 4Neu. As expected, conditional expression increases the neutral range of mutations, and in the limit, genes that are never expressed should become pseudogenized by mutation.
Unlike the deterministic case, the upper limit on polymorphism set by the neutral expectation (pA¼u) prevents the ratio of polymorphisms of conditional to constitutive genes (Rh) from increasing without bound asfbecomes small. We now derive an equation forRh that takes this into account. We consider the case where there are two classes of nonsynonymous sites: neutral and selected (this is the most extreme case, because it results in the highest variance insamong sites, and thus places an upper bound on the possible effect ofVs). As selection is relaxed by conditional expression, pre-viously selected sites will become neutral (Equation 13) and will have a level of polymorphism equal to the neutral expectation, u. We define ps as the poly-morphism at sites under selection due to mutation–
selection balance, cn1 and cn2 are the proportion of neutral nonsynonymous sites at conditional and consti-tutive loci, respectively, andr¼u/ps. With the assump-tion of two discrete types of nonsynonymous sites,
Hp¼Sui=fsi¼ ð1=fÞps. Applying these assumptions and definitions to Equation 12, taking the ratio of conditionalpAto constitutivepA, and rearranging gives the relative polymorphism of a conditional gene,
Rh¼
1=f1cn1ðr1=fÞ
11cn2ðr1Þ : ð14Þ
When cn1 ¼ 1 (e.g., all nonsyonymous sites at the conditional locus evolve neutrally), Equation 11 re-duces toRh¼u/pAas expected (wherepAis given by Equation 12).
The effect offon Equation 14 depends on the DFE (through the parameterscn1andcn2) and the relative magnitude ofpsandu. To investigate Equation 14, we define the DFE as a Gamma-distribution with shape parameter a ¼ 0.25, which accords with empirical results from a number of species (Eyre-Walker et al.
2006; Loeweet al. 2006; Eyre-Walkerand Keightley
2007). Figure 4A shows that the fraction of neutral nonsynonymous sites at a conditionally expressed locus (cn1) depends onNe, as expected (see Equation 10), and that it is sensitive tofonly whenfis small. Figure 4B shows that the deterministic value ofRh(Equation 11) is a good approximation of Equation 14 whenNeis large, but that it consistently overestimatesRhfor smallerNe. The degree of overestimation depends on Nebecause with smallNedrift is stronger at selected sites causingpA to approachu, such thatRh/1 in the limit when drift overwhelms selection at all nonsynonymous sites. For realistic population sizes (Ne.103), however, Equation 11 is a reasonable approximation for the effect of conditional expression on sequence polymorphism.
Sequence divergence between populations or species
We extend our results for polymorphism within species to sequence divergence among species, which is de-termined by the fixation process. The probability of fixation of an allele in a population experiencing selection and drift is given by the diffusion approxima-tion (Kimura1962)
uðpÞ ¼
Ðp 0 GðxÞdx
Ð1 0GðxÞdx
; ð15Þ
where
GðxÞ ¼e2
Ð
MðxÞ=VðxÞdx
: ð16Þ
We combine Equations 8a, 8b, 15, and 16 and ignore terms of orderq2becauseq¼½Nfor a new mutation (Rice 2004). Making this approximation and setting q ¼½N, we find that the probability of fixation of a new conditionally expressed mutation is approximately
ucðpÞ ¼ 1e 2hsf
1e4Nehsf: ð17Þ
Equation 17 was also found by Whitlock (1996).
However, this is an approximate result that fails for
completely recessive mutations (whereh¼0). We obtain exact results by numerical integration of Equation 15 to determine the effect of dominance on divergence of conditionally expressed loci. We are interested in the
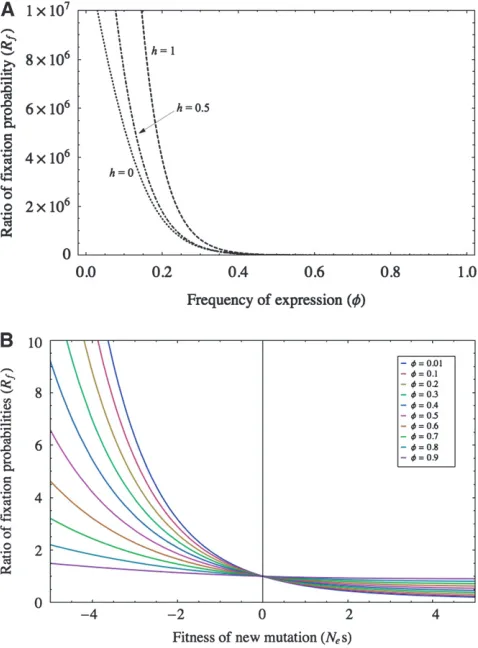
relative probability of fixation for a conditionally ex-pressed mutation, which is the ratio of fixation proba-bilities of conditional to constitutive mutations. This ratio, Rf, is plotted against f for dominant (h ¼ 1), additive (h¼½), and recessive (h¼0) mutations for constant values of Neand s (see Figure 5A). Figure 5 demonstrates that degree of dominance has little effect TABLE 1
Results for stochastic, individual-based computer simulations of a population subdivided into selective and nonselective habitats
f m1 qS qN
% difference betweenqS
andqN
ObservedqS within %10
of expectation qSqN
0.05 0.01 0.159 (0.018) 0.282 (0.026) 77.2
0.015 0.154 (0.017) 0.239 (0.025) 54.8
0.02 0.209 (0.013) 0.283 (0.017) 35.3 X
0.05 0.180 (0.005) 0.205 (0.005) 14.1 X
0.06 0.194 (0.008) 0.215 (0.008) 10.8 X
0.07 0.189 (0.001) 0.209 (0.001) 10.6 X
0.08 0.198 (0.005) 0.216 (0.005) 9.0 X X
0.09 0.183 (0.006) 0.1970 (0.006) 7.7 X X
0.1 0.003 0.072 (0.005) 0.255 (0.016) 256.2
0.004 0.069 (0.003) 0.204 (0.006) 196.6
0.005 0.106 (0.005) 0.123 (0.020) 158.1 X
0.009 0.090 (0.003) 0.174 (0.007) 94.0 X
0.05 0.106 (0.006) 0.123 (0.007) 16.5 X
0.065 0.101 (0.006) 0.113 (0.006) 11.6 X
0.075 0.093 (0.004) 0.103 (0.005) 10.3 X
0.125 0.0035 0.051 (0.001) 0.172 (0.002) 238.5
0.004 0.073 (0.006) 0.224 (0.020) 205.9 X
0.0065 0.080 (0.006) 0.165 (0.011) 107.7 X
0.25 0.0015 0.030 (0.003) 0.204 (0.006) 573.7
0.0025 0.043 (0.013) 0.161 (0.018) 271.3 X
0.04 0.043 (0.002) 0.050 (0.002) 18.0 X
0.055 0.040 (0.002) 0.045 (0.002) 12.6 X
0.06 0.040 (0.001) 0.045 (0.001) 10.5 X
0.065 0.039 (0.001) 0.042 (0.001) 9.0 X X
0.075 0.038 (0.001) 0.042 (0.001) 9.6 X X
0.4 0.00035 0.018 (,0.001) 0.221 (0.013) 1127.9
0.0015 0.023 (0.002) 0.215 (0.060) 834.0 X
0.5 0.0001 0.013 (0.001) 0.340 (0.037) 2505.2
0.0007 0.018 (0.001) 0.117 (0.013) 564.3 X
0.045 0.020 (0.001) 0.022 (0.001) 10.2 X
0.05 0.019 (,0.001) 0.021 (,0.001) 9.3 X X
0.065 0.021 (0.001) 0.022 (0.001) 7.0 X X
0.075 0.020 (0.001) 0.022 (0.001) 5.8 X X
0.75 0.015 0.014 (,0.001) 0.016 (,0.001) 14.5 X
0.02 0.013 (,0.001) 0.014 (0.001) 11.4 X
0.03 0.013 (,0.001) 0.014 (,0.001) 6.4 X X
0.065 0.013 (,0.001) 0.013 (,0.001) 2.3 X X
Parameter values for the simulation ares¼0.01 andu¼0.001.fis the proportion of individuals occupying the selective habitat,
on the relative fixation probability when f . 0.5. However, whenfis small, dominant mutations are dis-proportionately affected by conditional expression be-cause deleterious recessive mutations are always hidden from selection when rare, whereas dominant mutations are not. Conditional expression, then, provides a se-lective reprieve for dominant mutants that they nor-mally do not receive, making them more sensitive to infrequent expression.
Figure 5B plots the ratio of fixation probabilities against the strength of selection (Nes) for the case of dominant mutations (h¼1) and shows that conditional expression greatly increases the probability of fixation of deleterious mutations. On the other hand, the spread
of beneficial mutations (s . 0) in conditionally ex-pressed traits is slowed (see also Whitlock 1996). To
show this latter result analytically, we assume thatNe¼N as per Haldane(1927) and take the limit of Equation
14 asNe/‘. We find the probability of fixation of a dominant, beneficial mutation (s . 0) is (for non-infinitesimalf)
ucðpÞ 2sf ð18Þ
analogous to Haldane’s (1927) classic result that the
probability of fixation is twice the selective benefit. Taking the ratio of Equation 18 to the classic result of Haldane(1927), who assumed constants, we find
Rf;beneficial¼f: ð19Þ
That is, conditionally expressed genes suffer a reduction in probability of fixation directly proportional tof, the frequency of gene expression (Figure 5B), slowing the rate of adaptive divergence between species.
The combined effect of increased probability of fix-ation of deleterious mutfix-ations and a decreased proba-bility of fixation of beneficial mutations should be a net increase in overall sequence divergence between species at conditionally expressed loci, since the former is be-lieved to be orders of magnitude greater than the latter. The logic is as follows: the relative probability of fixation of slightly deleterious alleles increasesexponentiallywith decreasingf (Figure 5B). However, the probability of fixation of beneficial mutations decreases linearly with the frequency of trait expression, f. The distribution of fitness effects of new mutations is highly skewed toward deleterious mutations (Eyre-Walker and Keightley
2007), so that the relaxation of selective constraint vis a` vis purifying selection outweighs its effect on adaptive substitution, increasing the rate of sequence divergence among species.
The plasticity load and the mutational cost of complexity
The mutational load is the decrease in mean pop-ulation fitness due to recurrent deleterious mutation (Muller 1950). In a haploid population, with a
del-eterious allele, in frequency q, the mean fitness of a population is w ¼ 1 qs. Substituting the allele fre-quency at mutation–selection balance,qˆ(Equation 6), forqgives,w¼1u. Thus, the mutational load is equal to the deleterious mutation rate (Muller1950).
For a conditionally expressed locus, the mean pop-ulation fitness is wc¼1qsf¼1usf=sf¼1u. Thus, conditional expression does not affect the muta-tional load over the total population. However, if we consider the mutational load only in generations or habitats where the gene is expressed, then s is not diminished by averaging over nonexpressive conditions and we havewc*¼1qs¼1u=f, where the asterisk
Figure 5.—(A) Numerical integration of Equation 15 is used to determine the effect of dominance on the ratio of fix-ation probabilitiesRf. Conditional expression has a stronger effect on dominant than additive or recessive mutations when fis small, although the effects of each are within an order of magnitude for all values off. (B)The relative probability of fixation of dominant mutations with fitness effectNesfor dif-ferent frequencies of gene expression,f. Mutations with del-eterious fitness effects have a significantly inflated probability of fixation under conditional expression, corresponding to large values ofRh, leading to increased divergence between species at conditional loci. For beneficial mutations, however, the probability of fixation is reduced. WhenNesis large and positive, the probability of fixation is 2sf, giving a value of
denotes marginal fitness (e.g., the fitness only in the se-lective environment). Defining the load,Lc, as 1wc*, we have
Lc¼u=f: ð20Þ
We refer to this as theplasticity load. For diploids, the same methods lead to Lc ¼ 2u/f. For haploids, the plasticity load is maximal (i.e., Lc¼1) whenf¼u, which corresponds to complete mutational decay. Equation 20 demonstrates the connection between the accumula-tion of deleterious mutaaccumula-tions under condiaccumula-tional expres-sion (e.g., Equation 6) and the resulting decline in adaptedness of the population to the conditional environment. Kawecki(1994) and Whitlock (1996)
derived the equivalent of Equation 20 for a spatially subdivided population with random migration between habitat patches. Our methods extend these results to any conditionally expressed locus (conditional in time and space). Furthermore, because thefapproximation is accurate in the selective environment over a much wider range of parameter values than it is over the total population (see Figures 2, A and B), our results for the plasticity load hold much more generally than sug-gested by Kawecki(1994) and Whitlock(1996).
We can extend these results to account for the load experienced when more than a single locus contributes to fitness. Consider multiple nucleotide sites contribut-ing multiplicatively to total fitness such thatW¼P(1 qs). Taking the logarithm of both sides, using the approximation log(11x)xfor small x, and taking the exponent givesW¼enuandL¼1 –enu, wherenis
the total haploid number of sites at the locus under consideration andu is the average mutation rate over these sites (for diploids,W¼e2nu
;e.g.,Gillespie2004).
The mutational load for a conditionally expressed trait when expressed is
Lc¼1enu=f: ð21Þ
A population expressing a trait conditionally will have a lower mean fitness than a population of specialists that express a trait unconditionally by a factor of
RW ¼enuð1=f1Þ ð22Þ
Thus, specialists will always be better adapted to the conditional environment than nonspecialists, even when antagonistic pleiotropy is not a factor, as long as specialism involves suites of genes that are conditionally expressed (Kawecki 1994; Whitlock 1996). Since
Equations 21 and 22 depend on the product nu, the cost to plasticity relies heavily on the number of loci coding for the plastic phenotype. More elaborate plastic phenotypes, then, are more evolutionarily constrained by mutation than simple plastic phenotypes as demon-strated in Figure 6 by the different curves correspond-ing to different values ofnu.
METHODS
Temporal variation simulation:To simulate temporal fluctuations in gene expression, we carried out a de-terministic simulation in Mathematica (Wolfram), using the standard haploid allele frequency recursion, q ¼ q(1s)/W 1u(1q) (Crowand Kimura1970), where
the mutation rate, u, was set at 0.001. Periodicity of selection was simulated by switching the value of the selection coefficient,s, between 0 and 0.01 at a frequency determined byf. For instance, forf¼½,salternated between 0 and 0.01 every other generation. Forf¼1/ 10,s¼0 for every generation except generations that were multiples of 10, when s would become equal to 0.01. The results of the simulation are plotted in Figure 1B for multiple values of f. Simulations were run for 10,000 generations, with data points sampled and plotted every 100 generations.
of sampling, selection (in the selective habitat) and mutation untilNSandNNindividuals occupied the next generation in the selective and neutral habitats, re-spectively. To simulate migration, at the end of each generation,mNSindividuals from each subpopulation were chosen at random and exchanged between sub-populations, wherem is the migration rate. This con-stitutes ‘‘conservative migration,’’ as was assumed in our analytical results. All simulations began with zero mutants, except for the simulation for f¼1
8 plotted
in Figure 2C, which was initiated withq¼0.5, in order that it reached equilibrium within 10,000 generations. Each simulation was run for 10,000 generations. The parameter values for Figure 2C wereu¼0.001,s¼0.01,
m¼0.1, andNT¼50,000.
For the mean and standard deviation of allele frequency reported in the text, each simulation was run three times, and the allele frequency from each run was computed as the mean allele frequency of the last 5000 generations.
DISCUSSION
Our results show that spatial or temporal fluctuations in the induction of gene expression generate relaxed selective constraint, increasing the level of standing polymorphism within a species and the rate of non-adaptive divergence between species. Specifically, rela-tive to genes expressed in all individuals all the time, conditional expression increases polymorphism by a factor of approximately (1/f), where the approxima-tion is closer for populaapproxima-tions of large effective size. This factor is the inverse off, the fraction of gene-expressing individuals. When gene expression is both spatially (fI) and temporally (fG) conditional, the equilibrium
poly-morphism at a locus is proportional to the product of the inverses, (1/fIfG). We show that the assumption of random mixing between selective and neutral habitats every generation is not necessary and that using the mean selection coefficient (sf) for a conditionally expressed locus in a spatially variable population is valid even for small rates of migration (Figures 2, A–C). In general, our theory connects gene-level relative poly-morphism and divergence with the spatial and temporal frequency of environments inducing gene expression.
Conditionally expressed genes suffer increased mu-tational and drift loads due to the increased mainte-nance and fixation of slightly deleterious mutations. As suggested previously (Kawecki1994, 1997; Whitlock
1996; Kawecki et al. 1997), this poses a serious
con-straint on the elaboration and maintenance of pheno-typically plastic traits. In contrast to other hypotheses for constraints on phenotypic plasticity such as antagonistic pleiotropy and energetic costs (reviewed in DeWitt et al. 1998), mutation accumulation due to relaxed selection is a necessary consequence of conditional
expression experienced by any conditionally expressed gene. Our theory provides quantitative predictions for how such effects can be observed in gene sequence data. Furthermore, Equation 22 demonstrates that the con-straint is greater not only for more infrequently ex-pressed genes, but for traits encoded by a larger suite of genes. If complexity is measured by the number and diversity of distinct morphs encoded by a single geno-type, then mutation accumulation due to relaxed selection imposes a potentially severe cost to complexity, limiting the number and elaborateness of distinct morphs in polyphenic species.
Relaxed selection has been proposed as a cause of the observed stability of species’ niches over long periods of geologic time (‘‘niche conservatism,’’ Holtand Gaines
1992; Holt1996). Our theory extends these previous
results by demonstrating how parameter values affect the predicted plasticity load. According to Figure 2A, the plasticity load will exist even with relatively low rates of migration between selective and nonselective hab-itats. The level of migration necessary to eliminate the load may be low enough to facilitate speciation as suggested by Kawecki(1997).
Importantly, the relaxed selection described here is not experienced by genes expressed conditionally within a single individual’s lifetime. In many cases, genes are expressed with varying intensity across tissues or cell types or at different life stages in an individual’s lifetime. If there is a relationship between the intensity of gene expression and the intensity of selection (i.e.,
the magnitude ofs), then it might well be possible to extend our theory. If the relationship between expres-sion level and selection was given by the linear re-gression coefficient, b, then two genes with different expression levels could be compared for standing poly-morphism and divergence using our theory by substitut-ingbforf. Recent empirical work has shown that levels of gene expression within an individual are correlated with rates of divergence (Lemoset al. 2005) suggesting
that such relationships may exist and permit tests of our theory. Similarly, if the tissue specificity of gene expres-sion could be related to strength of selection, pre-dictions regarding the relative rate and diversity of evolution of one gene to another could be made. This is an active area of current research and it is too early to determine whether such relationships will be discov-ered and whether, if discovdiscov-ered in one species, they hold in another.
Applications of the Theory and Tests of its Pre-dictions: Our theory is supported by previous studies, which serve as a guide for future testing. One way of testing the theory is to apply the methods used in testing the predictions of maternal effects theory (Wade1998;
Linksvayerand Wade2009), which is a special case of
both sexes. The specific predictions are: (1) standing variation for maternal effect genes should be twice that of genes expressed in both sexes, and (2) maternal effect genes should be differentiating more rapidly across taxa. Barker et al. (2005) tested these two
predictions in two species of fruit flies, using the tandem duplicate gene pair bicoid (bcd, maternal expression) andzerknult(zen, zygotic expression in both sexes). For the ratios of (bcd/zen) polymorphism, they found it to be 1.08 for silent sites and 2.18 for nonsynonymous sites within Drosophila melanogaster, and 0.89 and 2.68 for silent and nonsynonymous sites, respectively, in Drosoph-ila simulans. Both ratios provide quantitative support for the theory predictions. In a broader test of the theory, Cruickshank and Wade (2008; Figure 3, A and B)
compared sequence diversity within D. simulans and sequence divergence among several species for 42 genes, critical to early embryo development (9 maternal and 33 zygotic). For five maternal-zygotic homologs, like
bcd and zen, they observed a nonsynonymous site di-versity to average 0.5560.22 SE for the maternal genes and 0.2860.15 SE for the zygotic genes for a ratio of 1.96, very nearly identical to the theoretically predicted ratio of 2.0. Across species, Cruickshank and Wade
(2008, Figure 2) found that ‘‘. . .the average level of between-species sequence divergence ranges from two to four times greater for maternal than for zygotic genes.’’ These empirical findings also quantitatively support the theoretical predictions.
In some species, sex-limited gene expression may result in values of f that differ from f ¼ ½. In parthenogenic species with facultative sexuality, male-specific genes experience a frequency of expression
such that f , ½. Brisson and Nuzhdin (2008)
identified male-specific, female-specific, and sex-neutral genes in the facultatively sexual pea aphid,A. pisum, and measured levels of sequence divergence between spe-cies for these classes of genes. This spespe-cies reproduces clonally for 10 to 20 generations before producing a sexual generation composed of males and females in the fall (Moran 1992; Brisson and Nuzhdin 2008).
Consistent with the predictions of relaxed selective constraint, male-specific genes had more than a twofold increase in divergence compared to female-specific and sex-neutral genes, which had approximately the same levels of divergence, and tests of selection showed that this variation accumulated neutrally (Brisson and
Nuzhdin 2008). The pattern of expression for this
species gives a frequency of expression of betweenf¼
0.05 andf¼0.1. While our theory shows that the level of standing polymorphism at equilibrium should be in-flated 10- to 20-fold, the consequence for divergence is not as straightforward. From Equation 17 and Figure 5, a f value or 0.1 will produce a 2-fold increase in di-vergence if the mutations accumulated experience an average selection intensity ofNes 1.3, although this requires the assumption that deleterious mutations are dominant. Further empirical work on the effect sizes of
spontaneous mutations in this species, or estimation of
Ne and comparison with mutational effect sizes from other species, will be necessary to determine if these data support our theory. This highlights the fact that less data are required to apply our theory to polymorphism data than to divergence data. While divergence data are sensitive to the selection coefficient and dominance, polymorphism data are not. Unfortunately, at present, polymorphism data are not as easily obtained as di-vergence data.
With polymorphism data, our theory can be used in multiple ways. Given a known value of f, a null expectation for levels of sequence polymorphism can be obtained. Our theory shows that null expectations should always be adjusted to account for the effects of the frequency of expression. Alternatively, the parameter fcan be estimated from the data, or iffis known, dif-ferences in selection pressures can be measured between paralogs or classes of genes. The two major barriers to such an analysis are the availability of polymorphism data and of expression data across individuals.
The results presented here for conditionally ex-pressed genes can also be applied to social genes. Recent theory (Linksvayerand Wade2009)
hypothe-sizes that genes with indirect genetic effects or genes whose primary fitness effect is at the level of the social group (called ‘‘kin selection’’ genes) should experience relaxed selective constraint in a manner analogous to conditionally expressed genes. In the Linksvayer–Wade theory, the coefficient of relatedness, r, between the individual expressing the gene and the group experi-encing its fitness effects, plays the same role asfin our theory for conditionally expressed genes. The quantita-tive predictions developed here, then, can be applied with modification to kin selection genes.
While we focused primarily on relaxed selection as an evolutionary constraint on conditionally expressed traits, we cannot discount the possibility that much of the accumulated mutational variation at conditional loci may provide the raw material for adaptive evolu-tionary change under appropriate conditions. The increased level of standing genetic variation caused by relaxed selection may facilitate the rapid emergence of evolutionary novelties when formerly rare, low f environments become more common. Further, the larger neutral range experienced by conditionally ex-pressed genes may allow populations to explore pre-viously inaccessible regions of sequence space, allowing populations to escape local optima in favor of globally higher fitness peaks. The possibility of such adaptive peak shifts (Wright1931) is of considerable medical
environments will become more common. Condition-ally expressed genes, then, may contribute dispropor-tionately to the evolution of novel form and function under appropriate ecological and population genetic conditions.
We thank M. Feldman, M. Hahn, and M. Lynch for helpful discussions and Y. Brandvain, T. Cruickshank, T. Platt, and P. Zee for helpful comments on the manuscript. This work was supported by National Institutes of Health grant R01 GM65414 to M.J.W. and a National Science Foundation Integrative Graduate Education and Research Traineeship (NSF IGERT) Fellowship to J.D.V.D.
LITERATURE CITED
Abouheif, E., and G. A. Wray, 2002 Evolution of the gene
net-work underlying wing polyphenism in ants. Science297:249– 252.
Barker, M. S., J. P. Demuthand M. J. Wade, 2005 Maternal
expres-sion relaxes constraint on innovation of the anterior determi-nant,bicoid.PLoS Genet1:e57.
Brisson, J. A., and S. V. Nuzhdin, 2008 Rarity of males in pea
aphids results in mutational decay. Science319:58.
Chasnov, J. R., and K. L. Chow, 2002 Why are there males in the
hermaphroditic speciesCaenorhabditis elegans?Genetics160:983– 994.
Crow, J. F., and M. Kimura, 1970 An Introduction to Population
Genet-ics Theory.Harper & Row, New York.
Cruickshank, T., and M. J. Wade, 2008 Microevolutionary support
for a developmental hourglass: gene expression patterns shape sequence variation and divergence inDrosophila.Evol. Dev.10:
583–590.
Demuth, J., and M. Wade, 2007 Maternal expression increases the
rate of bicoid evolution by relaxing selective constraint. Genetica
129:37–43.
DeWitt, T. J., 1998 Costs and limits of phenotypic plasticity: tests
with predator-induced morphology and life history in a fresh-water snail. J. Evol. Biol.11:465–480.
DeWitt, T. J., A. Sihand D. S. Wilson, 1998 Costs and limits of
phe-notypic plasticity. Trends Ecol. Evol.13:77–81.
Eyre-Walker, A., and P. D. Keightley, 2007 The distribution of
fit-ness effects of new mutations. Nat. Rev. Genet.8:610–618. Eyre-Walker, A., M. Woolfitand T. Phelps, 2006 The
distribu-tion of fitness effects of new deleterious amino acid mutadistribu-tions in humans. Genetics173:891–900.
Frank, S. A., and M. Slatkin, 1990 Evolution in a Variable
Environ-ment. Am. Nat.136:244–260.
Fretwell, S. D., 1972 Populations in a Seasonal Environment.
Prince-ton University Press, PrincePrince-ton, NJ.
Fuqua, C., S. C. Winansand E. P. Greenberg, 1996 Census and
consensus in bacterial ecosystems: the LuxR-LuxI family of quorum-sensing transcriptional regulators. Annu. Rev. Micro-biol.50:727–751.
Gillespie, J. H., 2004 Population Genetics: A Concise Guide. JHU Press,
Baltimore, Maryland.
Haldane, J. B. S., 1927 A mathematical theory of natural and
arti-ficial selection. Part V. Selection and mutation. Proc. Camb. Phi-lol. Soc.23:838–844.
Harvell, C. D., 1998 Genetic variation and polymorphism in the
inducible spines of a marine Bryozoan. Evolution52:80–86. Hazel, W., R. Smock andC. M. Lively, 2004 The ecological
genet-ics of conditional strategies. Am. Nat.163:888–900.
Holt, R., and M. Gaines, 1992 Analysis of adaptation in
heteroge-neous landscapes: implications for the evolution of fundamental niches. Evol. Ecol.6:433–447.
Holt, R. D., 1996 Demographic constraints in evolution: towards
unifying the evolutionary theories of senescence and niche con-servatism. Evol. Ecol.10:1–11.
Kawecki, T., N. H. Bartonand J. D. Fry, 1997 Mutational collapse
of fitness in marginal habitats and the evolution of ecological specialisation. J. Evol. Biol.10:407–429.
Kawecki, T. J., 1994 Accumulation of deleterious mutations and the
evolutionary cost of being a generalist. Am. Nat.144:833–838. Kawecki, T. J., 1997 Sympatric speciation via habitat specialization
driven by deleterious mutations. Evolution51:1751–1763. Kimura, M., 1962 On the probability of fixation of mutant genes in
a population. Genetics47:713–719.
Kimura, M., and T. Ohta, 1971 Protein polymorphism as a phase of
molecular evolution. Nature229:467–469.
Lemos, B., B. R. Bettencourt, C. D. Meiklejohnand D. L. Hartl,
2005 Evolution of proteins and gene expression levels are cou-pled in Drosophila and are independently associated with mRNA abundance, protein length, and number of protein-protein inter-actions. Mol. Biol. Evol.22:1345–1354.
Levins, R., 1968 Evolution in Changing Environments: Some Theoretical
Explorations.Princeton University Press, Princeton, NJ. Linksvayer, T. A., and M. J. Wade, 2008 Genes with social effects
are expected to harbor more sequence variation within and be-tween species. Evolution63:1685–1696.
Lively, C. M., 1986 Predator-induced shell dimorphism in the
acorn barnacle Chthamalus anisopoma. Evolution40:232–242. Loewe, L., B. Charlesworth, C. Bartolome and V. Noel,
2006 Estimating selection on nonsynonymous mutations. Genetics172:1079–1092.
Lommen, S. T. E., P. W. De Jong and P. M. Brakefield,
2005 Phenotypic plasticity of elytron length in wingless two-spot ladybird beetles,Adalia bipunctata(Coleoptera: Coccinellidae). Eur. J. Entomol.102:553–556.
Moran, N. A., 1992 The evolution of aphid life cycles. Annu. Rev.
Entomol.37:321–48.
Muller, H. J., 1950 Our load of mutations. Am. J. Hum. Genet.2:
111–176.
Nagylaki, T., 1980 The strong-migration limit in geographically
structured populations. J. Math. Biol.9:101–114.
Nei, M., and W. H. Li, 1979 Mathematical model for studying
ge-netic variation in terms of restriction endonucleases. Proc. Natl. Acad. Sci. USA76:5269–5273.
Ohta, T., and M. Kimura, 1971 On the constancy of the
evolution-ary rate of cistrons. J. Mol. Evol.1:18–25.
Rice, S. H. 2004 Evolutionary Theory: Mathematical and Conceptual
Foundations.Sinauer Associates, Inc., Sunderland, MA. Roff, D. A., and M. B. Ge´ linas, 2003 Phenotypic plasticity and the
evolution of trade-offs: the quantitative genetics of resource allo-cation in the wing dimorphic cricket,Gryllus firmus.J. Evol. Biol.
16:55–63.
Rosenzweig, M. L., 1987 Habitat selection as a source of biological
diversity. Evol. Ecol.1:315–330.
Scheiner, S. M., 1993 Genetics and evolution of phenotypic
plastic-ity. Annu. Rev. Ecol. Systematics24:35–68.
Seidel, H. S., M. V. Rockmanand L. Kruglyak, 2008 Widespread
genetic incompatibility in C. elegans maintained by balancing selection. Science319:589–594.
Tajima, F., 1983 Evolutionary relationship of DNA sequences in
fi-nite populations. Genetics105:437–460.
Via, S., R. Gomulkiewicz, G. De Jong, S. M. Scheiner, C. D.
Schlichtinget al., 1995 Adaptive phenotypic plasticity:
con-sensus and controversy. Trends Ecol. Evol.10:212–217. Wade, M. J., 1998 The evolutionary genetics of maternal effects, pp.
5–21 inMaternal Effects as Adaptations, edited by T. A. Mousseau
and C. W. Fox. Oxford University Press, New York.
Watterson, G. A., 1975 On the number of segregating sites in
genet-ical models without recombination. Theor. Popul. Biol.7:256–276. Whitlock, M. C., and M. J. Wade, 1995 Speciation: Founder Events
and Their Effects on X–Linked and Autosomal Genes. Am. Nat.
145:676–685.
Whitlock, M. C., 1996 The Red Queen beats the Jack-of-All-Trades:
the limitations on the evolution of phenotypic plasticity. Am. Nat.
148(Suppl):S65–S77.
Wright, S., 1931 Evolution in Mendelian populations. Genetics16:
97–159.