University of Windsor University of Windsor
Scholarship at UWindsor
Scholarship at UWindsor
Electronic Theses and Dissertations Theses, Dissertations, and Major Papers
2013
An automatic email mining approach using semantic
An automatic email mining approach using semantic
non-parametric K-Means++ clustering
parametric K-Means++ clustering
Gunjan Soni
University of Windsor
Follow this and additional works at: https://scholar.uwindsor.ca/etd
Recommended Citation Recommended Citation
Soni, Gunjan, "An automatic email mining approach using semantic non-parametric K-Means++ clustering" (2013). Electronic Theses and Dissertations. 4864.
https://scholar.uwindsor.ca/etd/4864
This online database contains the full-text of PhD dissertations and Masters’ theses of University of Windsor students from 1954 forward. These documents are made available for personal study and research purposes only, in accordance with the Canadian Copyright Act and the Creative Commons license—CC BY-NC-ND (Attribution, Non-Commercial, No Derivative Works). Under this license, works must always be attributed to the copyright holder (original author), cannot be used for any commercial purposes, and may not be altered. Any other use would require the permission of the copyright holder. Students may inquire about withdrawing their dissertation and/or thesis from this database. For additional inquiries, please contact the repository administrator via email
AN AUTOMATIC EMAIL MINING APPROACH USING SEMANTIC
NON-PARAMETRIC K-MEANS++ CLUSTERING
By
Gunjan Soni
A Thesis
Submitted to the Faculty of Graduate Studies through the School of Computer Science in
Partial Fulfillment of the Requirements for the Degree of Master of Science at the
University of Windsor
Windsor, Ontario, Canada
2013
AN AUTOMATIC EMAIL MINING APPROACH USING SEMANTIC
NON-PARAMETRIC K-MEANS++ CLUSTERING
By
Gunjan Soni
APPROVED BY:
______________________________________________ Dr. Sévérien Nkurunziza
Department of Mathematics and Statistics
______________________________________________ Dr. Jianguo Lu
School of Computer Science
______________________________________________ Dr. Christie I. Ezeife, Advisor
School of Computer Science
______________________________________________ Dr. Dan Wu, Chair of Defense
School of Computer Science
III
AUTHOR’S DECLARATION OF ORIGINALITY
I hereby certify that I am the sole author of this thesis and that no part of this thesis has been published or submitted for publication.
I certify that, to the best of my knowledge, my thesis does not infringe upon anyone’s copyright nor violate any proprietary rights and that any ideas, techniques, quotations, or any other material from the work of other people included in my thesis, published or otherwise, are fully acknowledged in accordance with the standard referencing practices. Furthermore, to the extent that I have included copyrighted material that surpasses the bounds of fair dealing within the meaning of the Canada Copyright Act, I certify that I have obtained a written permission from the copyright owner(s) to include such material(s) in my thesis and have included copies of such copyright clearances to my appendix.
IV
ABSTRACT
Email inboxes are now filled with huge varieties of voluminous messages and thus increasing the problem of "email overload" which places financial burden on companies and individuals. Email mining provides solution to email overload problem by automatically grouping emails into meaningful and similar groups based on email subjects and contents. Existing email mining systems such as Kernel-Selected clustering and BuzzTrack, do not consider the semantic similarity between email contents, also when large number of email messages are clustered to a single folder they retain the problem of email overload.
This thesis proposes a system named AEMS for automatic folder and sub-folder creation, indexing of the created folders with link to each folder and sub-folder, also an Apriori-based folder summarization containing important keywords from the folder. Thesis aims at solving email overload problem through semantic re-structuring of emails. In AEMS model, a novel approach named Semantic Non-parametric K-Means++ clustering is proposed for folder creation, which avoids, (1) random seed selection by selecting the seed according to email weights, and (2) pre-defined number of clusters using the similarity between the email contents. Experiments show the effectiveness and efficiency of the proposed techniques using large volumes of email datasets.
Keywords: Email Mining, Email Overload, Email Management, Data Mining, Clustering, Feature Selection, Folder Summarization.
V
DEDICATION
VI
ACKNOWLEDGEMENT
My sincere appreciation goes to my parents, siblings, brother-in-law and nephew. Your perseverance and words of encouragement gave me the extra energy to see this work through.
I will be an ingrate without recognising the invaluable tutoring and supervision from Dr. Christie Ezeife. Your constructive criticism and advice at all times gave me the needed drive to successfully complete this work. I like to thank Dr. Ezeife for continuous research assistantship positions from NSERC and FedDev/OBI grants.
Special thanks go to my external reader, Dr. Sévérien Nkurunziza, my internal reader, Dr. Jianguo Lu and my thesis committee chair, Dr. Dan Wu for accepting to be in my thesis committee. Your decision, despite your tight schedules, to help in reading the thesis and providing valuable input is highly appreciated.
VII
TABLE OF CONTENT
AUTHOR’S DECLARATION OF ORIGINALITY ... III ABSTRACT ... IV DEDICATION ... V ACKNOWLEGEMENT ... VI LIST OF TABLES ... IX LIST OF FIGURES ... X
1. INTRODUCTION ... 1
1.1 EMAIL OVERLOAD ... 2
1.2 EMAIL MANAGEMENT - DEFINITION AND APPLICATION ... 3
1.2.1 Reducing Email Overload by Automatic Folder Creation ... 4
1.2.2 Reducing Email Overload by Email Summarization ... 5
1.2.3 Contact Management ... 6
1.2.4 Spam Filtering ... 7
1.3 DATA MINING APPROACH FOR EMAIL MANAGEMENT ... 7
1.4 AUTOMATIC FOLDER CREATION BY DATA MINING TECHNIQUES ... 9
1.4.1 Folder Creation by Classification ... 9
1.4.2 Folder Creation by Clustering ... 10
1.5 PROBLEM WITH CURRENT EMAIL MANAGEMENT SYSTEMS ... 11
1.6 THESIS CONTRIBUTION ... 14
1.7 OUTLINE OF THESIS ... 16
2. RELATED WORK ... 17
2.1 EMAIL DATASET ... 17
2.2 EMAIL PRE-PROCESSING AND REPRESENTATION ... 18
2.3 FEATURE SELECTION ... 24
2.4 DISTANCE FINDING METHODS ... 24
2.4.1 Euclidean Distance ... 25
2.4.2 Cosine Similarity Coefficient ... 26
2.4.3 Semantic Text Similarity (STS) method ... 27
VIII
2.5.1 Clustering Methods ... 32
2.5.2 Frequent Pattern Mining, Association and Correlation ... 37
2.6 AUTOMATIC FOLDER CREATION TOOLS ... 39
2.6.1 Email Clustering by adding Semantics ... 40
2.6.2 Multi-level Clustering using ACEMS Algorithm ... 42
2.6.3 Buzz Track ... 44
2.6.4 Automatic Nonparametric Clustering Approach ... 46
2.6.5 Automatic Topic Detection Algorithm by Clustering ... 49
3. EMAIL OVERLOAD MANAGEMENT SYSTEM VIA AUTOMATIC FOLDER CREATION AND INDEXING ... ...53
3.1 PROBLEM ADDRESSED IN MANAGING PERSONAL EMAIL ... 53
3.2 AUTOMATIC EMAIL MANAGEMENT SYSTEM (AEMS)... 54
3.2.1 AEMS Model ... 56
3.2.2 APEG Model ... 62
3.2.3 Indexing ... 64
3.3 A WALK THROUGH EXAMPLE ... 66
4. EXPERIMENTS AND PERFORMANCE STUDY ... 76
4.1 DATASET ... 76
4.2 ALGORITHM IMPLEMENTATION ... 78
4.3 EVALUATION CRITERIA ... 78
4.4 STUDIES ON EFFECTIVENESS ... 79
4.5 STUDIES ON CLUSTER CORRECTNESS ... 82
4.6 RUNTIME ANALYSIS ... 84
5. CONCLUSIONS AND FUTURE WORK ... 86
BIBLIOGRAPHY ... 88
IX
LIST OF TABLES
Table 2.1: Example for calculating TF-IDF for weight assignment ... 23
Table 2.2: Example for weights for finding Euclidean distance ... 25
Table 2.3: String Similarity Matrix ... 30
Table 2.4: Semantic Similarity Matrix with SOCPMI ... 30
Table 2.5: Joint Matrix ... 30
Table 2.6: Maximum-valued Matrix ... 31
Table 2.7: Maximum-valued Matrix element ... 31
Table 2.8: Final Maximum-valued Matrix ... 31
Table 2.9: Example for input weight to clustering algorithm ... 33
Table 2.10: Example for computation of new cluster center ... 34
Table 2.11: Similarity between two emails ... 36
Table 2.12: Example output of 1st iteration of Apriori ... 38
Table 2.13: Example output of 2nd iteration of Apriori ... 38
Table 2.14: Example output of 3rd iteration of Apriori ... 39
Table 2.15: Weights assigned to email attributes ... 43
Table 2.16: Weight for key phrase in each email ... 43
Table 2.17: Data matrix ... 46
Table 2.18: Similarity matrix ... 47
Table 2.19: Example of Email Vectors ... 51
Table 3.1: Rtf for terms in email E1 ... 68
Table 3.2: Number of Features for each email... 69
Table 3.3: Example for similarity between emails ... 72
Table 3.4: Example output of 1st iteration of Apriori ... 74
Table 3.5: Example output of 2nd iteration of Apriori ... 75
Table 3.6: Example output of 3rd iteration of Apriori ... 75
Table 3.7: Example output of 4th iteration of Apriori ... 75
Table 4.1: Usenet newsgroups used in newsgroup data ... 77
Table 4.2: 20 Newsgroup Dataset File content ... 78
X
LIST OF FIGURES
Figure 1.1: Categories of Email Management Tasks ... 4
Figure 1.2: Automatic Folder Creation by Email Clustering ... 11
Figure 2.1: Email as shown on user screen ... 21
Figure 2.2: Parsed Email ... 22
Figure 2.3: Clustered Email ... 34
Figure 2.4: Example for Hierarchical Clustering ... 37
Figure 3.1: Process Flow for AEMS ... 55
Figure 3.2: Algorithm for AEMS ... 56
Figure 3.3: Process Flow for AEG model ... 57
Figure 3.4: Algorithm for Semantic Non-parametric K-Mean ++ Clustering ... 60
Figure 3.5: Algorithm for AEG model ... 61
Figure 3.6: Process Flow for APEG model ... 62
Figure 3.7: Process Flow for APEG model ... 63
Figure 3.8: Example for Indexing ... 65
Figure 3.9: Algorithm for Indexing... 65
Figure 3.10: Email Index File ... 75
Figure 4.1: List of sample queries ... 80
Figure 4.2: Analyzing effectiveness... 80
Figure 4.3: Runtime analysis ... 81
Figure 4.4: F-value comparison of clustering algorithm ... 83
1 CHAPTER 1 INTRODUCTION
Electronic mail, also called as e-mail or email, is an electronic communication system in
which messages are sent from an author to one or more recipients electronically
(Bogawar and Bhoyar, 2012). Email has become a dominant means of exchanging
information across the world for the purposes of business, storing information or for
personal matters. The growth of internet has impacted a lot on the growth of email,
turning it to an important tool for work. The reason for the email popularity is the
speediness of communication, the minimum cost and easiness while using email and most
importantly it is asynchronous communication (Asynchronouscommunications, is in
which data can be transferred intermittently rather than in a fixed stream. For example, a
telephone discussion is asynchronous because both parties can talk when they like. If the
communication were synchronous, each party has to wait a definite interval before
speaking).
Email began as a simple and informal communication between colleagues and led to the
gateway to the paperless office. People are sending and receiving hundreds of messages
daily, communicating with partners and friends, or exchanging files and information
around the globe. In recent years, it has contributed to the development of organizations
that are distributed world-wide, allowing people to communicate around the globe at no
2 1.1 Email Overload
Email overload (Xiang et al., 2009) is the state of completely overwhelming email
inboxes by the amount of email one has received. According to an estimate given by
(Radicati and Hoang, 2011), the number of email messages sent daily has reached around
3.1 billion in 2011, resulting in the evolution of the problem of email overload. The
problem that email inboxes are overloaded with many more tasks like task management
and personal archiving instead of only communication, the study made by (Whittaker and
Sidner, 1996) and (Fisher et al., 2006) showed that, dramatic changes have occurred in
the way emails were handled when “email overload” term was coined and now in this
present century, however, the difference can be seen in terms of archive size which is
increased by remarkable size, whereas the message flow and inbox size remained almost
unchanged.
In the solution to email overload, managing email messages by summarization and
automatically categorizing emails into folders is a challenging application for data mining
techniques. Automatic folder creation is, given a set of email messages and we need to
semantically assign each message to a suitable cluster according to the email content and
similarity between the email messages. Some automatic email folder creating techniques
have been proposed in the related work are: Automatic Clustering Email Management
System (ACEMS) (Schuff et al., 2006), BuzzTrack (Cselle et al., 2007), Automatic
Nonparametric Text Clustering Algorithm (Xiang et al., 2009) and Kernel-selected email
clustering (Yang et al., 2010). Another solution to email overload is given by the email
summarization. The goal of email summarization is to provide concise, informative
3
of message and then decide if the message demands immediate attention. Some email
summarizations techniques have been proposed in the previous studies are: Task-focused
summarization (Oliver et al., 2004), CWS (Clue Word Summarizer) (Carenini et al.,
2007) and Regression based email summarization (Ulrich et al., 2009). Email
categorization into folders and email summarization both fail to find specific email when
there is a vague idea of email sender and vague idea of topic.
1.2 Email Management – Definition and Applications
Email Management is a set of programs that automatically handles email messages and
attachments according to user-defined rules. It can involve spam filtering - finding
whether the received email is spam or not, contact management - management of names
and information of people associated with the names, and email overload which includes
task management, email summarization, personal archiving, and categorization of email
messages in different folders. The goal of any email management system is that it should
be (Entlich, 2006):
Complete: E-mail records should completely keep the transaction including the
recipient(s), sender, time sent, message body text, date sent, subject lines,
attachments should be included in full not just the file name, and recipient full email
ID and name if the email is being sent to the group.
Accurate: The transaction should be reflected by the content of the email records.
Manageable: As part of the daily workflow and records management practices, the
email records should be easy to manage by user.
Secure: The e-mail record should be located in a secure system that controls access,
4
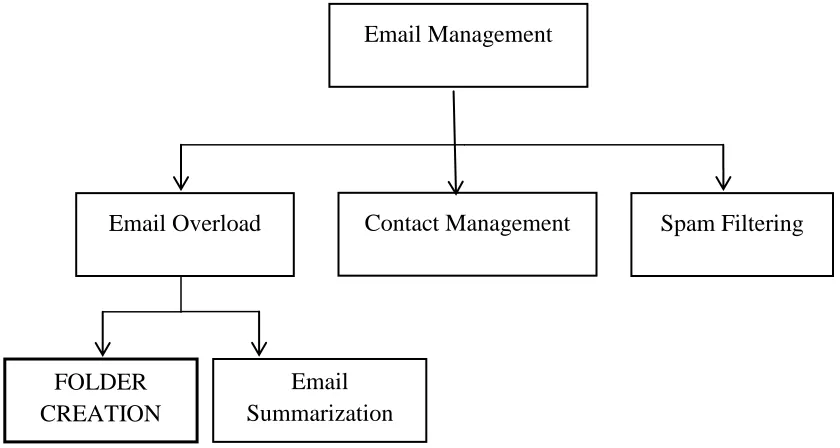
Below Figure 1.1 shows the categories of email management tasks.
Figure 1.1 Categories of Email Management Tasks
1.2.1 Reducing Email Overload by Automatic Folder Creation
Automatic email organization into folders (Xiang et al., 2009) is a way to manage email
messages and to reduce email overload. Many users organize incoming emails in different
folders; it can be topic- oriented like “appointments”, “personal” and “entertainment” or
group-oriented like “courses” and “project” or people- specific like “John” and “Mary”.
To achieve this, many users create some rules to classify their mail by applying data
mining methods such as classification (It is a process of classifying data into predefined
groups) or clustering methods (clustering is used to place email messages into related
groups without prior knowledge of the groups’ definitions). This can be automatic or
semi-automatic i.e. involving user involvement. First, subject and body of each email are
extracted from the input, which is a set of emails messages, i.e., email dataset and
pre-processing is done on the extracted data, i.e., removal of stop words and applying Email Overload Contact Management Spam Filtering
FOLDER CREATION
Email Summarization
5
stemming (Porter, 1997), if needed. Next, email is then represented in some format. Then,
email grouping is done based on the data mining approached such as classification or
clustering methods. Lastly, folders are created for each cluster and topics are detected for
each folder. Some automatic folder creating techniques have been proposed in the
previous studies including (Semantic email clustering (Li et al., 2006a), BuzzTrack
(Cselle et al., 2007), EGM (Ayodele et al., 2010) and (Yang et al., 2010)). However, these
techniques are limited because for instance, if a folder is created by the previously
proposed techniques and in a single folder if there are 2000 email messages on the same
topic then again it is a tedious job to find the desired email. For example, if a folder is
created named “Assignment” and it contains 1500 emails all with assignment
information, it is hard to find an email of a specific individual whose name is not
specifically known by the user to search and it is also time consuming. Specially, these
systems fail when user needs to find an email where user does not know or remember the
specific topic to search with and the sender of email.
1.2.2 Reducing Email Overload by Email Summarization
Email summarization is a technique developed in order to automatically extract the
summary of documents (Ulrich et al., 2009). It is important when people receive hundreds
of messages daily of which some are newsletters, business decision-making messages,
appointment arrangements etc. So, in this case, it would be very useful if reading of those
entire messages can be avoided and instead only the important parts (or summary) are
read to decide if the messages demand immediate attention. The building of such a tool
includes natural language processing such as tokenizer, POS tagging and data mining
6
been proposed and include: Task-focused summarization (Oliver et al., 2004), CWS (Clue
Word Summarizer) (Carenini et al., 2007) and Regression based email summarization
(Ulrich et al., 2009). These techniques automatically extract the summary of documents
extract the important candidate noun phrases (NPs) using POS tagger tools from the email
message and manually classify the selected NPs into those that should be included in the
summary and those are not. These NPs are used to build training set which is then used to
summarize incoming messages. However, these techniques are limited because it is hard
to find an email of a specific individual whose name is not specifically known by the user
to search.
1.2.3 Contact Management
Contact Management is another email information management issue which manages
names and addresses associated with key contacts (Whittaker et al., 2004). While most
email systems can be customized to automatically extract email addresses into the address
book, the other information (such as phone numbers) must be extracted manually from
messages, which is tedious and error-prone process. But lots of information can be
automatically extracted from email; for example, important contacts can be identified
automatically through message-header information. Having identified contacts, it should
also be possible for data mining techniques such as classification to automatically extract
additional information from, such places as, signature files and web pages that could then
be used to populate contact address fields. One of the contact management systems is
7 1.2.4 Spam Filtering
Spam filtering is a process of sorting out by identifying the unsolicited commercial mails
(spam/junk/bulk) from a user’s mail stream. For example, separating spam email
“ONE-POUND-A-DAY DIET” from the email by a friend for technical help. When internet
started for common public in mid-1990 the spam in email started to become a problem
and is growing exponentially. The large amount of spam not only causes bandwidth
problems, but also takes up valuable time from email users who try to separate and delete
many unsolicited messages every day. Hence, spam filters are used to automatically
handle spam in email. According to (Katakis et al., 2006), the method of building a spam
filter can be categorized in two ways: Technical or Non-Statistical Approaches - which
include white and black lists, digital signatures and handcrafted rules, and Machine
Learning or Statistical Approaches like Naïve Bayes, Support Vector Machines, Latent
Semantic Indexing, Case-Based Reasoning and Stacking Classifiers - which includes
statistical linguistic analysis and are machine learning algorithms. Some examples of
spam filtering systems are SpamBayes (Meyer and Whateley, 2004), Online supervised
spam filtering (Cormack et al., 2007) and Semi-supervised spam filtering (Whissell and
Clarke, 2011).
1.3 Data Mining Approaches for Email Management
Data mining is the analysis step of knowledge discovery from different views and
situations and transforming it into the human useful information that can further be used
for many purposes like decision making for day by day running of business. Data mining
8
identifying valid, novel, potentially useful and understandable patterns in data. There are
different techniques and approaches involved in discovering interesting information from
huge set of data. Some of the approaches are: Classification, Clustering, Regression,
Association rule mining.
Classification is a process of classifying data into predefined groups. This can involve
assigning a given email into "spam" or "non-spam" classes. The algorithm that
implements classification is known as a classifier. These classifiers can be built by
various data mining techniques such as Naïve Bayes (Sahami et al., 1998), Support
Vector Machines (Klimt and Yang, 2004), Rule Learning (Pazzani, 2002), Decision Trees
based algorithms (Quinlan, 1986), Neural Networks (Diao et al., 2000) and Inductive
Logic Programming (Crawford et al., 2002).
Clustering is used to place email messages into related groups without prior knowledge of
the groups’ definitions. This can involve automatic folder creation from a set of incoming
messages of an email. K-means clustering algorithm (Li et al., 2006a) is one of the
popular techniques for clustering.
Regression in data mining is the function that models the data, which can further be used
to foresee future behavior of new data. This technique only works well with continuous
quantitative data such as weight, speed or age. Genetic programming is one of such
techniques used for this purpose.
Association rule mining (Han and Kamber, 2000) is a method for discovering interesting
relations between attributes in large databases. For example, the rule {milk, bread} =>
9
and bread together, customer is likely to also buy tea. Such information can be used as the
basis for decisions about marketing activities such as promotional pricing or product
placements.
1.4 Automatic Folder Creation by Data Mining Techniques
Existing approaches for automatic folder creation are based on two data mining
techniques: Email Classification (SpamBayes (Meyer and Whateley, 2004), Online
supervised spam filtering (Cormack et al., 2007) and Semi-supervised spam filtering
(Whissell and Clarke, 2011)), and Email Clustering (Semantic email clustering (Li et al.,
2006a), BuzzTrack (Cselle et al., 2007), EGM (Ayodele et al., 2010) and Kernel-selected
clustering (Yang et al., 2010)).
1.4.1Automatic Folder Creation by Classification
In general, email classification takes into account the assignment of an email message to
one of a pre-defined set of categories. Automatic email classification aims at building a
model which will undertake this task on behalf of the user, by using data mining
technique of classification. Existing email classification systems for folder creation are
given by (Online supervised spam filtering (Cormack et al., 2007) and Semi-supervised
spam filtering (Whissell and Clarke, 2011)). In classification there are two stages: training
stage and classification stage. During training stage, after preprocessing emails, the email
messages are grouped into classes i.e. class labels are given to email groups. In
classification stage, the rest of the emails are taken as test data and classified using same
classification algorithm , using the classifier such as Neural Networks (Diao et al., 2000),
10
used during the training set, for assigning each email a class. Though classification can
provide a better way to arrange email in folders but it is a semi-supervised approach.
1.4.2 Automatic Folder Creation by Clustering
Email Clustering is one of folder creating methods which are used for email mining.
Clustering is used for automatic folder creation to reduce email overload. Existing email
clustering systems for folder creation are given by (ACEMS (Schuff et al., 2006),
BuzzTrack (Cselle et al., 2007), Automatic Non-parametric clustering (Xiang et al.,
2009), EGM (Ayodele et al., 2010) and Kernel-selected clustering (Yang et al., 2010)).
General steps for folder creation by clustering are shown in Figure 1.2. First, subject and
body of each email are extracted from the input, which is a set of email messages, i.e.,
email dataset and pre-processing is done on the extracted data, i.e., removal of stop words
and applying stemming (Porter, 1997), if needed. Next, email is then represented in some
format. For example, ((Cselle et al., 2007), (Zeng et al., 2008) and (Yang et al., 2010))
represented email data in vector space model (VSM) (Salton et al., 1975) (this model is
discussed later in section 2.2). In VSM the terms of subject and body with their respective
weights (can be calculated using term frequency (TF)) are combined to form an email
vector such as email E1 can be represented as email vector:
E1= (copy: 3, apa: 2, citation: 2)
Where, “copy” is the term with 3 as weight, which is the number of times terms appeared
in the emails. Then, email grouping or clustering is done ((Cselle et al., 2007) based on
the data mining clustering approached such as K-Means clustering method (Li et al.,
11
Email clustering is a better way to provide automatic folder creation for the purpose of
reducing email overload because it is unsupervised and is better when one is using
unlabeled data.
Figure 1.2 Automatic Folder Creation by Email Clustering
1.5 Problem with Current Email Management Systems
BuzzTrack proposed by (Cselle et al., 2007) is the popular tool for folder creation.
BuzzTrack’s functionality uses clustering as the techniques for automatic folder creation
of email messages. Given a set of email messages as {m1, m2, m3 …. mN} and these
emails are grouped into clusters {c1, c2 …. cM}. Each email contains Receipts ID (To),
Sender ID (From), Message ID, date and time on which message received (date), subject
of email (subject) and content of email. After tokenizing, the email body and subject into
term of one word each, pre-processing is done by converting foreign character into
Email Dataset (As input)
Email Mining (Extraction of each email data, e.g.
subject and content of email)
Pre-processing of mined email data (e.g. applying stemming and removing
stop words)
Clustering for folder creation (e.g. K-Means
clustering)
12
canonical form, removing words with special character, identifying parts-of-speech for
topic labeling and lastly applying stemming (Porter, 1997). After pre-processing, there
exists a set of all n stemmed terms that appear in all emails and weight is assigned to all n
terms by using TF-IDF method (Salton and Buckley, 1988) (described in detail in section
2.2). Then, the clustering is applied to these terms by calculating four types of similarity:
text similarity for email content using cosine similarity coefficient, subject similarity
which calculates the overlap of the set of words between two email subject line, people
similarity compares the set of people participating in a topic with the set of people to
which the email is addressed and thread similarity which measures the percentage of
emails in the cluster which are in the same thread. This similarity is then combined and
normalized to find the decision score to decide which emails belong to which cluster
(Details are explained further in section 2.6.2). The problem identified was that
BuzzTrack’s algorithm does not include any feature selection method (feature selection is
a selection of relevant words from the email that can best represent the content of email.
For example, in sentence “Please find assignment #5 attached” word “assignment”,
“attached” are more important than word “please” for sentence representation. This is
usually being done by calculating some quality measure for each word and then selecting
to use only the top-N features of the rank. Details are explained in section 2.3), which can
significantly reduce the time taken for execution of the program.
Secondly, Kernel-selected clustering algorithm (Yang et al., 2010) proposed for the
purpose to detect topics from the email clusters for automatic folder creation. In this
approach emails are pre-processed by removing the stop words and stemming of the data,
13
combining the body and subject terms of email for clustering by proposed advance
K-Means algorithm, a kernel selected algorithm based on the lowest similarity. In this
clustering method the initial cluster center is chosen randomly, for example, E2. Then all
other cluster centers are chosen by taking similarity between two emails, where similarity
(Cosine similarity coefficient) is minimal among all and similarity should be less than the
pre-defined threshold β. Lastly, algorithm follows the basic K-Means clustering (Lloyd,
1982). Detailed description is given in section 2.6.5.
The main limitation of both BuzzTrack and Kernel-selected clustering algorithm (Yang et
al., 2010) is that they fail to find those emails when user does not have clear idea of the
topic of the email.
The problems with the currently automatic folder creation systems for handling email
overload can be divided into two parts: Functional and Scientific. Functional deficiency is
the problem that the current systems (ACEMS (Schuff et al., 2006), BuzzTrack (Cselle et
al., 2007), Automatic Non-parametric clustering (Xiang et al., 2009), EGM (Ayodele et
al., 2010) and Kernel-selected clustering (Yang et al., 2010)) lack in some of the tasks
needed for email management. They are:
a. Folder categorization and email summarization individually do not give specific
contribution to handling email overloadwhen there is vague idea of email sender
and vague idea of topic.
b. After the folder creation, if a folder contains 2000 emails on the same topic then
again it is a tedious job to find the desired email. For example, if a folder is
14
information, it is hard to find an email of a specific individual whose name is not
specifically known by the user to search, which in-turn does not give specific
contribution to reducing email overload and is time consuming.
The scientific deficiency is the problem with the existing algorithms. They are:
c. There is a lack of intelligent system for data extraction from the email for purpose
of feature selection. Feature selection is a selection of relevant words from the
email that can best represent the content of email. For example, in sentence
“Please find assignment #5 attached” word “assignment”, “attached” are more
important than word “please” for sentence representation. This is usually being
done by calculating some quality measure for each word and then selecting to use
only the top-N features of the rank.
d. There is a lack of semantic relation between the words of two messages, for
example, the synonyms are not taken into account when dealing with similarity.
e. Most of the algorithms are using vector space model but it has the disadvantage
that the vector dimension is very large compared to the number of words in a short
text or sentence which makes the vector terms have many null values, which in
turn is inefficient for sentence representation (Li et al., 2006b). Details with
example is shown in section 2.2
1.6Thesis Contributions
This thesis proposes an email mining technique for solution to email overload problem
based on email clustering and summarization. The approach applies data mining
15
creating sub-folders based on the people sending the emails (or on the email IDs) and
lastly creating the index of the folders name. Folder summary is also created which
extracts frequent patterns from the emails of respective folders.
The following are main contributions of this thesis:
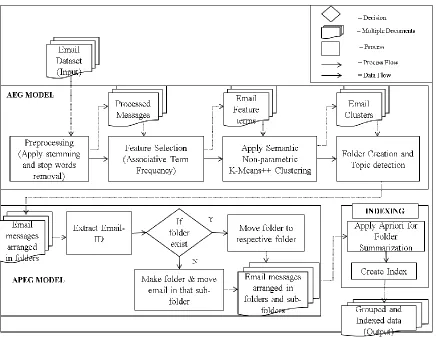
1. Proposed AEMS (Automatic Email Management System) model which manages
email by organizing similar email in the folders (model 1 named AEG), then
again organizes emails of each folder into subfolder (model 2 named APEG)
where subfolder will contain emails sent by only a particular person and lastly
creating the index.
2. Defined a term named Associative Term Frequency and introduced a feature
selection method based on the associative frequency of the term in the whole
email dataset for model AEG (Automatic Email Grouping).
3. Proposed Semantic Non-parametric K-Means++ clustering for folder creation,
which overcomes the problem of random seed selection and pre-defined
cardinality (k) of clustering in K-Means and K-Means++ clustering algorithms by
selecting the seed according to the email weight and deciding the cardinality
according to the similarity between the email content respectively, along with
adding semantics to the clusters.
4. Proposed algorithm for APEG (Automatic People based Email Grouping) model
which creates sub-folders based on the sender of the email.
5. Proposed method for indexing the folders created, which contain name and to the
16
contain the important keywords from the folder which is helpful in identification
of content of folder.
1.7Outline of Thesis
The remainder of the thesis is organized as follows: Chapter 2 reviews related work to
this thesis. Chapter 3 details discussion of the problem addressed along with the new
algorithms proposed. Chapter 4 gives performance analysis and experiments. Chapter 5
draws the conclusion of this research and discusses future work.
17 CHAPTER 2 RELATED WORK
As discussed earlier email overload is a big problem faced by the email users. It is being
researched ((Xiang et al., 2009) and (Cselle et al., 2007)) that automatic folder creation is
a part of email mining which can immensely reduce email overload. Record management
is the technique to manage emails as an archive or as information that can be useful for
future. It is just a systematic organization for long term storage and access of email
archive (e.g., project, department, and thesis), and the establishment of appropriate
records series and records maintenance schedules. Mainly when taken the overlook to the
trend of research for email mining the work usually starts from extraction of data and the
selection of features before applying data mining techniques such as classification or
clustering for semi-automatic or automatic folder creation of email messages.
2.1 Email Dataset
Email dataset is a large and structured set of email messages which is used to do
statistical analysis and hypothesis testing for research purposes in the field of email
mining. There are many types of email dataset available including Enron email dataset
(Klimt and Yang, 2004), BC3 (British Columbia Conversation Corpus) (Ulrich et al.,
2009), W3C dataset used for TREC Enterprise Track (Balog and de Rijke, 2006),
Attachment Prediction Dataset (Klimt and Yang, 2004) and Enron Sent dataset (Klimt
and Yang, 2004). Depending on the purpose of research the data set can be chosen for
18
Enron email dataset given by (Klimt and Yang, 2004) is a most popular dataset used for
the purpose of email management. This dataset is a public, cleaned and contain large set
of email messages organized in folders and contain more than 200 thousand messages
belonging to 158 users. For automatic folder creation to reduce email overload this
dataset was used by (Kulkarni and Pedersen, 2008), (Li et al., 2006a), (Cselle et al.,
2007), (Ayodele et al., 2010), and (Nagwani and Bhansali, 2010). Second popular data set
used is 20 Newsgroups given by (Lang, 1995) which is just a collection of 20 newsgroup
document contained in almost 20 different newsgroups some of which are closely related
and some are highly unrelated. It is designed mainly for the purpose of text classification
and text clustering. This data set was used by (Yang et al., 2010) and (Kulkarni and
Pedersen, 2008).
2.2 Email Pre-processing and Representation
The email consists of both structured information i.e., email header and unstructured
information such as subject and body of the email. Any type of manipulation is done on
the unstructured information available in the message. Pre-processing of raw data is the
first step for any email management task. In this step the email header, email body and
attachments are parsed. From the parsed data subject and email content or other fields
(sender-ID, receiver ID etc) are extracted. Once the required text is obtained from the
server, we need to remove stop words such as ‘the’, ’for’, ‘of’ etc from the data obtained.
Next, stemming algorithm can be used to stem the data. For example, words ‘connection’,
’connecting’, ’connected’ will be converted to ‘connect’. The plug-in can be developed
19
whole system development. Such plug-in can be developed with the help of JavaMail,
Visual Studio Tools or by using C++ language components with python. JavaMail is an
open source java API (Application Programming Interface, which is an interface used by
software components to communicate with each other) used to send or receive email.
Later versions also allow fetching data from the emails.
Once the data is being extracted from the email it is then represented in some format. The
most prevalent model for representation is the vector space model (Salton et al., 1975). In
this model every email message is represented by a single vector and each element as a
token or feature. In such type of data the tokens are usually words or phrases. These
tokens can be categorized mainly into three categories: Unigram, Bigram and
Co-occurrence.
Unigram: unigrams are just significant individual words. For example, in a data such as
“hello dear, how are you?” the unigrams are ‘hello’, ‘dear’, ‘how’, ‘are’ and ‘you’.
Bigram: bigrams are pair of two adjacent words. For example, in a data such as “hello
dear, how are you?” the bigrams are ‘hello dear’, ‘dear how’, ‘how are’ and ‘are you’.
Besides, in bigrams word sequence is important. ‘hello dear’ and ‘dear hello’ are two
different units.
Co-occurrence: Co-occurrences are same as bigrams but the only difference is, here the
word sequence is not important. For example, ‘hello dear’ and ‘dear hello’ are treated as
single unit as their order does not matter. There is another feature called target
20
Once the tokens are found the weights are assigned, these can have Boolean value (0 or 1)
in order to denote the presence or absence of the token in the document, or weight
(usually between 0 and 1) to denote the importance of the token for the document
(Androutsopoulos et al., 2000). Now the email can be represented as a vector, ej =
(w1j,…,wnj), where weights w1j to wnj are the weights of tokens for the particular email j,
In weight wij, index i refers to token in collection of tokens. Suppose we use words as
tokens, then refers to the ith word of a set of distinct words (Katakis et al.2006). The
weights can be assigned by any of the information retrieval methods. Some of these are
TF (Term Frequency), TF-IDF (Term Frequency – Inverse Document Frequency) or
cosine normalization, which is used when there, is needed to map the values of the weight
into the interval. TF is used to determine how often a term occurs in a document. The
TF-IDF (Salton and Buckley, 1988) is determined when TF is combined with inverse
document frequency (IDF, is a measure of whether the term is common or rare across all
documents, obtained by dividing the total number of documents by the number of
documents containing the term (DF – Document Frequency), and then taking
the logarithm of that quotient). TF-IDF is given by the following formula in Equation 2.1:
(2.1)
Where, is the weight of token in email j.
( ) is the TF-IDF of term in email .
is the term frequency i.e., number of time token occurs in email .
N is the total number of emails in the dataset.
21
Weight ( ) of token in email can also be given by cosine normalization (Sebastiani,
2002). It is used to map the values of the weight into the [0,1] interval and given by the
Equation 2.2:
√∑ (2.2)
Where, |v| is the size of the vocabulary or the number of words in dataset,
is a TF-IDF of term in email according to Equation 2.1 and : It is a
weight of token i.e., the weight of token in email j.
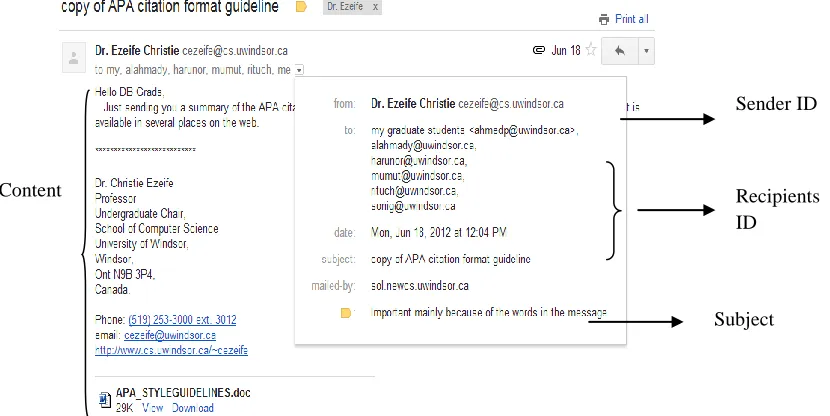
For example, Figure 2.1 shows an example of email received and the way it appears on
the user screen and the contents of it.
Figure 2.1: Email as shown on User Screen
After pre-processing through any API (Application Programming Interface) the parsed
information is as shown in Figure 2.2.
Sender ID
Recipients ID
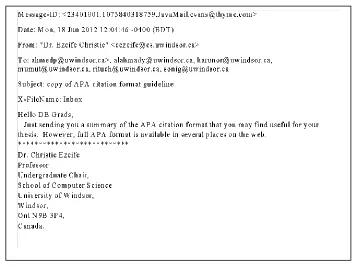
22
Figure 2.2: Parsed Email
Once the weights are assigned to the tokens many email management methods ( (Schuff
et al., 2006), (Manco et al., 2008), (Zeng et al., 2008) and (Yang et al., 2010) )used
Vector Space Model given by (Salton et al., 1975) to represent each email as a vector
which is helpful for further processing.
In vector space model the terms of subject and body with their respective weights are
combined to form an email vector, giving the terms of subject more weight because they
are more important than terms of email content. For Figure 2.2, after pre-processing and
removal of stop words, also by assigning the weights, the email vector will be:
Ej = (copy: w1, APA: w2, citation: w3, format: w4, guideline: w5, summary: w6, thesis: w7
….. Web: wn)
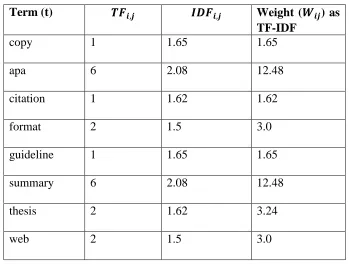
23
Table 2.1: Example of TF-IDF
Term (t) Weight ( ) as
TF-IDF
copy 1 1.65 1.65
apa 6 2.08 12.48
citation 1 1.62 1.62
format 2 1.5 3.0
guideline 1 1.65 1.65
summary 6 2.08 12.48
thesis 2 1.62 3.24
web 2 1.5 3.0
Therefore, email Ej will be represented as follow:
Ej = (copy: 1.65, APA: 12.48, citation: 1.62, format: 3.0, guideline: 1.65, summary: 12.48,
thesis: 3.24 ….. web: 3.0)
The limitation of vector space model is that there is a loss of correlation and context of
each term which are very important in understanding the document. Secondly, since the
vector dimension is very large compared to the number of words in a short text or
sentence which make the vector terms having many null values, which in turn is
inefficient for sentence representation (Li et al.2006b).
Regardless of using the vector space model, another method for tokenization is Natural
Language Processing (NLP) (Li et al.2006a). These are software, which include group
of libraries, frameworks, and applications for symbolic, statistical natural language and
speech processing. NLP tools typically do sentence detection, tokenization,
named-24
entity detection among others. Some NLP tools are Apache OpenNLP (Apache OpenNLP
- Download, 2011) and Text Engineering Software Laboratory (Tesla) used for Eclipse
IDE (Integrated development environment for java developers).
2.3 Feature Selection
Feature selection is a selection of relevant words from the email that can best represent
the content of email. For example, in sentence “Please find assignment #5 attached” word
“assignment”, “attached” are more important than word “please” for sentence
representation. This is usually being done by calculating some quality measure for each
word and then selecting to use only the top-N features of the rank. There are many feature
selection methods such as, TF-IDF. It is a method mostly used for feature selection
purpose, for email dataset it should be used for finding the importance of the term in the
whole dataset, which can be calculated as explained before in section 2.2. Now, after
calculating the TF-IDF either all terms are considered as features or terms having the
value greater or equal to certain user defined threshold, is taken as features for further
processing. This method was adopted by (Kulkarni and Pedersen, 2008), (Cselle et al.,
2007), (Xiang et al., 2009).
2.4 Distance Finding Methods
After the feature selection the email clustering is done for folder creation. So, when
applying any clustering method on text data there is need to find the distance between two
25
are many methods including Euclidean distance, Cosine similarity coefficient and
semantic similarity.
2.4.1 Euclidean Distance
The Euclidean distance between two data points p = (p1, p2... pn) and q =
(q1, q2... qn) is given by Equation 2.3:
√∑ (2.3)
For example, consider two emails vectors E1 and E2 with their respective weights for
each token (weights can be assigned as shown previously in section 2.2, page 31), as
shown in Table 2.2
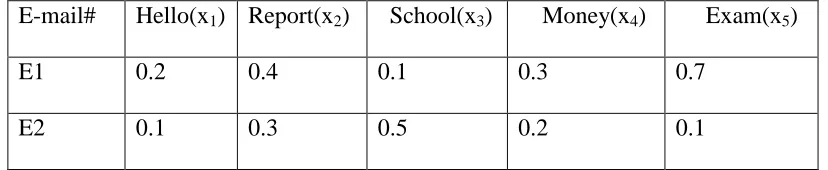
Table 2.2: Example for weights for finding Euclidean distance
E-mail# Hello(x1) Report(x2) School(x3) Money(x4) Exam(x5)
E1 0.2 0.4 0.1 0.3 0.7
E2 0.1 0.3 0.5 0.2 0.1
Here, 0.2 represents weight for term ‘Hello’ in email E1. Therefore,
√
= 0.55
The limitation (Markov and Larose, 2007) of using this method is that this method greatly
depends on the length of the vector to be compared and when finding the similarity
between two documents, the documents should also be close in the vector space. For
26
document there will be a great distance even though they both are very similar to each
other.
2.4.2 Cosine Similarity Coefficient
The cosine coefficient for similarity is a degree of similarity between two vectors attained
by measuring the cosine of the angle between them, where two vectors are representation
of documents. In information retrieval, the cosine similarity of two documents will range
from 0 to 1, therefore, the angle between two term frequencies vectors cannot be greater
than 90° because the term frequencies (number of times a particular term occurs in
particular email) cannot be negative, thus the lowest value for TF-IDF will be zero. The
cosine similarity measure can be computed in two ways: Binary cosine similarity measure
and weighted cosine similarity measure.
Binary Cosine Similarity Measure ( ): A word form receives a score of 1 when it
appears in a document and 0 when it does not appear. The similarity between an email j
and q is given in Equation 2.4.
√∑ √∑ (2.4)
Where, is the number of tokens common in email j and email q,
is a weight of token i.e., the weight of token in email j; and
is a weight of token i.e., the weight of token in email q.
Weighted Cosine Similarity Measure ( ): The similarity between a document j and q is
27
∑
√∑ √∑ (2.5)
The weighted cosine similarity measure is used in approaches given by (Cselle et al.,
2007), (Zeng et al., 2008) and (Yang et al., 2010).
For example, consider Table 2.1
√ √
= 0.590
The limitation of using this measure is the lacks of correlation and does not consider the
semantics while finding the text similarity.
2.4.3 Semantic Text Similarity (STS) method
The method proposed by (Islam and Inkpen, 2008), determine the similarity of two texts
from semantic and syntactic information they contain. There are three main similarity
functions to determine the text similarity. Firstly, string similarity and semantic word
similarity; secondly, optimal common-word similarity function; and finally above string
similarity, semantic similarity and common-word order similarity are combined with
normalization.
2.4.3.1 String Similarity between Words
For finding the string similarity between two words and , they calculated normalized
longest common subsequence (NLCS)( ) given in Equation 2.6,
𝑁𝐿 𝑆( ) 𝑣 𝑙 𝑔 ℎ 𝑙 𝑔 ℎ(𝐿𝐶𝑆( 𝑙 𝑔 ℎ( 𝑗))
28
Where, and are the words from the sentence which we need to find the similarity.
NLCS is calculated to take into account the length of both the shorter and longer string.
For example, consider = albastru and = alabaster, then LCS( , sj ) = albastr
therefore, NLCS( , sj ) = 72/(8 × 9) = 0.8
Secondly, Normalized Maximal Consecutive Longest Common Subsequence starting at
character 1 (NMCLCS1( )) is given in Equation 2.7,
𝑁𝑀 𝐿 𝑆 ( ) 𝑣 𝑙 𝑔 ℎ(𝑀𝐶𝐿𝐶𝑆𝑙 𝑔 ℎ 𝑙 𝑔 ℎ( ( 𝑗))
𝑗) (2.7)
In our example, MCLCS1( , sj ) = al therefore, NMCLCS1( , sj ) = 22/(8 × 9) = 0.05
Thirdly, Normalized Maximal Consecutive Longest Common Subsequence starting at any
character n (NMCLCSn( )) is given in Equation 2.8:
𝑁𝑀 𝐿 𝑆 ( ) 𝑣3
𝑙 𝑔 ℎ(𝑀𝐶𝐿𝐶𝑆 ( 𝑗))
𝑙 𝑔 ℎ 𝑙 𝑔 ℎ( 𝑗) (2.8)
In our example, MCLCSn( , sj ) = bast therefore, NMCLCSn( , sj ) = 42/(8 × 9) = 0.2
And then these measures are combined to get the string similarity (∝) between strings
word and , which is given by Equation 2.9.
∝ 𝑤 𝑣 𝑤 𝑣 𝑤3𝑣3 (2.9)
Here, 𝑤 , 𝑤 , 𝑤3 is the weights and 𝑤 𝑤 𝑤3 .
String similarity, S = α1v1 + α2v2 + α3v3 = 0.33 × 0.8 + 0.33 × 0.05 + 0.33 × 0.2 = 0.275
2.4.3.2Sematic Similarity between Words
To find the semantic similarity between words (Islam and Inkpen, 2008) used Semantic
PMI (Point-Wise Mutual Information) similarity function. Semantic PMI similarity
29
𝑆 𝑚 𝑤 𝑤 (𝑓 𝑤𝛽 𝑤 𝛽 ) 𝑓 𝑤𝛽 𝑤 𝛽 (2.10)
Where, 𝑓 𝑤 𝑤 𝛽 is the 𝛽- PMI summation function for word 𝑤 with respect to word
𝑤 and is given in Equation 2.11:
𝑓 𝑤 𝑤 𝛽 ∑𝛽 𝑓𝑝𝑚 𝑋𝑤 𝑤 𝛾
(2.11)
Where, 𝑋𝑤is the set of words sorted in descending order by their PMI values with 𝑤 and
taken the top 𝛽 words having 𝑓𝑝𝑚 𝑤 > and is given in Equation 2.12:
𝑓𝑝𝑚 𝑤 𝑓𝑏 𝑤 𝑚
𝑓𝑡 𝑓𝑡 𝑤 (2.12)
Where, 𝑓 is the type appeared in the entire dataset, 𝑓𝑏 𝑤 is the times word
appeared with word 𝑤 and 𝑚 is the total number of tokens in dataset.
For example, (Islam and Inkpen, 2008) consider two sentences:
P = “A cemetery is a place where dead people’s bodies or their ashes are buried.”
R = “A graveyard is an area of land, sometimes near a church, where dead people are
buried.”
Step 1: After eliminating all stop words and lemmatizing, we get P = {cemetery, place,
where, dead, body, ash, bury} and R = {graveyard, area, land, sometime, near, church,
where, dead, bury} where m = 7 and n = 9.
Step 2: Three tokens (where, dead and bury) in P exactly matches with R therefore, δ = 3.
Now remove these three from both P and R. So, P = {cemetery, place, body, ash} and R =
{graveyard, area, land, sometime, near, church}. As m− δ ≠ 0, so proceed to next step.
Step 3: Construct a 4*6 string matching matrix, M1, as shown in Table 2.3. Consider the
30
longer token (place), τ = 4 is the length of the shorter token (land) and 2 is the maximal
length of the consecutive portions of the shorter token that consecutively match.
Table 2.3: String Similarity Matrix
Graveyard area Land sometimes near church Cemetery 0.023 0.021 0 0.129 0.052 0.041
Place 0.037 0.083 0.132 0.017 0.033 0.022 Body 0.018 0 0.041 0.021 0 0
ash 0.024 0.083 0.055 0.028 0.055 0.037
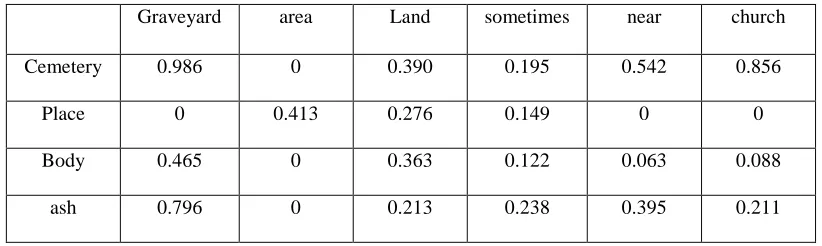
Step 4: Construct a 4 * 6 semantic similarity matrix by calculating SOCPMI method as
shown in Table 2.4.
Table 2.4: Semantic Similarity Matrix with SOCPMI
Graveyard area Land sometimes near church
Cemetery 0.986 0 0.390 0.195 0.542 0.856 Place 0 0.413 0.276 0.149 0 0 Body 0.465 0 0.363 0.122 0.063 0.088
ash 0.796 0 0.213 0.238 0.395 0.211
Step 5: Construct a 4 × 6 joint matrix as shown in Table 2.5, M and assign equal weight
factor by setting both ψ and ϕ to 0.5.
Table 2.5: Joint Matrix
Graveyard area Land sometimes near church
Cemetery 0.505 0.010 0.195 0.162 0.297 0.449
Place 0.018 0.248 0.204 0.083 0.0.17 0.011
Body 0.242 0 0.039 0.071 0.032 0.044
31
We find the maximum-valued matrix-element, γi j = 0.505 and add it to ρ as γi j ≥ 0. So, ρ
= {0.505}. The new M after removing ith (i = 1) row and j th ( j = 1) column is, as shown
in Table 2.6:
Table 2.6: Maximum-valued Matrix
area Land sometimes near church
Place 0.248 0.204 0.083 0.0.17 0.011
Body 0 0.039 0.071 0.032 0.044
ash 0.041 0.134 0.133 0.225 0.124
We find the maximum-valued matrix-element, γi j = 0.248 for this new M and add it to ρ
as γi j ≥ 0. So, ρ = {0.505, 0.248}. The new M after removing ith (i = 1) row and j th ( j =
1) column is, as shown in Table 2.7:
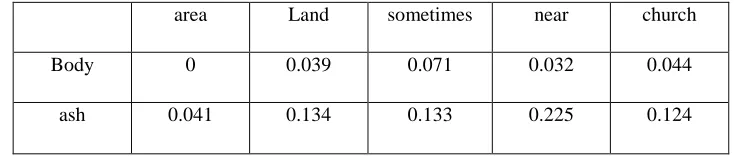
Table 2.7: Maximum-valued Matrix element
area Land sometimes near church
Body 0 0.039 0.071 0.032 0.044
ash 0.041 0.134 0.133 0.225 0.124
Here, 0.225 is the maximum-valued matrix-element and γi j ≥ 0. So, ρ = {0.505, 0.248,
0.225}. The new M after removing ith (i = 2) row and j th ( j = 3) column is, as shown in
Table 2.8:
Table 2.8: Final Maximum-valued Matrix Land sometimes near
32
We find 0.071 as the maximum-valued matrix-element and γi j ≥ 0. So, ρ = {0.505, 0.248,
0.225, 0.071}. The new M is empty after removing ith (i = 1) row and j th ( j = 2) column.
We proceed to next step as m− δ − |ρ| = 0. (Here, m = 7, δ = 3 and |ρ| = 4)
Step 6: S(P, R) = (3 + 1.049) × 16/126 = 0.514
2.4.3.3Common Word Order Similarity between Sentences
The Common Word Order Similarity is then measured is the denominator, the largest
possible dissimilarity value (normalized difference Common Word Order). Suppose, P
and R has a and b tokens respectively. There are tokens in P exactly matches in R and
from P these tokens are moved to X and from R moved to Y. Then, Common Word Order
Similarity is given by the Equation 2.13:
𝑆
{
( ∑ ) 𝑓 𝑣
( ∑
) 𝑓
𝑓
(2.13)
We sum up all elements in and add 𝑀 𝑤𝑓 𝑤𝑓𝑆 to get the total score. Now
by multiplying 𝑀 by the reciprocal harmonic mean of 𝑚 and , we get the balance score between 0 and 1, inclusively. The score is given by Equation 2.14
𝑆 𝑀 𝑚 𝑚 . (2.14)
2.5 Data Mining Techniques for Email Mining
2.5.1 Clustering Methods
Clustering is one of the data mining methods which are used for the purpose of email
mining. Clustering is used for automatic folder creation for the purpose to reduce email
33
(Schuff et al., 2006) and K-means clustering by (Surendran et al., 2005) and (Nagwani
and Bhansali, 2010).
2.5.1.1 K-Mean Clustering Algorithm
This is the most widely used clustering algorithm proposed by (Lloyd, 2006). K-Means
clustering algorithm mainly has four steps. For example, we have 6 emails (E1,.., E6)
with the terms having their respective weights as shown in Table 2.9 and we want to
group those emails in two clusters.
Table 2.9: Example for input weight to clustering algorithm
E-mail# Hello(x1) Report(x2) School(x3) Money(x4) Exam(x5)
E1: .2 .4 .1 .3 .7
E2: .1 .3 .5 .2 .1
E3: .5 .4 .1 .3 .9
E4: .1 .1 .5 .4 .2
E5: .2 .4 .1 .7 .3
Step1: First randomly two samples or email vectors will be selected as initial cluster
center. It could be any two emails from E1 to E5. As we are considering 2 clusters that
means K=2. Assume in our case randomly chosen centers are E2 and E5.
Step2: Assign other emails to their closest cluster center. Closeness of any two emails can
be determined by any distance algorithm such as Euclidian distance, squared Euclidean
distance, Mahalanobis distance (Mahalanobis, 1936) and Cosine similarity coefficient as
34
So, according to our example one email will be picked from E1, E3 and E4. Assume E1 is
picked first. Next, the distance between E1 and E2, and E1 and E5 will be calculated and
E1 will be assigned to that cluster of which distance is lower. If the distance calculated is
lower in E1 and E2, then E1 will be assigned to E2.
Assume E1, E2 and E4 are clustered together and E5 and E3 clustered separately. In this
step we need to find the mean (M1) of E1, E2 and E4 for one cluster and mean (M2) of
E5 and E3 in another cluster. So, new centers will be M1 and M2.
Figure 2.3: Clustered Email
Step3: In this step we need to find the new centers for clustering which will be the
arithmetic mean of existing clusters. In our example, the new cluster center will contain
the values, as shown in Table 2.10.
Table 2.10: Example for computation of new cluster center New
Cluster Center
Hello(x1) Report(x2) School(x3) Money(x4) Exam(x5)
C1: 0.133
((.2 + .1 + .1)/3)
0.267
((.4 + .3 + .1)/3)
0.367 ((.1 + .5 + .5 )/3
0.3
((.3 + .2 +.4)/3
0.33
((.7 + .1 + .2)/3
C2: 0.35 (.5+ .2)/2 0.4 (.4+ .4)/2 0.1 (.1+ .1)/2 0.5 (.3+ .7)/2 0.6 (.9+ .3)/2
Hence the cluster centers will be C1 and E5. E2
E1
E4 E3
35
Step4: Again each email is compare with these new cluster centers and is assigned to
those clusters where the distance is minimum.
Suppose, again E1, E2 and E4 are clustered together and E5 and E3 clustered separately.
Since new clusters form are identical to the previous one. Therefore the algorithm stops
and finally we have two clusters: Cluster 1 containing E1, E2 and E4 and Cluster 2
containing E3 and E5.
Limitation of using K-Means clustering algorithm is that it is sensitive to initialization
and to the presence of outliers.
2.5.1.2 K-Mean++ Clustering Algorithm
The algorithm was first proposed by (Arthur and Vassilvitskii, 2007). The K-means++
algorithm differs from the general K-means algorithm in first step where we need to
select the cluster centers. The algorithm works as follows:
Step1: In the first step, it will compute the similarities between every two emails and will
take those two emails as two centers, which have minimal similarity among all. Similarity
between two emails is computed using any distance formula which is explained before. In
our example, we have six emails (E1, E2, E3, E4, E5 and E6). So according to this
algorithm we will compute the distances between every two emails as shown in Table
36
Table 2.11: Similarity between two emails
Email# E1 E2 E3 E4 E5 E6
E1 1 .2 .11 .2 .12 .2
E2 .2 1 .12 .082 .21 .4
E3 .11 .12 1 .5 .13 .6
E4 .2 .082 .5 1 .31 .65
E5 .12 .21 .13 .31 1 .6
E6 .2 .4 .6 .65 .6 1
Here we can see that the minimal similarity is .082 and which is between E4 and E2. So
our cluster center will be E2 and E4.
Step 2: These three steps are exactly same as explained before in section 2.5.2 in K-Mean
from step 2 to step 4.
The advantages of K-Means++ clustering algorithm over K-Means clustering algorithm is
that K-Means++ clustering is 10% more efficient then K-Means in term of cluster quality
(Arthur & Vassilvitskii, 2007) and K-Means++ clustering algorithm computational time
is much less than the K-Means clustering algorithm. The limitation of K-Means++
clustering algorithm is that it is still based on random selection of seed.
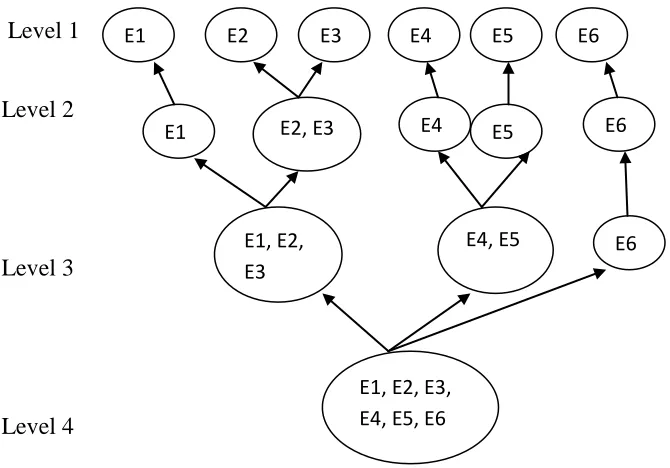
2.5.1.3 Hierarchical Clustering
This is a "bottom up" approach, each observation starts in its own cluster, and pairs of
clusters are merged as one moves up the hierarchy. For n given data sets, this procedure
37
1)/2 pairs and selecting a union having a maximal value for the objective function (ESS).
For example, suppose a set of six email messages {E1, E2, E3, E4, E5 and E6}:
Level 1
Level 2
Level 3
Level 4
Figure 2.4: Example for Hierarchical Clustering
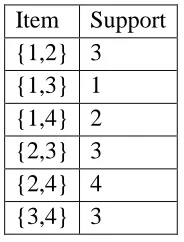
2.5.2 Frequent Pattern Mining, Association and Correlation
Frequent patterns (Han and Kamber, 2000) are itemsets, subsequences, or substructures
that appear in a data set with frequency no less than a user-specified threshold. For
example, a set of items, such as milk and bread that appear frequently together in a
transaction data set is a frequent itemset. A subsequence, such as buying first a PC, then a
digital camera, and then a memory card, if it occurs frequently in a shopping history
database, is a (frequent) sequential pattern. A substructure can refer to different structural
forms, such as subgraphs, subtrees, or sublattices, which may be combined with itemsets
or subsequences. If a substructure occurs frequently in a graph database, it is called a
(frequent) structural pattern. Finding frequent patterns plays an essential role in mining
associations, correlations, and many other interesting relationships among data.
E1 E2 E3 E4
E5
E6
E2, E3
E1 E4
E5
E6
E1, E2, E3
E4, E5 E6