University of South Carolina
Scholar Commons
Theses and Dissertations
5-2017
A Regression Analysis of South Carolina Algebra I
End-Of-Course Exam Scores by Schedule Type
Dawn M. Smith
University of South Carolina
Follow this and additional works at:https://scholarcommons.sc.edu/etd Part of theEducational Administration and Supervision Commons
This Open Access Dissertation is brought to you by Scholar Commons. It has been accepted for inclusion in Theses and Dissertations by an authorized administrator of Scholar Commons. For more information, please [email protected].
Recommended Citation
AREGRESSIONANALYSISOFSOUTHCAROLINAALGEBRAI END-OF-COURSEEXAMSCORESBYSCHEDULETYPE
by Dawn M. Smith Bachelor of Arts Lake Forest College, 1998
Master of Education The Citadel, 2004
Specialist in Educational Leadership The Citadel, 2009
Submitted in Partial Fulfillment of the Requirements For the Degree of Doctor of Philosophy in
Educational Administration College of Education University of South Carolina
2017 Accepted by:
Susan Bon, Major Professor Henry Tran, Committee Member Edward Cox, Committee Member Kent Murray, Committee Member
ii
iii
DEDICATION
iv
ACKNOWLEDGMENTS
I would like to acknowledge the contributions and support I have received throughout this journey. I am very fortunate to have so many wonderful people in my life supporting my efforts.
Thank-you, Laurie and Kailer for your love, support, and patience, especially on the days that this project seemed overwhelming and impossible. Your encouragement, laughter, and smiles keep me going every day.
Thank-you, Mr. Ric Racroft for your support and dedication to helping me finish this project. Thank-you, Dr. Charlene Zehner, Dr. James Spencer, and Mrs. Colleen Archambault for your tremendous help in the editing process.
To my dissertation committee members, Dr. Henry Tran, Dr. Edward Cox, and Dr. Kent Murray, thank you for your guidance, expertise, support, and especially your time.
v
ABSTRACT
The purpose of this study was to examine the relationship between scheduling and first-year-high-school students’ exam scores on the South Carolina Algebra I End-of-Course (EOC) assessment. The study compared existing empirical data from two
southeastern high schools from the same school district using 4 X 4 block schedules from 2011-2014 and modified block (A/B) schedules from the years 2014-2016. The study results included Algebra I EOC exam scores from the 3 years each school was on a 4 X 4 block schedule and for the 2 years each school employed a modified (A/B) block
vi
TABLE OF CONTENTS
DEDICATION ... iii
ACKNOWLEDGMENTS ... iv
ABSTRACT ...v
LIST OF TABLES ... ix
LIST OF FIGURES ... xi
LIST OF ABBREVIATIONS ... xii
CHAPTER 1 INTRODUCTION ...1
STATEMENTOFTHEPROBLEM ...1
APERSONALPERSPECTIVE ...2
CONCEPTUALFRAMEWORK ...3
HISTORICALBACKGROUND ...4
PURPOSEOFSTUDY ...15
RESEARCHQUESTION ...15
SIGNIFICANCEOFSTUDY ...16
RESEARCH DESIGN ...16
LIMITATIONS ...17
DEFINITIONSOFTERMS ...18
vii
CHAPTER2LITERATUREREVIEW ...23
LITERATURESEARCHPROCEDURES ...23
GRADUATIONRATE ...24
IMPORTANCEOFMATHEMATICSINGRADUATION ...28
ASSESSMENTS ...30
SCHEDULINGMODELS ...36
SUMMARY ...48
CHAPTER3METHODOLOGY ...50
RESEARCHQUESTION ...51
RESEARCHDESIGN ...51
PARTICIPANTS ...54
PROCEDURES...55
RELIABILITYANDVALIDITY ...57
LIMITATIONS ...58
SUMMARY ...59
CHAPTER4RESULTS ...61
MULTICOLINEARITY ...62
QUANTITATIVE FINDINGS ...63
DESCRIPTION OF POPULATION ...63
ANALYSIS OF RESEARCH QUESTION ...65
viii
SUMMARY ...83
CHAPTER5STUDYSUMMARY ...85
SUMMARYOFTHESTUDY ...85
FINDINGSRELATEDTOTHELITERATURE ...89
IMPLICATIONS ...89
RECOMMENDATIONSFORFURTHURRESEARCH ...90
CONCLUSIONS...92
REFERENCES ...96
APPENDIXAEIRBUSCAPPROVALLETTER ...104
APPENDIXBREQUESTFORPERMISSIONTOUSEDATA ...105
ix
LIST OF TABLES
Table 2.1 Student schedule on a seven-period traditional schedule ...38
Table 2.2 Student schedule on a 4 X 4 block schedule ...39
Table 2.3 Student schedule on a modified (A/B) block schedule ...41
Table 4.1 Pearson Correlation of relationship between 8th grade Mathematic PASS scores and SES ...62
Table 4.2 Exam scores by schedule type ...63
Table 4.3 Exam scores by gender ...64
Table 4.4 Exam scores by ethnicity ...65
Table 4.5 Exam scores by SES ...65
Table 4.6 SC Algebra I EOC mean scores by schedule ...66
Table 4.7 SC Algebra I EOC mean scores by schedule and gender ...68
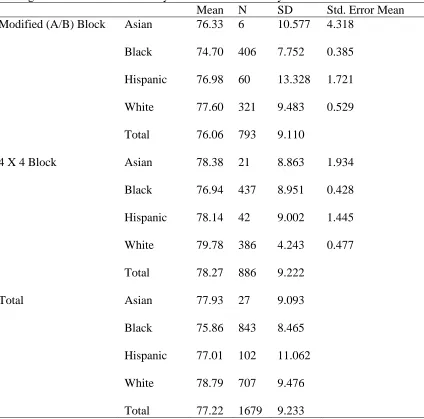
Table 4.8 SC Algebra I EOC mean scores by schedule and ethnicity ...70
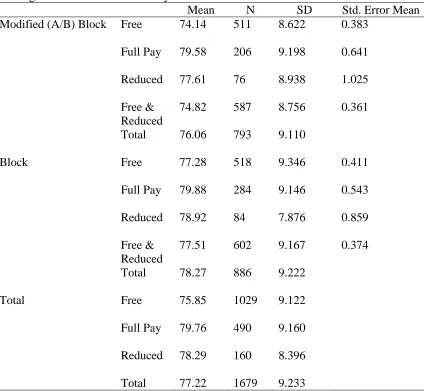
Table 4.9 SC Algebra I EOC mean scores by schedule and SES ...72
Table 4.10 Model 1 summary ...76
Table 4.11 Model 1 Coefficients...78
Table 4.12 Estimated marginal means for schedule ...78
Table 4.13 Estimated marginal means for gender...79
Table 4.14 Estimated marginal means for ethnicity ...79
Table 4.15 Estimated marginal means for SES...79
x
xi
LIST OF FIGURES
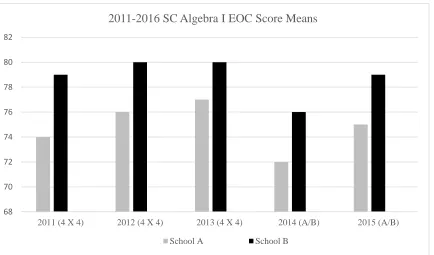
Figure 4.1 SC Algebra I EOC score means by year and schedule type ...66
Figure 4.2 SC Algebra I EOC score means by gender and schedule type ...68
Figure 4.3 SC Algebra I EOC score means by ethnicity and schedule type ...71
Figure 4.4 SC Algebra I EOC score means by year and schedule type ...73
Figure 4.5 Exam scores for 4 X 4 and modified (A/B) block schedules ...74
Figure 4.6 Exam scores for 4 X 4 and modified (A/B) block schedules ...75
Figure 4.7 Algebra I EOC exam scores ...82
xii
LIST OF ABBREVIATIONS
1
CHAPTER
1
INTRODUCTION
Statement of the Problem
American schools and school leaders have the responsibility of educating all children and ensuring that no children are left behind. The fifty-year-old Elementary and Secondary Education Act (ESEA) of 1965 mandates that all students meet high
standards. The level of school leader accountability for student success has increased with every reauthorization of ESEA for the past six decades. Dr. Joseph M Carroll, retired superintendent and scholar, started a reform movement to restructure secondary school schedules in 1989 to increase student achievement and meet the high level of accountability brought forth by the reauthorizations of ESEA. This movement was also sparked by the publication of A Nation at Risk: The Imperative for Educational Reform
(1983). The publication exposed underperforming high schools and the lack of
2
Algebra I became the focus for school leaders and administrators throughout the nation. According to Bitter and Oday (2010), students were expected not only to meet high standards but also to complete and excel in rigorous mathematic courses in order to graduate from high school. This study will examine the mathematic achievement, measured by exam scores, of first-year high school students on the South Carolina Algebra I End-of-Course (EOC) assessment in schools which use 4 X 4 block and
modified block (A/B) schedules. This study will also examine the descriptive statistics of student Algebra I exam scores including gender, ethnicity, and socioeconomic status (SES).
A Personal Perspective
I have been interested in school leadership since I entered the classroom as a teacher in 1998. I have always been curious as to why school leaders make decisions and what data can help leaders make better-educated decisions about scheduling. Even though I received a B.S. in Politics and Education, with a minor in History, understanding the importance of student success in critical courses, such as Algebra I, has become a passion of mine.
3
multidisciplinary empirical studies. Most of the literature examines the productivity relationship between schooling inputs and test score outcomes for school-aged children (Todd, P. & Wolpin, K, 2003).
The conceptual frame or lens of this study is guided by EPF paradigm. This type of lens incorporates a variety of inputs from students, parents, teachers, schools, and many other sources which are associated with student achievement and attempts to explain the relationship between the inputs and outputs. While EPF is not new to the economists’ world, it has become more prevalent in education studies due to the heightened sense of accountability and drive to educate all children.
Conceptual Framework
Researchers and policymakers have been interested in the causal effects of educational inputs on student achievement for decades. The most cited study examining education production functions if the Equality of Educational OpportunityReport
(EEOR) that followed over 600,000 K-12 students in more than 3,000 schools (Coleman, 1966). Congress in the Civil Rights Act of 1964 commissioned the Report, more
commonly known as the Coleman Report. The goal of the study was to research the lack of availability of equal opportunities for minority children in the United States.
4
about the family’s influence on children’s school performance. Gamoran et al. (2006) concluded that the EEOR “inspired decades of research on school effects, on the impact of socioeconomic status (SES) on achievement, and on racial and ethnic disparities in academic achievement.”
EPF’s are used to study the relationship between student and school inputs and a measure of school output. School inputs, referred to as predictors, include but are not limited to class size, teacher experience, teacher education, and teacher pedagogy.
Student inputs include but are not limited to predictors such as attendance, discipline, and socioeconomic status (SES). The most common student output is student achievement; often measured by standardized test scores. The aformentioned inputs and outputs are only a few of the many included in EPF literature and studies. The studies have led to mixed findings due to the use of widely diverse models. Many of the models incorporate per pupil expenditure (PPE) as well as indicators such as teacher experience, teacher education, teacher-pupil ratio, administrative inputs, and facilities to predict achievement Hanushek, 1996); however, these inputs are outside the scope and the conceptual
framework of this particular study. This study will examine the relationship between schedule type (input) and SC Algebra I EOC exam scores (output). Student
demographics will also be used to examine the relationship between 4 X 4 block and modified block scheduling and SC algebra I EOC exam scores.
Historical Background
5
predictors of high school graduation. The CRP revealed that 70% of students who fail Algebra I in the ninth grade drop out of high school compared to 30% who pass the course in their ninth grade year and graduate on time (Silver, Saunders, & Zarate, 2008). This study will examine mathematic achievement of first-year high school students measured by exam scores on the South Carolina Algebra I End-of-Course (EOC) assessment in schools which use 4 X 4 block and modified (A/B) block schedules. This study will also report the descriptive statistics of student Algebra I exam scores including gender, ethnicity, and SES .
The South Carolina Algebra I EOC exam and similar high stakes assessments are part of the school reform movement, which focuses on collecting and analyzing student data to drive decision making in education. On April 9, 1965, Congress enacted the ESEA; this legislation is arguably the most expansive federal education bill passed in the 20th century. As cited in Jorgensen and Hoffman (2003), President Lyndon B. Johnson introduced the bill to Congress three months prior to its enactment as part of his “War on Poverty” which aimed to reduce achievement gaps between students by offering fair and equal opportunities to students in low-achieving schools. These low-achieving schools received federal funding for staff development, bi-lingual education, technology, and special innovative programs to improve the education of disadvantaged students.
6
Jorgensen and Hoffman (2003) asserted this report gained attention from the Reagan administration as its findings threatened the United States’ position as a dominant force in the global economy. Several policies and mandates resulted due to the findings of this published report.
First, Goals 2000: Educate America Act was signed into law on March 31, 1994. The Clinton administration passed this law with the intent of establishing a framework in which to identify high performance standards, measure student progress, and provide a support system including staff development for teachers to help students meet the standards. Shepard, Hannaway, and Baker (2009) argued that this legislation supported education reform to increase student achievement and implement standards-based curricula; however, state that there was a lack of accountability developed to support the act. Goals 2000 sparked the movement to implement standards-based curricula and increased the need for test-based accountability.
7
Later, President George W. Bush linked school funding to the attainment of essential skills and knowledge using state grade-level standards and benchmarks and required all schools to monitor the progress of all students (Jorgensen & Hoffman, 2003). Despite the attempts of NCLB to create uniform academic standards, Shepard et al. (2009) state that there is still extreme variability in some states and school districts with respect to rigor and development of challenging content standards. With individual states setting the standards, many students do not achieve proficiency on nationally approved tests such as the National Assessment of Educational Progress (NAEP). In an effort to help all students meet proficiency on NAEP, Jorgensen & Hoffman (2003) state the Clinton administration sought recommendations from the National Council on Education Standards and Testing, the Goals Panel, and the experience of states with systemic reforms already in place to identify high performance standards, measure student progress, and develop a support system to help students meet the standards.
In December 2015, President Obama signed the Every Student Succeeds Act (ESSA). This measure once again reauthorized the 50-year old ESEA, which reaffirmed the government’s commitment to equal opportunity for all children. President Obama asserted:
8
In 1998 the South Carolina legislature passed the South Carolina Education Accountability Act (SCEAA) and was well on the way to developing a method to monitor the adequate yearly progress of schools and students. South Carolina was premature in developing a program that would later be required by NCLB. South Carolina’s SCEAA led to the development of the South Carolina End-of-Course-Examination Program (SC EOCEP), which required the development of end-of-course (EOC) tests in benchmark courses such as Algebra I, English I, Biology, US History and the Constitution. According to the South Carolina Department of Education (2015), the EOCEP “encourages instruction in the specific academic standards for the courses, encourages student achievement, and the documents the students’ mastery of the academic standards.” South Carolina contracted with Data Recognition Corporation (DRC) to develop the tests. According to the SCEAA mandates, tests for these
benchmark courses are required at the culmination of a course and count a mandated 20% of a student’s overall grade. The SCEAA legislation passed in 1998 was critical in South Carolina because it affirmed that curriculum development, implementation, and
accountability were instrumental in the process of monitoring and evaluating student achievement.
9
legislation was not enough to ensure the success of all students. In order to increase the graduation rate and ensure that no children were left behind, educators needed to study the factors that led to low student achievement as well as the factors which led a student to drop out of school. He argued that the decision to stay in or leave school is affected by “multiple contextual factors—family, school, neighborhood, and peers.” These factors act in an aggregate way throughout the lifetime of a student. Thus, it is very difficult to pinpoint one cause for the nation’s dropout crisis. In 2004 the Consortium on Chicago Schools Research (CCSR) presented that the most overlooked factor in the quest to identify causes for the dropout rate is students’ performance in their courses. The
Consortium purported that inadequate credit accumulation in a student’s freshman year is highly predictive of that student failing to graduate four years later. Students can earn six to eight Carnegie Units their first year of high school. The Carnegie Unit is based on the amount of time a student has direct contact with an instructor (Silva, White, & Toch, 2015). Students who earn fewer than five Carnegie Units in the ninth grade are at risk for not completing four years of high school successfully (Rumberger, 2008).
10
growing concern of educators and policymakers since the understanding of its content is fundamental to success in future math and science courses (Neild & Balfanz, 2006; Vigdor, 2013).
Silver et al. (2008) highlighted that the superintendent of LA Unified School District (second largest unified school district in the nation), asserted that failure in Algebra I is the number one trigger of dropouts in high school. Governor Arnold
Schwarzenegger and many other influential policymakers have dubbed math, specifically Algebra I, as the “gateway” to college and higher paying careers. To prove this notion, the California Research Dropout Project (CRDP) funded a study that tracked the education performance of over forty-eight thousand students entering 9th grade for the first time in the Los Angeles Unified School District. This 7-year longitudinal study examined a variety of factors to predict on-time graduation rates. Statistical analysis revealed that demographics explained only 4% of the student level variability in drop-out rates whereas student academic experiences and school characteristics explained more of the variability. Most notably, the study found that controlling for all other variables, students who passed Algebra 1 by the end of their freshman year increased the likelihood of graduating on-time by more than 75% (Silver et al., 2008).
The CDRP and programs such as the Algebra Project have proven Algebra I to be a critical course in predicting the success of high school students as well as on-time graduation rates (Neild & Balfanz, 2006; Vigdor, 2013). One of the major decisions district leaders and board members face is the type of scheduling to best deliver Algebra I and other critical courses. During the 1990’s reorganizing the school day and
11
block scheduling to improve the learning culture of high schools and increase student achievement (Zepeda & Mayers, 2006). A number of researchers, educators and policymakers asserted that the academic success of high school students lay in the structure of the school schedule. Goodlad (1984) stated that the school “time is virtually the most important resource for educators” (p. 30). Since the 1990’s block, scheduling has been recognized as a challenge to the “time-honored intellectual bonds” of the traditional school day and the Carnegie unit plan, which has been followed for decades (Murphy, Beck, Crawford, Hodges, & McGaughy, 2001). Block schedule classes meet every day for 66-90 minutes for approximately ninety days. The modified block (A/B schedule) classes meet every day for 40-50 minutes or 2 to 3 times a week for ninety minutes a day for approximately 180 days.
Dr. Joseph M. Carroll (1990) was a proponent of high school restructuring. In 1989 he published The Copernican Plan-Restructuring the American High School and made revolutionary and controversial claims throughout his publication. Carroll claimed that restructuring the school day could lead to dramatic changes for students, teachers, and high schools:
Virtually every high school in the U.S. can reduce its average class size by 20%; increase the number of courses or sections it offers by 20%; reduce the total number of students with whom a teacher works each day by 60% to 80%; provide students with regularly scheduled seminars dealing with complex issues; establish a flexible, productive instructional environment that fosters effective mastery learning, as well as other practices
12
information beyond what they learn in seminars within present levels of funding (358-359).
Carroll believed student achievement could be improved by restructuring the school day so that students attended longer classes, which met for only part of the school year. He also believed that this schedule change would create a classroom environment fostering improved relationships between students and teachers and provide much more
manageable workloads for both teachers and students (Carroll, 1994). Dubbed “The Copernican Plan”, this proposal for change in the century-old structure of American schools brought about challenge and backlash from the educational community.
In 1994 Harvard University conducted an evaluation of schools which had switched to a Copernican-style schedule and found that students had better relationships with their teachers, did more writing, discussed and evaluated more in-depth issues and concepts, felt more challenged, and gained a deeper understanding of the content. The study revealed that teachers were more excited about teaching, felt rejuvenated, and believed they were teaching more effectivelythan ever (Carroll, 1994).
Block scheduling has been used in Canada since the 1970’s and has become very popular in the United States since legislators have demanded reform in public education. Kramer (1996) indicated that lecture alone for ninety minutes is ineffective, but more hands-on and student-based learning activities increase student performance and
retention. Kramer surveyed teachers on the block schedule who indicated this schedule provided an opportunity to teach more in-depth concepts to their students.
13
scores (Evans, Tokarczyk, Rice, & McCray, 2002), decreasing discipline issues,
encouraging teachers to use a variety of pedagogical strategies (Canady & Rettig, 1995 & Evans et al, 2002) and improving academic achievement (Evans et al., 2002 & Zepeda & Mayers, 2006).
A critic of the Copernican Plan and block scheduling, Howard (1997) argued that the block schedule actually provided less class time and found that the claims of reduced dropouts and absenteeism may be the result of poor record keeping. Gruber &
Onwuegbuzi (2001) questioned the usefulness of block scheduling and encouraged educators to return to the more traditional Carnegie Plan. Despite evidence documenting the benefits of block scheduling, these opposing views reveal that the issue is unsettled and additional research is needed to address the criticism.
Most high schools in South Carolina use one of three different schedules: (a) traditional (7-8 periods per day that meet for 45-55 minutes), (b) 4 X 4 block (4 classes per day that meet for 85-90 minutes), and (c) modified (A/B) block (7-8 classes that meet on alternating days for 85-90 minutes). There have been several studies conducted to analyze all three scheduling options and the relationship each scheduling type has with student achievement and high school graduation; however, very few look at the
14
The South Carolina Department of Education (SCDE) defines traditional schedules as schedules that consist of 6 to 8 classes per day with classes typically
meeting for 45-50 minutes per day every day. Next, they define block scheduling as one three different types: 4 X 4, modified block (A/B), and hybrid block. The 4 X 4 block schedule divides the school day into four ninety-minute classes for one semester or ninety days. Students are then enrolled in four different courses during the second semester. The total amount of seat time with this schedule totals 135 hours. The modified block schedule, also known as the alternating day schedule; students attend 90-120 minute classes completing six to eight classes in the school year. The students attend three to four classes on A day and then three to four classes on B day. The modified (A/B) block schedule combines the block and traditional schedule. Students take 90 semester courses with 45 minute, yearlong courses. Again, the students have 135 minutes of academic instruction with this schedule. Lastly, they define the hybrid block as a combination of the two aforementioned blocks.
15
Purpose of the Study
The purpose of this quantitative study is to examine the relationship between schedule type and South Carolina Algebra I EOC exam of first-year high school students taking Algebra I on 4 X 4 block schedule and modified (A/B) block schedules. The two schools utilized a 4 X 4 block schedule from 2011-2014 and switched to a modified (A/B) block schedule from 2014-2016. The study results included Algebra I EOC exam scores from the 3 years each school was on a 4 X 4 block schedule and for the 2 years each school employed a modified (A/B) block schedule. This study will also report and analyze mathematicachievement, measured by exam scores, on the Algebra I EOC exam of first-year high school students enrolled in Algebra I on 4 X 4 block schedules and modified (A/B) block schedules with consideration of ethnicity, gender and SES.
Research Question
The following questions guided this study on making scheduling decisions for Algebra I classes for students in their first year of high school:
1. Is there a significant relationship between South Carolina Algebra I EOC exam scores and schedule type, examining a 4 X 4 block and modified (A/B) block schedule?
16
Significance of Study
This study design will provide school administrators and board members with quantitative data about the effects of scheduling on the SC Algebra I End of Course exam. The data will be useful when deciding to implement a school schedule that maximizes student achievement for all students in Algebra I classes. The understanding of Algebra I content is fundamental to success in future math and science courses. Since Algebra I is considered a “gateway” course to high school graduation, school leaders can use this data to make decisions about scheduling that will increase on-time graduation.
Research Design
17
were defined as students receiving free or reduced lunch. Exam scores from the South Carolina Algebra I EOC exams and student demographic data were gathered for 2011-2016.
Student grades and South Carolina Algebra I EOC exam scores were collected from the school district’s database: Berkeley’s Resource and Information Network (BRAIN). Once the data was collected and sorted, descriptive statistics were used to provide information about the sample size, means, and standard deviations. A regression analysis was used determine if there was a significant relationship between South
Carolina Algebra I EOC exam scores and students enrolled in 4 X 4 block or modified (A/B) block schedules. Descriptive statistics were reported to provide data from 2011-2016 regarding gender, ethnicity, and SES.
Limitations
18
consideration of teacher practices, pedagogy, skills, and classroom experiences. The data were limited to a first-year high school population. All students who had taken Algebra I more than once were eliminated from the data set. In addition, the use of one high stakes test, the South Carolina Algebra I EOC, was used to measure participant exam scores in Algebra I. Finally, this study used a pre-post design and no control group.
Consequently, one of the major issues associated with that is selection bias, which suggests there may be something unique about the schools that decided to change their scheduling in comparison to the schools that did not change their scheduling.
Definition of terms
Achievement gap. The achievement gap is the difference in the performance between each subgroup within a participating school and the statewide average performance of the state's highest achieving subgroups in reading/language arts and mathematics as measured by the assessments required under the Elementary and Secondary Education Act (Department of Education, 2015).
Assessment. An assessment is used to determine what a student has learned in the curriculum. (Carter, 2007, p. 34)
Block schedule (4 X 4). A block schedule class is defined as any extended period class (66-90 minutes). (SCDE, 2015)
19
Children in Poverty (CIP). Children living in poverty are those who experience deprivation of the material, spiritual and emotional resources needed to survive, develop and thrive, leaving them unable to enjoy their rights, achieve their full potential or participate as full and equal members of society (Vandermoortele, 2000). In this study, children who receive free and reduced lunch will be referred to as children in poverty.
Copernican Plan. The Copernican Plan is a variation of block scheduling that is believed to increase retention, decrease teacher workload, and provide an environment more conducive to learning, without adding to school budgets. (Carroll, 1994)
Curriculum. Curriculum refers to the content, standards, and/or objectives for which students are held accountable. (Posner, 2004, p. 5)
Graduation rate. Graduation rate is the four-year or extended-year adjusted cohort graduation rate. (Department of Education, 2015)
High stakes test. A high stakes test is used to make important decisions about students, educators, schools, or districts, most commonly for the purpose of
accountability. (SCDE, 2015)
Modified (A/B) block schedule. A modified (A/B) block schedule class is defined as any extended period class that meets every other day or two to three times per week (eighty-five to ninety minutes). (SCDE, 2015)
PASS. Palmetto Assessment of State Standards, a norm-referenced exam given in grades 3-8 in South Carolina. (SCDE, 2015)
Pearson Correlation. In statistics, the Pearson product-moment correlation
20
value between +1 and −1 inclusive, where 1 is total positive correlation, 0 is no
correlation, and −1 is negative correlation.
Proficiency. Proficiency is attained through advancement in knowledge or skill. (SCDE, 2015)
Socioeconomic Status. An individual’s or group’s position within a hierarchical
structure. Socioeconomic status depends on a combination of variables, including occupation, education, income, wealth, and place of residence. Sociologists often use scocieconomic status as a means of predicting behavior. (The American Heritage New Dictionary of Cultural Literacy, 2005)
South Carolina EOC Exam. The SC EOC Exam is an academic assessment administered in benchmark courses; it counts 20% of a student’s final grade in South Carolina. (SCDE, 2015)
Standards. Standards describe what the students should be able to do and describe the processes used to meet the learning goals. (Posner, 2004, p. 6)
Student performance data. Student performance data provides information about the academic progress of a single student, such as formative and summative assessment data, coursework, instructor observations and information about student engagement and time on task. (Department of Education, 2015)
Summary
21
assessment. Many studies have examined the reasons students do not finish high school in four years, but a student’s course performance in the critical or benchmark courses during the first year of high school proves to be extremely important (Neild & Balfanz, 2006; Vigdor, 2013). Student performance in Algebra I, the gateway course to
graduation, provides keen insight into a student’s success in high school.
Educators have searched for varied methods to teach Algebra I curriculum and the curriculum of other critical courses in order to increase student achievement. Alternative scheduling formats have been used to provide students with a variety of instructional methods. Canady and Rettig (1995) reason that the challenges of providing quality time, creating a positive school climate, and providing varying learning time can be addressed with alternative scheduling. This study is designed to analyzemathematicachievement, measured by exam score, on the South Carolina Algebra I EOC assessment of first-year high school students enrolled in Algebra I on 4 X 4 block and modified (A/B) block schedules. In addition, this study will analyzemathematic achievement, measured by exam score, on the South Carolina Algebra I EOC assessment of first-year high school students enrolled in Algebra I in relation to ethnicity, gender and SES. A more precise understanding of the relationship between scheduling and student performance in Algebra I will provide critical insight to educators who seek to improve high school completion rates. In addition, administration can use this new understanding to develop schedules for courses that are more likely to lead to improved student achievement.
22
23
CHAPTER 2
LITERATURE REVIEW
A review of literature was conducted to gather current and relevant research for this study. First, literature on graduation rates, dropout rates, mathematics, standardized testing, and the relationship between scheduling and student assessment performance in secondary schools was gathered. Then, literature on block and modified (A/B) block scheduling was collected. Extensive literature exists on traditional and block scheduling; however, very limited literature on A/B block scheduling is available. There are
significant gaps in the literature with regard to the relationship between standardized testing and 4 X 4 block and modified (A/B) block scheduling.
Literature Search Procedures
A key word search was conducted using the following descriptors: block scheduling, A/B scheduling, modified block scheduling, student achievement on block scheduling, alternative scheduling in high school, graduation rates and standardized testing, South Carolina Algebra I EOC scores and scheduling, innovative scheduling and exam scores, and mathematics and scheduling. Multiple searches were conducted online using ERIC and ProQuest databases. Approximately 105 peer-reviewed articles,
24
the key literature and themes emerging from the selection of articles, documents, and studies. The first section will highlight the focus of this study, improving graduation rates. The subsequent sections will dissect mathematic’s centrality to graduation and the relationship between scheduling and instruction, assessment, and student achievement in Algebra I.
Graduation Rate
Historically, as cited by Shortt and Fitzsimmons in 2007, researchers surmised that the school dropout risk was associated with possible mental inferiority. Scholars have continued to search for empirical evidence to explain the reasons students drop out of high school. NCLB (2002) renewed the quest to improve graduation rates and reduce dropout rates through a focus on school accountability and an increase in the federal government’s role in guaranteeing the quality of public education for all children, especially those in poor school districts and of low socio-economic backgrounds (Shepard et al., 2009).
25
26
come from low socioeconomic backgrounds (Allensworth & Easton, 2005; Balfanz et al., 2015; Shepard et al., 2009).
Balfanz et al. (2015) examined subgroup performance in a comprehensive report titled “Building a Grad Nation.” Their analysis revealed significant disparities among minority students, students with disabilities, and students from low socioeconomic families. They concluded that these subgroups of students drop out of high school because they face barriers to their academic success. The barriers included “discipline disparities that often pushed them off track, language barriers, and a lack of access to rigorous coursework that enabled them to be successful” (p. 11).
This report also identified the barriers that negatively influence students who are considered economically disadvantaged. According to Balfanz et al. (2015), it is
especially important to address the graduation rate disparity for low income students because 51% of the nation’s public school students were eligible for free and reduced lunch in 2013. Students who qualify for free and reduced-price lunches are considered to be low income if their household income is no greater than 130% of the federal poverty guidelines. A gap in opportunities for this subgroup exits since most of these students do not have access to early medical care, education, or physical and mental health services. These detriments influence children’s ability to learn and negatively affect their success in high school.
27
poverty (Vandemoortele, 2000). For the purposes of this study, children who receive free and reduced lunch will be referred to as children in poverty (CIP).
Balfanz et al. (2015) indicated that ACGR improvement among states and large districts varied between 2011 and 2013. In 2013 the national high school ACGR reached a record high of 81.4 percent (p. 5). While the overall improvement in the national average graduation rate was celebrated, an in-depth look into the disaggregated data exposed that school districts with a majority of low-income and minority students made big improvements, while others lost ground. The school districts which improved graduation rates significantly had implemented a wide variety of innovative reforms. According to Balfanz et al., graduation rates can be improved by “good leadership, innovative reforms, as well as multi-sector efforts of the state, district, and school levels” (p. 6). Furthermore, the researchers concluded that, based on the U.S. Department of Education reported data, graduation rates can be increased for all students in every part of the country.
In 2007 research conducted by the Chicago Consortium on School Research in 2007 concluded that student performance in the first year of high school is a good predictor of whether or not a student will graduate on time. The CCSR research study revealed that inadequate credit accumulation in the first year of high school due to course failure was found to be highly predictive of failure to graduate four years later. Similar research in New York City has shown a connection between inadequate credit
28
course credits (National Center for Education Statistics, 2007). Balfanz et al. (2015) completed similar research in 2015.
According to the Consortium on Chicago School Research (2007), educators “cannot hope to substantially increase or improve graduation rates unless educators substantially improve students’ course performance in their freshman year” (p. 4). Research indicates that students who receive good grades in the ninth grade are put on a trajectory towards high school and college success (Allensworth & Easton, 2007; Roderick, Nagaoka, Coca, & Moeller, 2008). Furthermore, in both of these studies Algebra I was identified as a particularly important “gateway” course.
In response to the NCLB Act, many schools began to focus on improving
graduation rates and decreasing dropout rates (Allensworth & Easton, 2005). The school systems were able to use the ACGR to monitor and report the successes and failures in this quest. By relying on the disaggregated ACGR data, educators have improved insight into the courses which students failed more frequently than other courses. Algebra I was identified as an essential course for high school matriculation (Allensworth & Easton, 2007; Roderick, Nagaoka, Coca, & Moeller, 2008). The next section will present an in-depth review of mathematic’s centrality to graduation.
Importance of Mathematics in Graduation
29
mathematics, leads to high school graduation and success in college (Allensworth & Easton, 2007; Roderick et al., 2008; Alexander & Pallas, 1984; National Mathematics Advisory Panel, 2008).
In Everybody Counts: A Report to the Nation on the Future of Mathematics Education, the National Research Council stated that “current mathematical achievement of United States students is nowhere near what is required to sustain our nation’s
leadership in a global technological society, and to participate fully in the world of the future, America must tap the power of mathematics” (1989, p. 1). This report sparked an increasing concern with mathematics education which would last for the next three decades.
Algebra I is often called a gateway course since the understanding of its content is fundamental to success in future math and science courses. The “techniques and ideas in Algebra I pave the way to logical thinking” (Liskey, 2011, p. 1), which is essential for graduation from high school, democratic citizenship, access to important careers, and everyday life. In recent years, pressure has mounted for students to complete this gateway course earlier and earlier in their school careers. The California Collaborative on District Reform (CCDR), as cited in Bitter et al. (2010), mandates that “most districts require Algebra I in the ninth grade, some do so in the eighth grade and some offer it as early as seventh grade; however, most districts reveal large discrepancies among student groups in both their enrollment in and their successful completion of Algebra I (p. 1).
30
enhancement of current instructional capacity in mathematics, and provision of additional supports for struggling students” (Bitter et al., 2010, p. 1). Along with these key areas of attention comes the question of how to assess student achievement and mastery of the Algebra I curriculum. Since the passing of the federal legislation NCLB, many states have followed the trend toward assessing student progress with EOC exams (French, 2003; Center on Education Policy, 2009).
Assessments
High stakes testing is one of the most controversial subjects in education today. A high stakes test is any test used to make important decisions about students, educators, schools, or districts, and is most commonly used for the purpose of accountability. To hold schools accountable improvement, schools and districts have to report test results for a variety of student groups. These subgroups include, but are not limited to minority students, students from low-income households, students with special needs, and students with limited proficiency in English. The test results are published and used to rate
schools across the nation and in individual states. Failing to meet a state’s requirement for improvement may result in sanctions and a reduction in funding (Blazer, 2012).
WestEd released a policy brief in 2000 that highlighted the benefits and drawbacks to stakes testing. Ananda and Rabinowitz (2000) indicated that high-stakes tests are the result of a widespread public demand for accountability of schools. The benefits listed by the authors include:
1. High-stakes tests can establish challenging performance expectations for students, teachers, and schools.
31
3. High stakes tests can boost student performance by encouraging students to be more serious in school.
The drawbacks to high-stakes testing include:
1. High-stakes tests can increase student retention and failure rates to unacceptably high levels.
2. High-stakes tests can narrow the focus of instruction and assessment. 3. High-stakes tests can lead to inappropriate inferences about student
performance.
4. High-stakes tests can increase stress levels of teachers and students. Anada et al. argued that policymakers “must not lose sight that the ultimate goal of a comprehensive accountability system is not to reward or punish, but to improve the delivery of curricula and to increase student learning” (p.3).
The increased focus on accountability has prompted the widespread use of high-stakes tests throughout states in America. Critics argue that the number of tests and frequency must be limited or states will “risk creating a system that seriously
overburdens teachers and students, taxing precious instructional time and resources” Anada et al., 2002, p. 3). Assessments and evaluations of student performance are important to identify areas of needed improvement. The debate of high-stakes testing will continue as long as states continue to use these tests to hold schools accountable for student progress. Two high-stakes tests used in the state of South Carolina are End-Of-Course (EOC) assessments and the Palmetto Assessment of State Standards (PASS).
32
Met, Exemplary 4, and Exemplary 5. The SC Mathematics PASS assessment was utilized in this study as an indicator of prior student achievement. Student test scores are strongly correlated with SES, so the researcher did not use PASS scores as a variable in this study. Creswell (2012) indicated that researchers must check and address
multicolinearity before conducting a regression analysis or the model-fitting process will provide answers that are inconsistent and often not repeatable in subsequent studies.
End-Of-Course Assessment. Blazer (2012) indicated that NCLB has moved the United States into an unprecedented era of high-stakes testing. End-of-Course (EOC) testing is one of several methods adopted to provide subgroup performance data. End-of-course assessments have gained popularity in recent years and are similar to final examinations but are typically standardized statewide tests. In 2002 at least twenty-two states administered EOC exams, and the Education Commission of the States predicted that the number of states administering these tests would increase to twenty-six by the year 2012 (Zinth, 2012).
The number of EOC exams administered in the twenty-two states ranges from one in New Jersey to sixteen in California (Blazer, 2012). Seven states require that scores on EOC exams be used to calculate a student’s final test grade with the percentage of a student’s EOC score ranging from 15% to 30% in varying states. The Center on Education Policy reported that eight states require students to pass one or more EOC assessments in order to graduate from high school. The Center on Education Policy expects this number will increase to fifteen states by 2020 (Zinth, 2012).
33
learning. While standardized tests have their limitations in providing an in-depth look at a student’s progress, they do provide a form of tracking student progress. The National Center for Research on Evaluations, Standards, and Student Testing’s research on the effects of a year-long focus on classroom performance assessment found small academic gains, including gains in “opportunities to develop their mathematical understandings that had not occurred previously without the assessments” (as cited in Shepard, 1995, p. 14). A study of the Chicago Annenberg Research Project found that when teachers used high quality assessments containing higher-order thinking skills, in-depth understanding, and elaborated communication connections to students’ lives beyond school, students produced higher quality work and achieved greater-than-average gains on low-stakes standardized tests in reading, mathematics, and writing (Newman & Nagoaka, 2001).
Rothstein (2000), however, questioned the validity of assessing a student’s knowledge at one point in time. As cited in Rothstein in 2000, Kamin (1974) and Sacks (1999) demonstrated how a student fares on a standardized test can be greatly influenced by a host of external factors including stress, lack of sleep, distractions during the test, emotional state and test anxiety. These factors affect mostly low-income students and minorities. Sacks (1999) examined elementary-aged students in testing situations and observed students to be anxious, angry, bored, pessimistic, and withdrawn from the testing process. He found older students to be disillusioned and hostile towards the high-stakes tests:
34
schools, and bleed school children of their natural love of learning (pp. 256-257).
Sacks also concluded that high-stakes tests decrease student motivation and lead to lower student retention and higher dropout rates.
Petrilli and Wright (2016) also cited that financial stress in low-income families can create “toxic conditions in the home and also make it difficult for parents to afford tutoring, educational games, summer camps, after-school activities, and other educational experiences that middle and upper-middle-class students experience” (p. 47). While money is not the only factor contributing to low exam scores for students in poverty, there are other social misfortunes associated with poverty. For example, children in poverty are more likely to come from single-parent families headed by poorly educated mothers. Poverty is also associated with higher rates of alcoholism, drug abuse, and neglect. All of these “risk factors” are associated with lower exam scores and a greater likelihood of dropping out of school (Jorgensen & Hoffman, 2003).
While proponents of high-stakes tests declare their approach has led to significant gains in student achievement and even narrowed the achievement gaps based on ethnicity and income, McNeil (2000) and Orfield and Wald (2000) have indicated the opposite. They presented evidence that low-income, Black, and Latino students are negatively affected by the consequences of high-stakes tests. Regardless of the debate, thousands of students in South Carolina must take and pass the South Carolina Algebra I EOC as well as other South Carolina EOC’s to graduate from high school (SCDE, 2015).
35
monitor the adequate yearly progress of schools and students. South Carolina’s Education Accountability Act (SCEAA) created the South Carolina End-of-Course-Examination Program (SC EOCEP), which required the development of end-of-course tests in benchmark courses such as Algebra I, English I, Biology, US History and the Constitution. These “gateway” courses are identified by the State Board of Education and the math, science, and English/language arts EOC exams are administered to all public school students by the third year of high school. These tests are summative and South Carolina contracted with Data Recognition Corporation (DRC) to develop the tests. According to the SCEAA mandates, tests for these benchmark courses are required at the culmination of a course and count a mandated 20% of a student’s overall grade. The SCEAA legislation was critical in South Carolina because it affirmed that curriculum development, implementation, and accountability were instrumental in the process of monitoring and evaluating student achievement (SCEAA, 1998). EOC exams are not the only type of high stakes testing used in South Carolina. The Palmetto Assessment of Sate Standards is used to monitor students’ mastery of state standards in grades 3-8.
36
Advisory Panel, 2008). The question remains, however- which schedule type maximizes student learning and mastery in mathematics?
Scheduling Models
Even though it has been more than three decades since the 1983 publication of A Nation at Risk, improving achievement levels of American students remains at the top of state and national policy-making agendas. Academic achievement is still linked to the state of the U.S. economy and competitiveness in world trade markets. Even scholars who disagree with the notion that American students are not competitive internationally admit that students from low socioeconomic backgrounds perform poorly (Orfield & Wald, 2000). Most secondary schools have engaged in efforts to improve. Many of these efforts are focused around the restructuring of the daily schedule to maximize student achievement.
37
the mission and vision of a school, student scores were better (Marzano, 2003; Marzano, Waters, & McNulty, 2005). Although Dufor and Eaker (1998) do not relate their
discussion of school improvement and student success directly to block scheduling, they do suggest the most successful schools are more likely to try innovative and
non-traditional arrangements of the day and time.
Currently there are many types of schedules being used in schools throughout the nation. Research divides the various schedules into four primary categories: traditional six, seven, or eight period schedules; block schedule; modified block schedule; or
trimester schedule (Trenta & Newman, 2002). Although many models are used, the most consistently and widely used schedules with consistency include the traditional, 4 X 4 block, and modified block schedules.
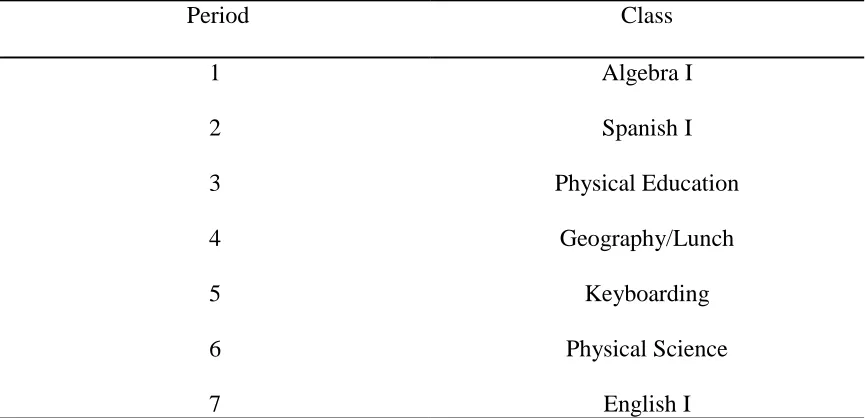
38 Table 2.1
Student schedule on a seven-period traditional schedule
Period Class
1 Algebra I
2 Spanish I
3 Physical Education 4 Geography/Lunch
5 Keyboarding
6 Physical Science
7 English I
Note. Seven-Period Traditional Schedule (55 minutes per day-180 days).
A traditional schedule meets six, seven, or eight times a day with each
period/class lasting from forty-give to fifty minutes.. Teachers typically educate 120-150 students per school year on this model. Seat time under the traditional schedule is
approximately 10,000 minutes of student-teacher instructional time. Students generally take four to five academic classes and two to three non-academic classes depending on the state requirements and local school district procedures (see Table 2.1).
39
instructional strategies and the school day schedule. Trump further advocated that the school day be flexible, fluid, and dependent in order to improve student learning (Queen, 2000). The most popular version of block scheduling, promoted by Rettig and Canady (1996), changes the standard yearlong courses into half-year-long courses of ninety minutes. Students enroll in four classes in the fall and four classes in the spring semester (see table 2.2).
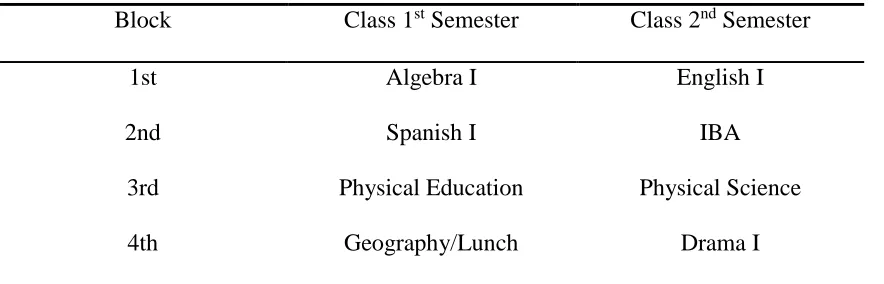
Table 2.2:
Student schedule on a 4 X 4 block schedule
Block Class 1st Semester Class 2nd Semester 1st Algebra I English I
2nd Spanish I IBA
3rd Physical Education Physical Science 4th Geography/Lunch Drama I Note. 4 X 4 Block Schedule (90 minutes per day-90 days).
The 4 X 4 block schedule meets four times per day with each block lasting
between seventy-five to ninety minutes per class for ninety days (one semester). Students take four new classes at the end of the semester; teachers receive new students at the semester and teach approximately 180 students per year. Students accumulate
40
Teachers see fewer students during the day, giving them more time for individualized instruction.
There is more time to conduct extended activities such as seminars and projects.
With the increased span of teaching time, longer cooperative learning activities can be completed in one class period.
Students have more time for reflection and less information to process over the course of the school day.
Teachers have extended time for planning.
There are less class changes, resulting in less change for discipline issues.
Students have fewer tests, quizzes and homework assignments since they have less classes.
The cons included:
Teachers see students only two to three days a week which fosters a lack of continuity from day to day.
Students have difficulty focusing for 90-minute classes.
It is difficult to cover the necessary material for Advanced Placement courses in the time allotted.
In a 4 X 4, all of the information normally taught in a semester course has to be covered in one quarter.
If a student misses a day under a 4 X 4 schedule, that is actually missing two days (NEA, 2015).
41
block setting of seventy-five to ninety minutes per day. The students attend the classes on an alternating schedule throughout the 180-day school year (Zepeda & Mayers, 2006) (see Table 2.3).
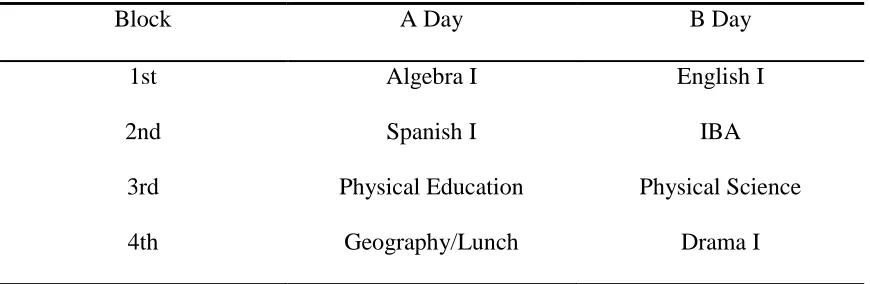
Table 2.3:
Student schedule on a modified (A/B) block schedule
Block A Day B Day
1st Algebra I English I
2nd Spanish I IBA
3rd Physical Education Physical Science 4th Geography/Lunch Drama I Note. A/B schedule (90 minutes per day-180 days).
A modified (A/B) block schedule combines components of a traditional and 4 X 4 block schedule. The modified (A/B) block schedule is sometimes used as a transition schedule for schools moving from a traditional schedule to block schedule. The modified block allows teachers to see fewer students during the day, allowing more time for
42
and students may wonder what day it is early on in the year, and teachers and students rarely meet on consecutive days. In addition, there is little opportunity for acceleration or repetition of courses, and students are expected to master six to eight classes a year (p. 49). The National Education Association (NEA) reported pros and cons to this type of schedule. The pros included:
Teachers see fewer students during the day, giving them more time for individualized instruction.
With the increased span of teaching time, longer cooperative learning activities can be completed in one class period.
Students have more time for reflection and less information to process over the course of the school day.
Teachers have extended time for planning. The cons included:
Teachers see students only two to three days a week which fosters a lack of continuity from day to day.
If a student misses a day under an A/B schedule, that is actually missing two, or sometimes even more days (NEA, 2015).
43
fieldwork. In addition, Carroll also argues that the longer periods also allow teachers to develop better relationships with their students. Advocates of block scheduling also indicate that teachers are able to get to know their students more personally and have more time to give students individual attention (Payne & Jordan, 1996; Weller & McLeskey, 2000).
Canady and Rettig (1986) stressed that block scheduling allows students to enroll in a greater number and variety of elective courses. Supporters also state that students who fail a course will be able to retake it earlier or receive immediate remediation as opposed to those students on a yearlong schedule (Evans et al., 2002; Irshmer, 1996; Queen & Isenhour, 1998; Zepeda & Mayers, 2006). In addition, block scheduling
encourages teachers to broaden their pedagogical repertoire and promote learning through smaller and more in-depth classes where teachers and students have more time to form relationships (Canady & Rettig, 1995; Evans et al., 2002; Queen & Isenhour, 1998; Rettig & Canady, 2003; Rettig & Canady, 1996; Zepeda & Mayers, 2006). O’Neil (1995) advocated that a wider variation of activities could be used on a block schedule because there is more time for hands-on activities, such as cooperative learning, and other strategies aimed at encouraging student involvement.
44
standardized EOC exams, graduation tests, state-mandated yearly performance tests, the SAT, and AP exams) have yielded mixed results (Veal & Schreiber, 1999).
In 2000 Lawrence & McPherson conducted a key study comparing student achievement on block and traditional scheduling. The researchers attempted to gain an understanding of which schedule (block or traditional) has greater potential to positively influence student achievement. Conducted in North Carolina, the study consisted of data from Algebra I, Biology, English, and United States History courses. The researchers used a cluster sample model to select the population for the study. The study revealed that the students receiving instruction on the traditional schedule scored higher on the EOC’sin the aforementioned subject areas. The study also revealed, however, that students’ final grades were higher in some block courses when compared to the final grades of students in the traditional courses (Lawrence & McPherson, 2000). Limitations to the study included time spent in class by the students and the staff development
provided to the teachers transitioning from traditional scheduling to block scheduling. The findings of this study did not isolate block scheduling as a single solution to increasing student achievement but as one piece of the puzzle to produce excellent results.
There were several available studies, which focused specifically on student achievement on varying schedules. In 1996 Schroth & Dixon found that standardized math scores were slightly higher in schools with block scheduling. Hottenstein (1998) conducted a 5-year study of a Pennsylvania high school comparing Preliminary
45
Evans et al. (2002) found New Jersey students in three different schools increased scores on the SAT and increased their passage rate by 6% on the New Jersey High School Proficiency Test (HSPT).
Cooper (1996) examined flexible scheduling in West Virginia in a collaborative research study with the University of West Virginia. The purpose of this study was to assess the relationship between an A/B schedule model implemented at Morgantown High School and student achievement. In this study Cooper analyzed the American College Test (ACT) and Comprehensive Test of Basic Skills (CTBS) exam scores from 1990-1995 to gauge student achievement on the varying schedules. The findings indicated that the ACT and CTBS scores remained close to the national average; the AP Chemistry scores, which were already 10-15% above the national average, remained the same.
In a study conducted by the College Board in 1998, students in extended traditional-schedule AP Biology and AP Calculus classes did significantly better than those students on a 4 X 4 block schedule. In contrast, as cited by Evans et al. (2002), Edwards (1995) reported an increased number of students passing the AP tests with a score of 3 or 4 in the Orange County, Virginia, school system, which utilized the 4 X 4 block schedule. He also found improvements in AP exam scores after block scheduling was implemented in various schools. Studies conducted on AP scores under traditional and block schedules produced mixed results.
46
and tenth grade scores from the Florida Comprehensive Assessment Test (FCAT) in reading and math were used to measure academic achievement. Cosimano found that significant differences in student achievement existed on the varying schedules. The FCAT ninth grade mean score from the school on the modified block schedule was higher than the FCAT ninth grade mean score from all the other schools, except for one of the schools with a traditional schedule. The same was true for the FCAT tenth grade mean score for both math and reading. Cosimano concluded that students on the modified block schedule, in comparison to students on the other two block schedules, achieved higher scores. This conclusion supports Oven (2004) who found that academic achievement was positively impacted by a modified block schedule because of increased instructional time.
47
Wright (2010) conducted a longitudinal study that evaluated the impact of scheduling on student achievement. The study was conducted in South Carolina over a twenty-year period. The graduation rates, SAT scores, and Basic Skills Assessment Program (BSAP)/High School Assessment Program (HSAP) scores were examined for ten years on a traditional schedule and ten years on an A/B schedule. The SAT math mean scores showed an increase of nineteen points on the modified block schedule. The BSAP/HSAP scores showed significant improvement during the block schedule years. The South Carolina Department of Education discontinued the use of the BSAP/HSAP as an exit examination for high school students in 2012.
Norton (2010) conducted a study to determine if significant differences existed in ELA and math scores on the HSAP exit exam among South Carolina schools with semester block schedules, modified A/B block schedules, or traditional seven-period schedules. A comparison of the English and math passage rates for 131 schools yielded no significant differences between the mean scores on the SAT and HSAP scores.
Different studies with a variety of scheduling options and combinations have yielded inconsistent results. While studies of student achievement in ELA on year-end tests and high-stakes tests and the SAT have been statistically significant, in the study of math and science, there is little evidence to support that students show any improvement on the block schedule (Eineder & Bishop, 1997; Gruber & Onwuegbuzie, 2001;
48
Zelkowski (2010) stated, “The research community is confused by the mixed findings of block scheduling” (p. 10). He noted little difference in teaching styles and practices between block and traditional classes. Zelkowski also noted that professional development seemed to be the key factor often neglected in block scheduling
implementation (Zelkowski, 2010). There are very few empirical studies that suggest that students enrolled in block schedule outperform those enrolled in traditional or modified block schedules (Bowman, 1998). In a review of literature on the effects of block scheduling, Trenta and Newman (2002) reported, “Over the last decade, a number of studies and evaluations have been done on block scheduling in which some have found evidence of improved student achievement. Others found no significant improvement or significant decline” (p. 55).
Summary
The literature presented indicates that Actual Cohort Graduation Rate is
influenced by many factors. One of the most important factors is course performance in critical courses such as Algebra I in the ninth grade year of high school. An extensive review of the literature from past to present on scheduling types indicates that the block schedule is perceived as more beneficial to students and teachers. The literature outlines the benefits of extended planning time, fewer students, and opportunities for project- based activities for teachers. For students, the benefits lie in less homework,
49
(Canady & Rettig, 1995; Kruse & Kruse, 1995; Bowman, 1998; Zelkowski, 2010;
Eineder & Bishop, 1997; Gruber & Onwuegbuzie, 2001; Lawrence & McPherson, 2000). There was a gap in the literature, however, on modified (A/B) block scheduling and student achievement.
Previous studies have demonstrated that minority students from low socioeconomic backgrounds are less likely to graduate. Thus, efforts to positively influence high school completion for all students are needed. This study will examine mathematic achievementof first-year high school students to determine if there is a relationship between their success on the SC Algebra I EOC and the type of scheduling model used to deliver Algebra I classes. The analysis will determine if a statistically significant difference in student achievement exists between students on a 4 X 4 block and modified (A/B) block schedule. Student success will be measured by exam scores on the Algebra I End-of-Course Test. This study will also examine if statistically significant differences in performance exist, measured by exam scores, on the South Carolina
Algebra I EOC assessment by ethnicity, gender, and SES. The results of this study will help educators design schedules that are more effective for all students.
Chapter Three outlines and explains the design and methodology of the research. This section includes the study design, rationale, participation explanations, data
50
CHAPTER 3
METHODOLOGY
This chapter examines the research design and methodology used in this study to investigate the relationship between scheduling and student exam scores on the South Carolina Algebra I EOC assessment. In addition, an analysis of descriptive statistics including gender, ethnicity, and SES will be conducted to provide further insight into student exam scores on the South Carolina Algebra I EOC assessment. The researcher acknowledges that there are many variables involved in student achievement on
assessments. One variable examined is SES. Turkheimer, Haley, Waldron, D’Onofrio & Gottsman (2003) state that children raised in poverty are severely limited in their
intellectual potential by their environment and other factors. Researchers, educators and policymakers assert that one of the most important factors in the academic success of high school students lies in the structure of the school schedule (Zepeda & Mayers, 2006). Goodlad (1984) stated that the school “time is virtually the most important resource” (p. 30).